

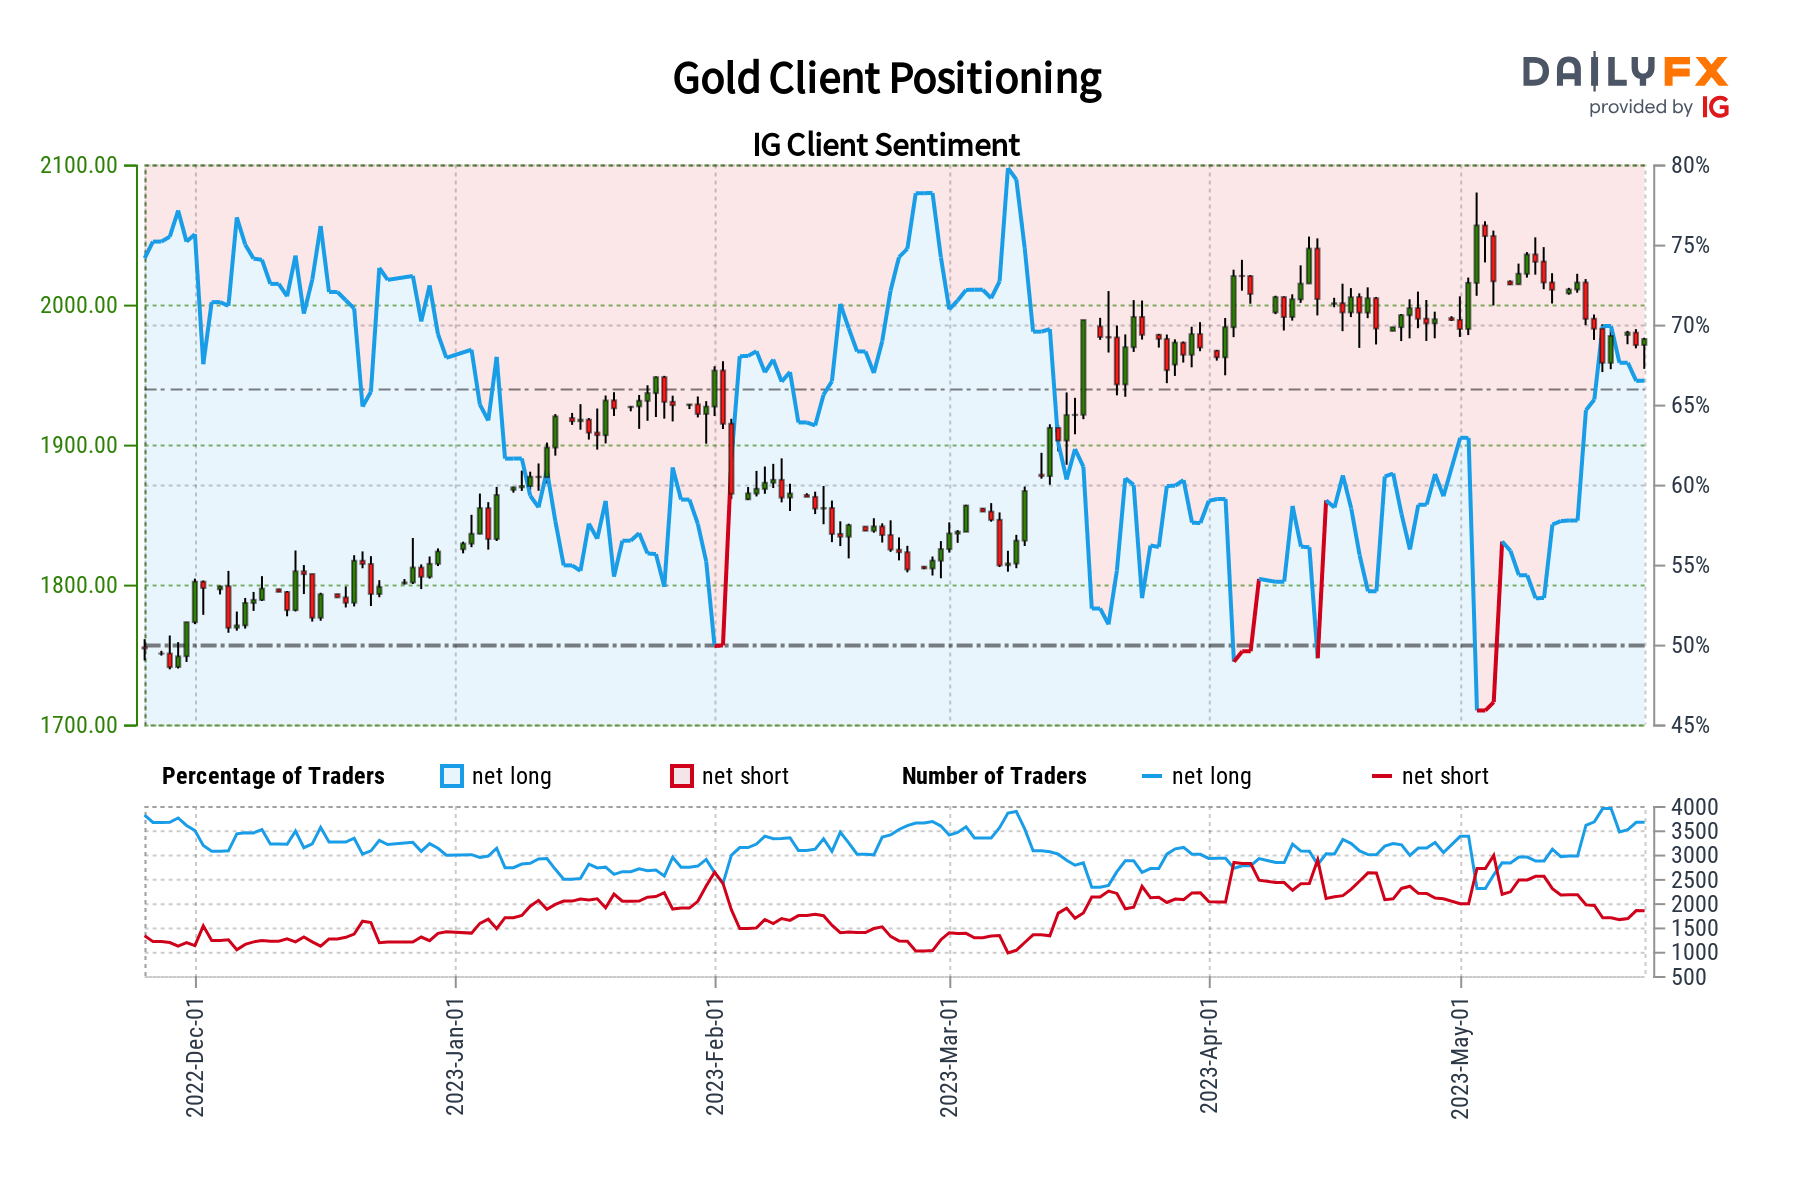
Gold Sentiment Outlook – Bearish
The IGCS gauge shows that about 66% of retail traders are net-long gold. Since most of them are biased higher, this hints that prices may continue falling. This is as upside exposure increased by 1.79% and 12.32% compared to yesterday and last week, respectively. With that in mind, the combination of current sentiment and recent changes offers a stronger bearish contrarian trading bias.
XAU/USD Daily Chart
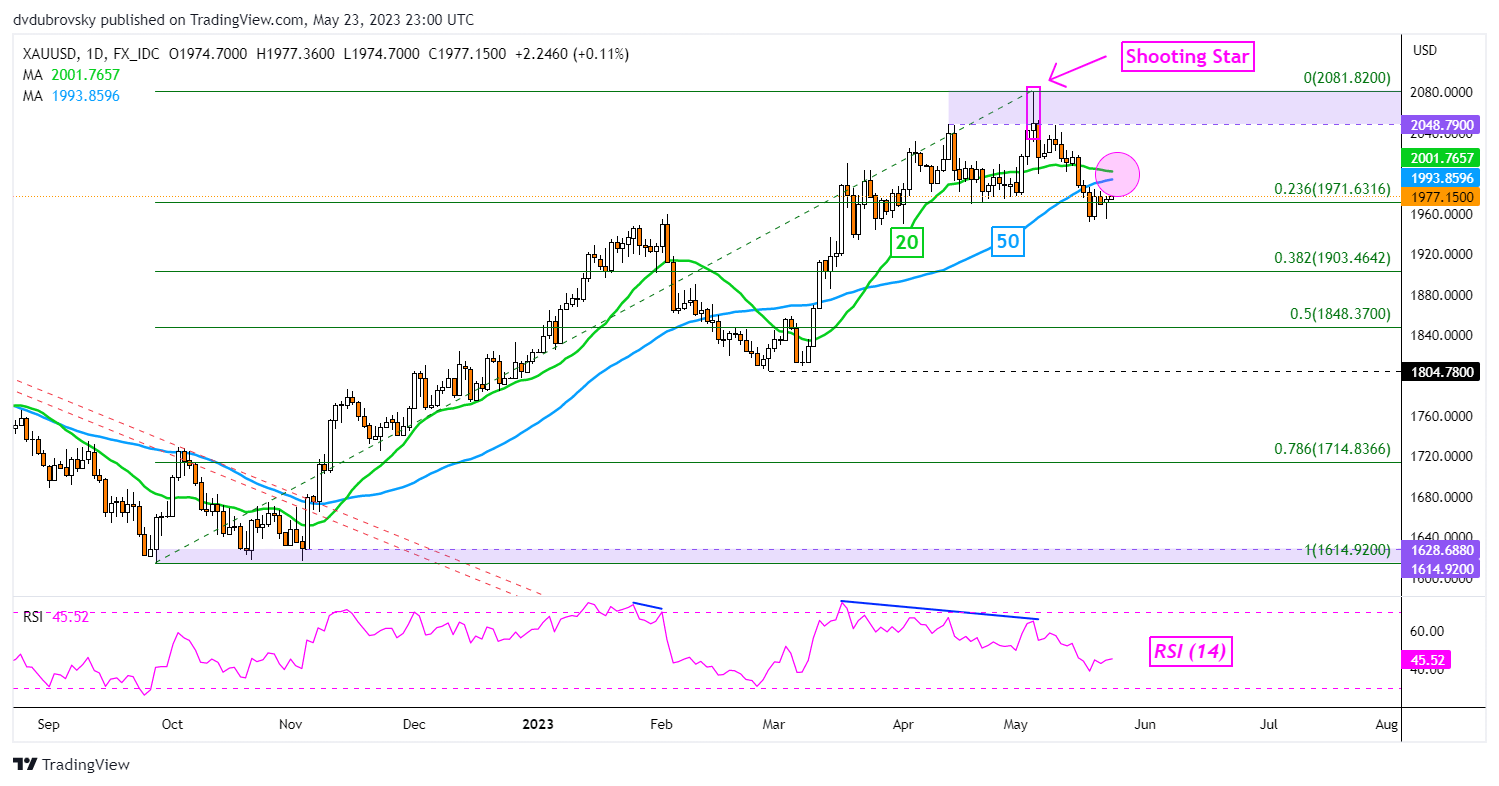
On the daily chart, a bearish Death Cross between the 20- and 50-day moving averages could be in store for gold. This is as prices are testing the 23.6% Fibonacci retracement level at 1971. Confirming a downside breakout exposes the 38.2% level at 1903. Otherwise, a turn higher places the focus on current 2023 highs, making for a wide range of resistance between 2048 – 2081.
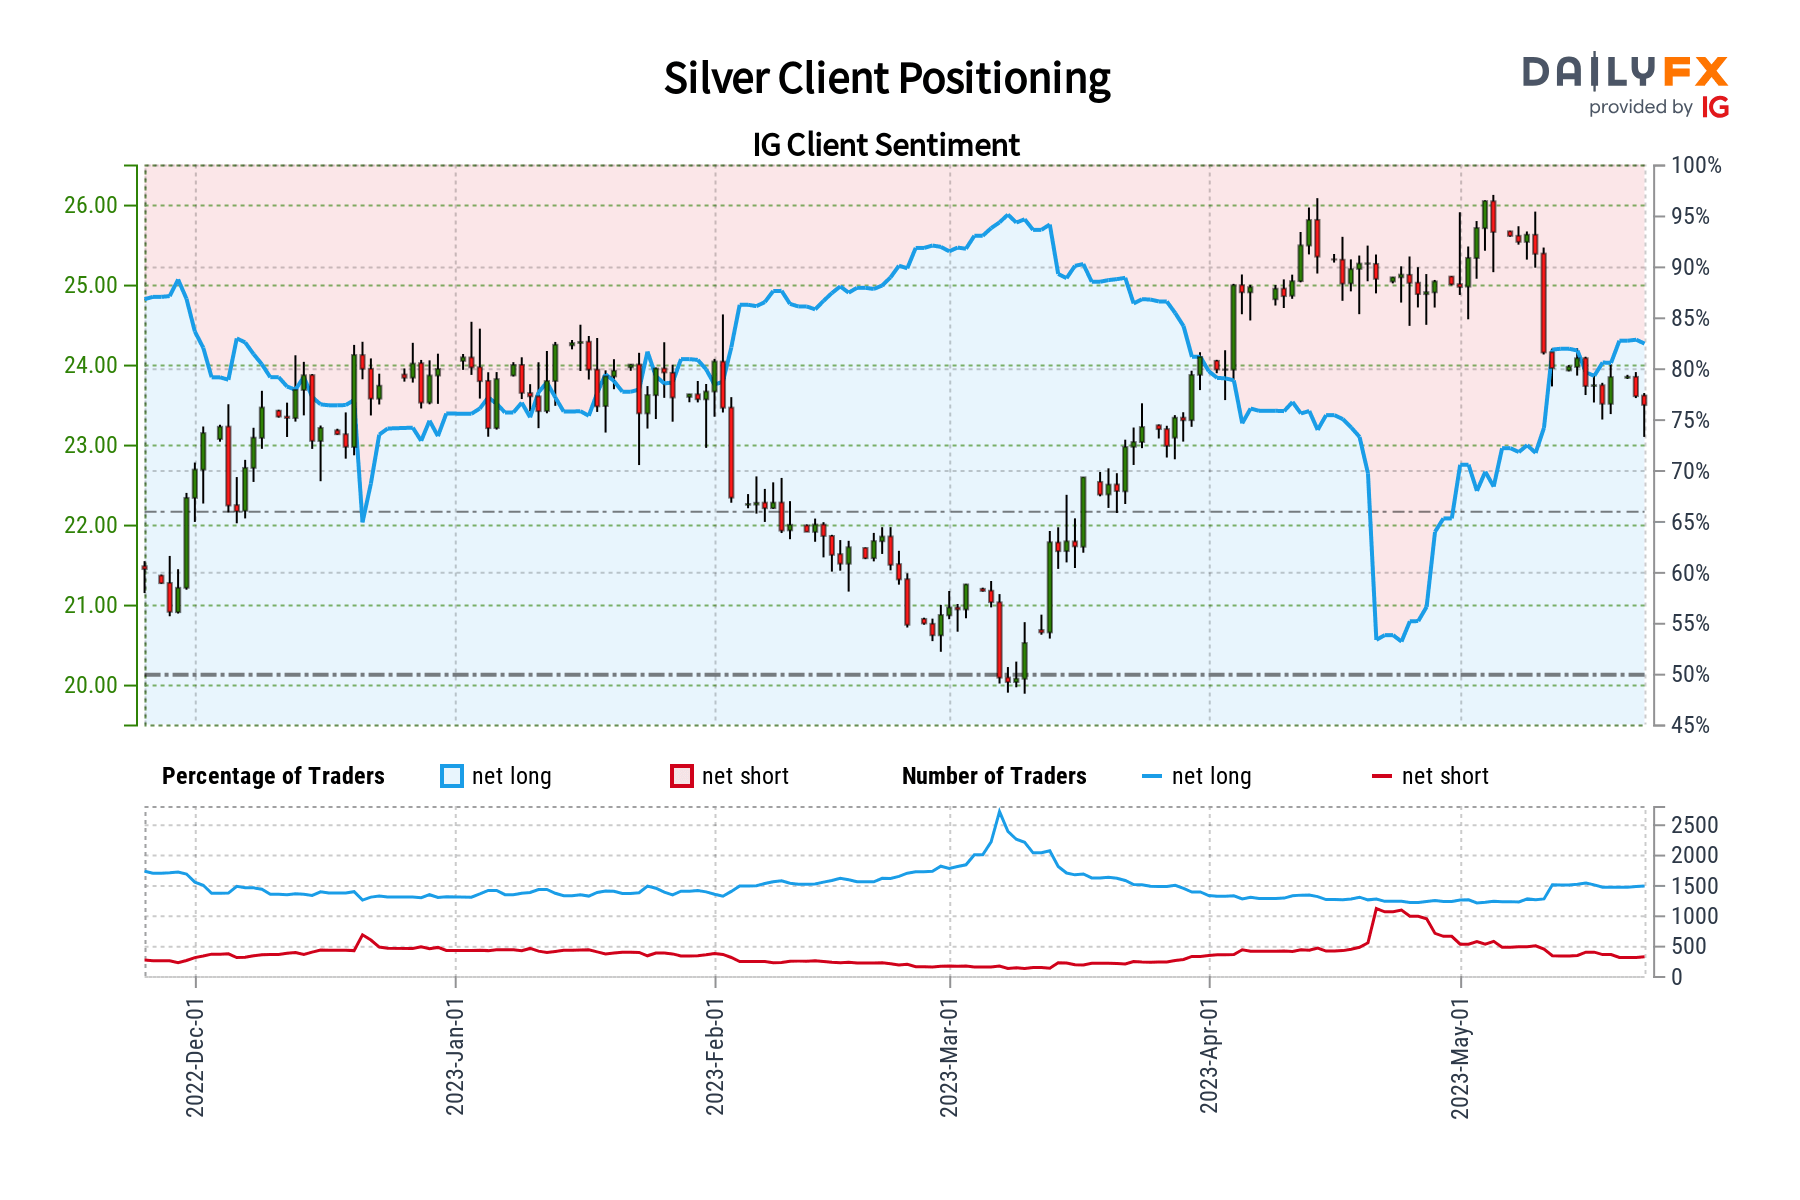
Silver Sentiment Outlook – Bearish
The IGCS gauge reveals that roughly 83% of retail traders are net-long silver. Since most of them are net-long, this hints that prices may continue falling. This is as downside exposure decreased by 2.6% and 24.81% compared to yesterday and last week, respectively. With that in mind, this is producing a stronger bearish contrarian trading bias.
XAG/USD Daily Chart
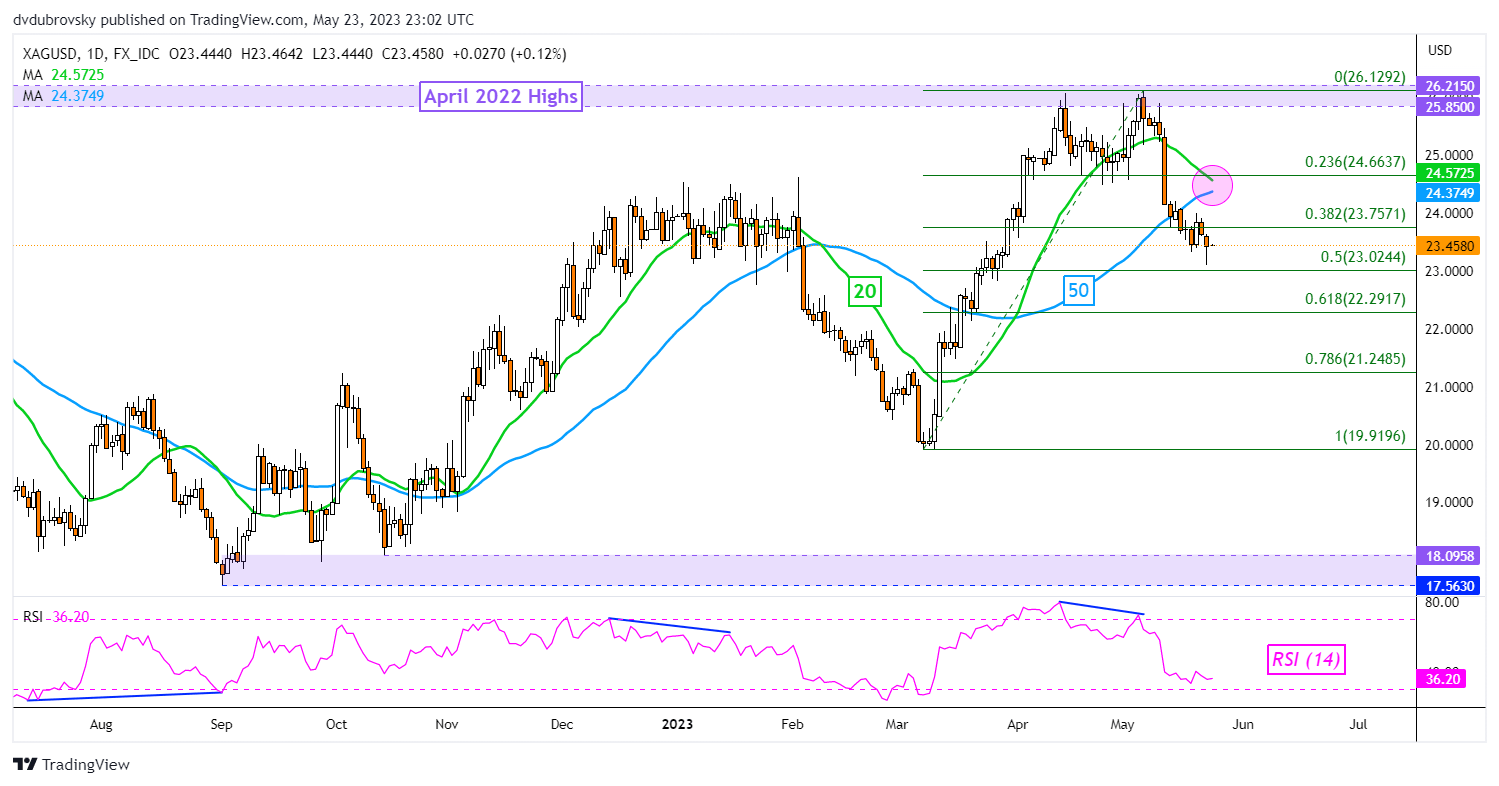
A bearish Death Cross between the same moving averages may also be in store for silver soon. That would open the door to an increasingly downside technical bias. Immediate support is the midpoint of the Fibonacci retracement at 23.02. Extending lower exposes the 61.8% point at 22.2917. Otherwise, a turn higher places the focus on the 38.2% level at 23.757.
 Chat now!
Add a Comment