

It is a quiet morning for the USD/JPY. There are no economic indicators from Japan to influence the Bank of Japan and the ultra-loose monetary policy stance.
However, economic indicators from China will set the tone, with Q2 GDP, industrial production, and retail sales in focus. To date, the markets have avoided a flight-to-safety, with expectations of a stimulus package from Beijing limiting the impact of weak data from China.
Trading Derivatives carries a high level of risk to your capital and you should only trade with money you can afford to lose. Trading Derivatives may not be suitable for all investors, so please ensure that you fully understand the risks involved, and seek independent advice if necessary. A Product Disclosure Statement (PDS) can be obtained either from this website or on request from our offices and should be considered before entering into a transaction with us. Raw Spread accounts offer spreads from 0.0 pips with a commission charge of USD $3.50 per 100k traded. Standard account offer spreads from 1 pips with no additional commission charges. Spreads on CFD indices start at 0.4 points. The information on this site is not directed at residents in any country or jurisdiction where such distribution or use would be contrary to local law or regulation.
Particularly weak GDP and industrial production numbers could question how much Beijing can support the economy.
The US Session
It is a quiet day on the US economic calendar. NY Empire State Manufacturing numbers for July will be in focus. However, barring a sharp decline, we do not expect the report to influence market risk sentiment.
According to the ISM survey, the US manufacturing sector contracted for the eighth consecutive month in June. The numbers from New York State would have to be particularly weak to draw interest.
While the economic calendar is on the light side, there are no FOMC member speeches to consider. The Fed went into the blackout period on July 15.
After a tumultuous week for the greenback, the markets are betting on a final 25-basis point Fed rate hike on July 26. According to the CME FedWatch Tool, the probability of a 25-basis point July Fed rate hike was 96.1% versus 93.0% one week earlier. Significantly, the chances of the Fed lifting rates to 5.75% in September stood at 15.4%, down from 24.2% one week earlier.
USD/JPY Price Action
Daily Chart
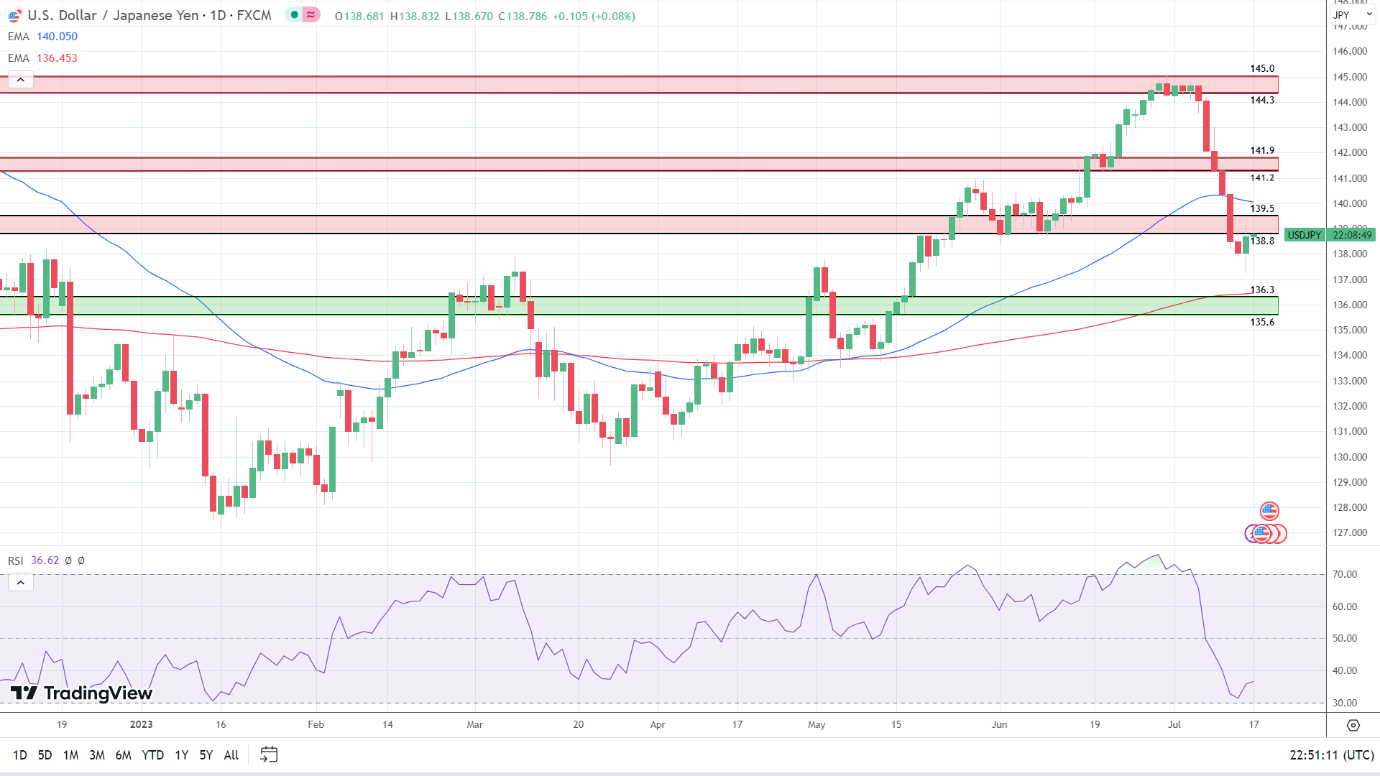
The Daily Chart showed the USD/JPY briefly fell through the 138 psychological level and remained below the 139.5 – 138.8 resistance band. Significantly, the USD/JPY also fell back from the 50-day EMA (140.050). However, the USD/JPY remained above the 200-day EMA (136.453), signaling bearish momentum over the near term but bullish momentum over the longer-term time horizon.
Notably, the 50-day EMA narrowed on the 200-day EMA and reflected bearish momentum.
Looking at the 14-Daily RSI, the 36.62 reading signals a bearish outlook, aligning with the 50-day EMA (140.050) to target sub-137.50 and the 136.3 – 135.6 support band. However, a USD/JPY move through the lower level of the 138.8 – 139.5 resistance band would bring 139.5 and the 50-day EMA (140.050) into view.
4-Hourly Chart
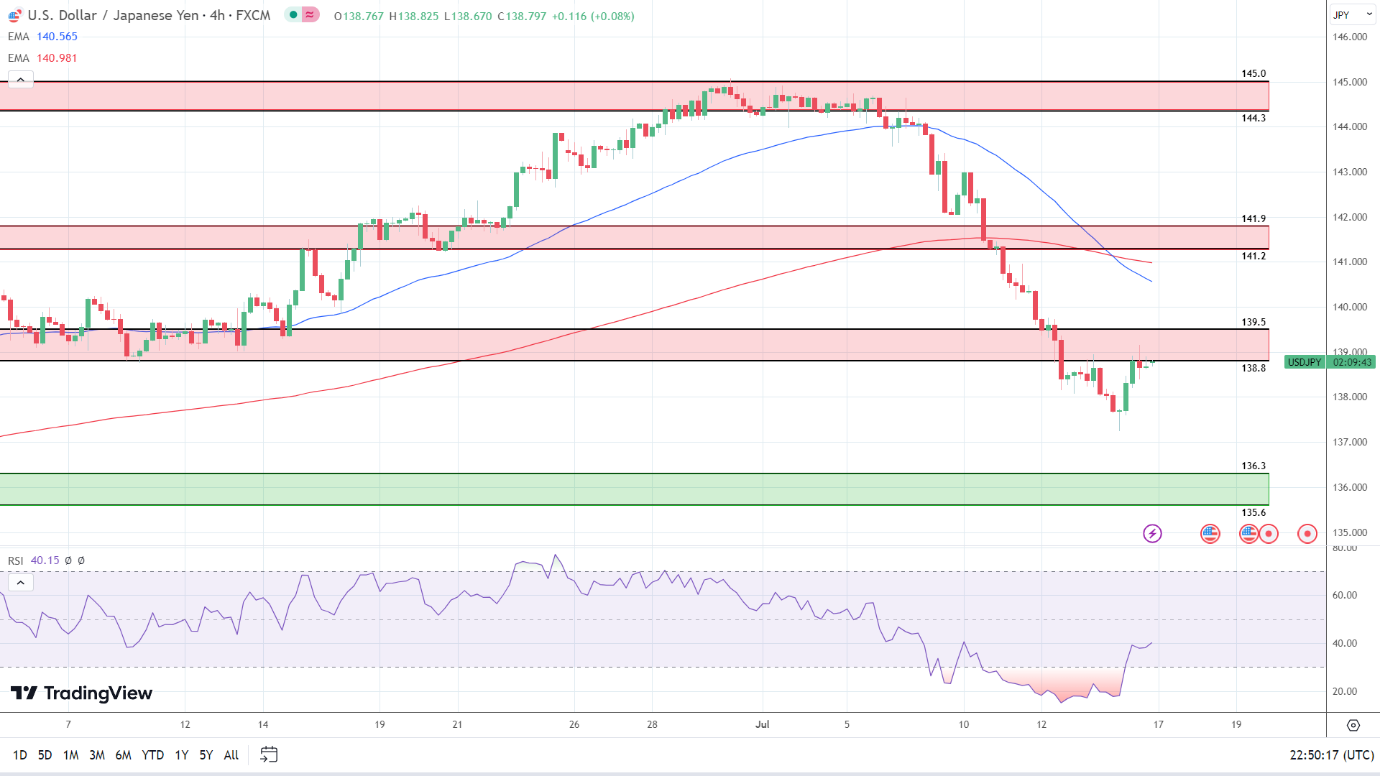
Looking at the 4-Hourly Chart, the USD/JPY faces strong resistance at 139. The USD/JPY remained below the 50-day (140.565) and 200-day (140.981) EMAs, sending bearish signals.
Significantly, the 50-day EMA pulled back from the 200-day EMA, signaling a return to sub-138 to bring the 136.3 – 135.6 support band into view.
The 14-4H RSI reading of 40.15 sends bearish signals, with selling pressure outweighing buying pressure. Notably, the RSI bearish aligned with the 50-day EMA, signaling a fall to sub-137.5 to target the 136.3 – 135.6 support band.
 Chat now!
Add a Comment