

Friday Overview
The AUD/USD fell by 0.24% on Friday. Following a 0.98% slump on Thursday, the Aussie Dollar ended the week flat at $0.64015. The Aussie dollar rose to an early Friday afternoon high of $0.64413 before sliding to a session low of $0.63643. Fed Chair Powell sent the Australian Dollar into the red before late support reduced the deficit.
Australian Retail Sales to Test the RBA Pause Theory
Bets on a September RBA rate hike have fallen in recent weeks. The Australian annual inflation rate softened from 7.0% to 6.0%, with Australian employment figures supporting a wait-and-see approach next month.
Trading Derivatives carries a high level of risk to your capital and you should only trade with money you can afford to lose. Trading Derivatives may not be suitable for all investors, so please ensure that you fully understand the risks involved, and seek independent advice if necessary. A Product Disclosure Statement (PDS) can be obtained either from this website or on request from our offices and should be considered before entering into a transaction with us. Raw Spread accounts offer spreads from 0.0 pips with a commission charge of USD $3.50 per 100k traded. Standard account offer spreads from 1 pips with no additional commission charges. Spreads on CFD indices start at 0.4 points. The information on this site is not directed at residents in any country or jurisdiction where such distribution or use would be contrary to local law or regulation.
However, wage growth and retail sales figures could force investors to rethink the pause theory. With wage growth elevated, a pickup in consumer spending could refuel bets on an RBA rate hike. Consumer spending drives demand-driven inflationary pressures. Another interest rate hike would impact disposable incomes and ease consumer demand-driven inflationary pressures.
Economists forecast retail sales to increase by 0.3% in July versus a 0.8% slump in June. A reversal of the June decline would support a more hawkish RBA policy outlook.
Fed Policy Bets and China Leave the Aussie Dollar under Pressure
Monetary policy divergence sits firmly in favor of the dollar this morning. The hawkish Fed Chair Powell speech leaves Fed rate hikes on the table. This week, US economic indicators will likely cement the Fed interest rate decision for September.
However, FOMC members must stick to the Fed Chair Powell script to drive bets on a September move.
This afternoon, Dallas Fed Manufacturing Index numbers are unlikely to impact sentiment toward Fed monetary policy.
The US manufacturing sector contributes less than 30% to the US economy. We expect investors and the Fed to brush aside the numbers, with wage growth, labor market conditions, and consumer demand-driven inflation the focal points.
However, investors should monitor the news wires for FOMC member commentary that would move the dial.
AUD/USD Price Action
Daily Chart
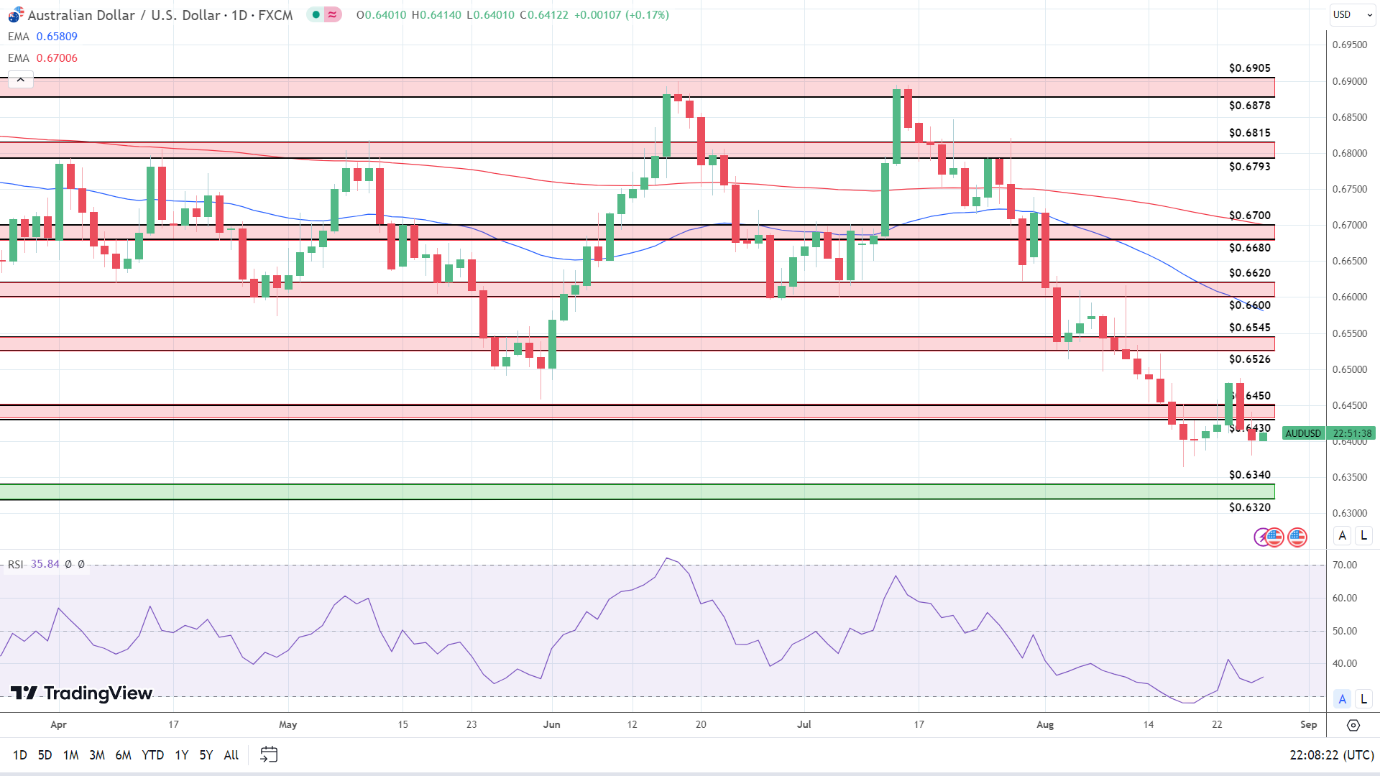
The Daily Chart showed the AUD/USD below the $0.6430 – $0.6450 resistance band. Significantly, the Aussie dollar remained below the 50-day and 200-day EMAs, sending bearish near and longer-term price signals.
The 14-Daily RSI at 35.84 reflects a bearish sentiment. The RSI and EMAs signal a fall to sub-$0.64 to bring the $0.6340 – $0.6320 support band into play. However, a move through the lower level of the $0.6430 – $0.6450 resistance band would give the bulls a look at $0.6450.
4-Hourly Chart
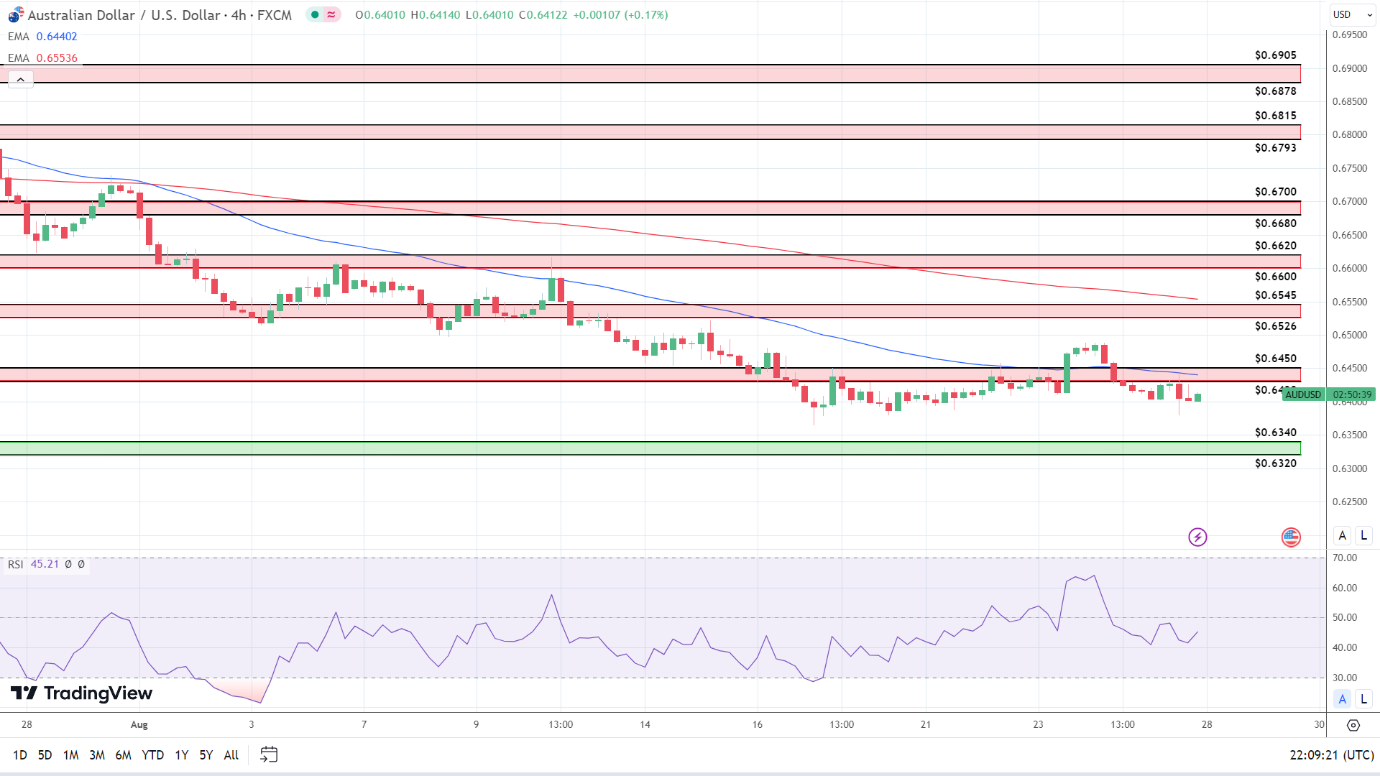
Looking at the 4-Hourly Chart, the AUD/USD sits below the $0.6430 – $0.6450 resistance band. After the Thursday and Friday losses, the AUD/USD hovers below the 50-day and 200-day EMAs, affirming the bearish near and longer-term price signals.
Looking at the 14-4-Houly RSI, 45.21 also reflects a bearish sentiment, with selling pressure overweighing buying pressure. The RSI and the EMAs signal a return to sub-$0.64 to bring the $0.6340 – $0.6320 support band into play. However, a move through the lower level of the $0.6430 – $0.6450 resistance band would bring the 50-day EMA and $0.6450 into play.
 Chat now!
Add a Comment