

Bitcoin, Ethereum and XRP Forecast Video for 10.10.23
Top cryptocurrencies remained under pressure in Tuesday’s Asian session, following a sell-off on Monday amid increasing geopolitical tensions in the Middle East. Investors remain on edge about a drawn-out conflict in the region and the potential for further escalation if other countries get involved in the war.
Trading Derivatives carries a high level of risk to your capital and you should only trade with money you can afford to lose. Trading Derivatives may not be suitable for all investors, so please ensure that you fully understand the risks involved, and seek independent advice if necessary. A Product Disclosure Statement (PDS) can be obtained either from this website or on request from our offices and should be considered before entering into a transaction with us. Raw Spread accounts offer spreads from 0.0 pips with a commission charge of USD $3.50 per 100k traded. Standard account offer spreads from 1 pips with no additional commission charges. Spreads on CFD indices start at 0.4 points. The information on this site is not directed at residents in any country or jurisdiction where such distribution or use would be contrary to local law or regulation.
During Monday’s session, data from crypto analytics site CoinGlass revealed investors had suffered more than $100 million in long position liquidations amid the market plunge, the largest since early September. A crypto liquidation event occurs when the value of a trader’s assets falls below a predetermined threshold, triggering an automatic sell-off to cover losses or repay borrowed funds. This risk management mechanism helps prevent further losses but can lead to substantial asset sell-offs in volatile market conditions.
Below, we turn to technical analysis to identify important trading levels in Bitcoin (BTC), Ethereum (ETH) and Ripple’s XRP (XRP).
Technical Analysis: Bitcoin, Ethereum and XRP
Bitcoin
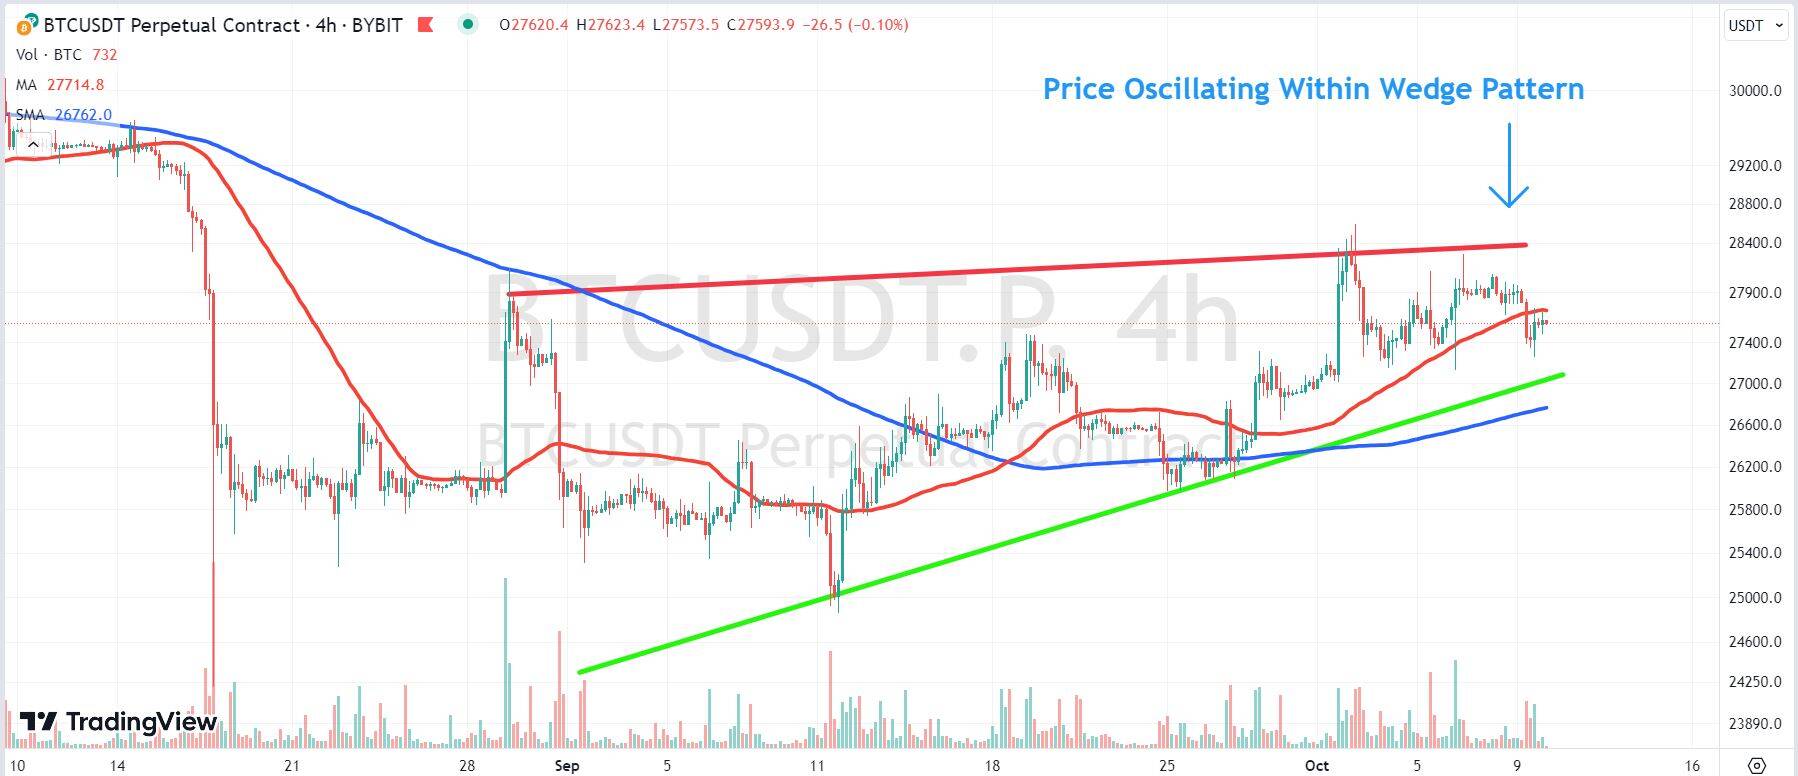
Bitcoin’s price continues to oscillate within a wedge pattern, a chart formation that typically breaks to the downside. Moreover, the largest cryptocurrency by market capitalization trades below the 50 moving average, indicating bearish sentiment. A further rejection at this closely watched indicator may lead a decline to the pattern’s lower trendline where support sits at $27,070. Alternatively, a close above the 50 SMA could see retest of the wedge’s upper trendline at the $28,400 level.
Ethereum
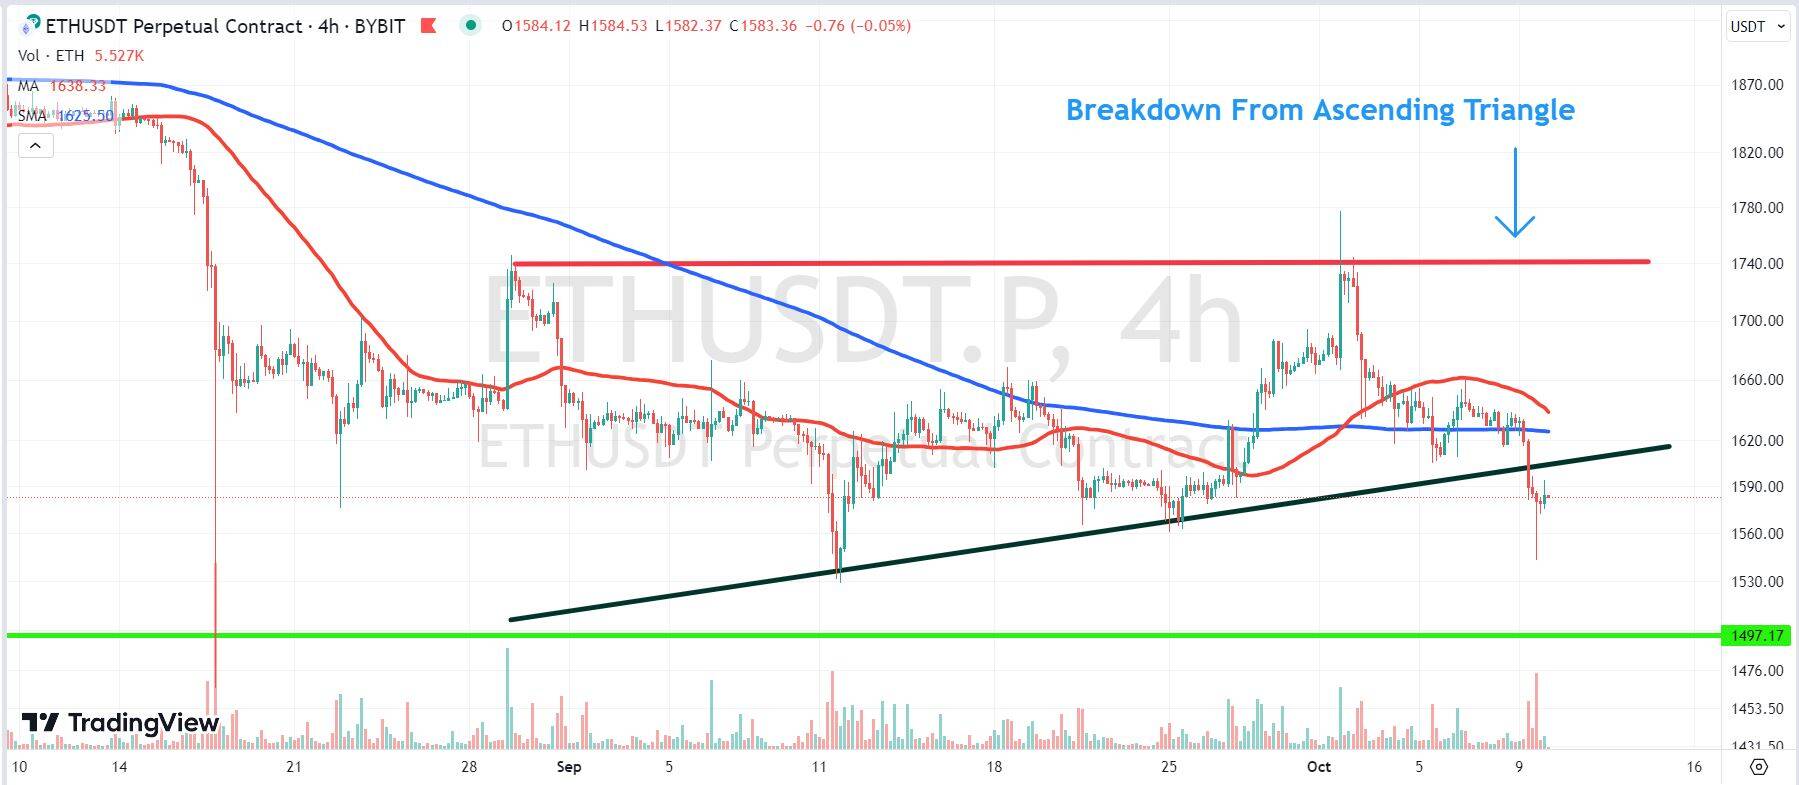
Ethereum’s price has staged a breakdown below the lower trendline of a broad ascending triangle. The moved occurred on average volume, making it difficult to predict future price direction. A further rejection at the triangle’s lower trendline could see bears make another attempt at longer-term support around the psychological $1,500 level. Conversely, a close back above the pattern’s lower trendline could indicate a bear trap and see bulls make a run toward overhead resistance at $1,740.
XRP
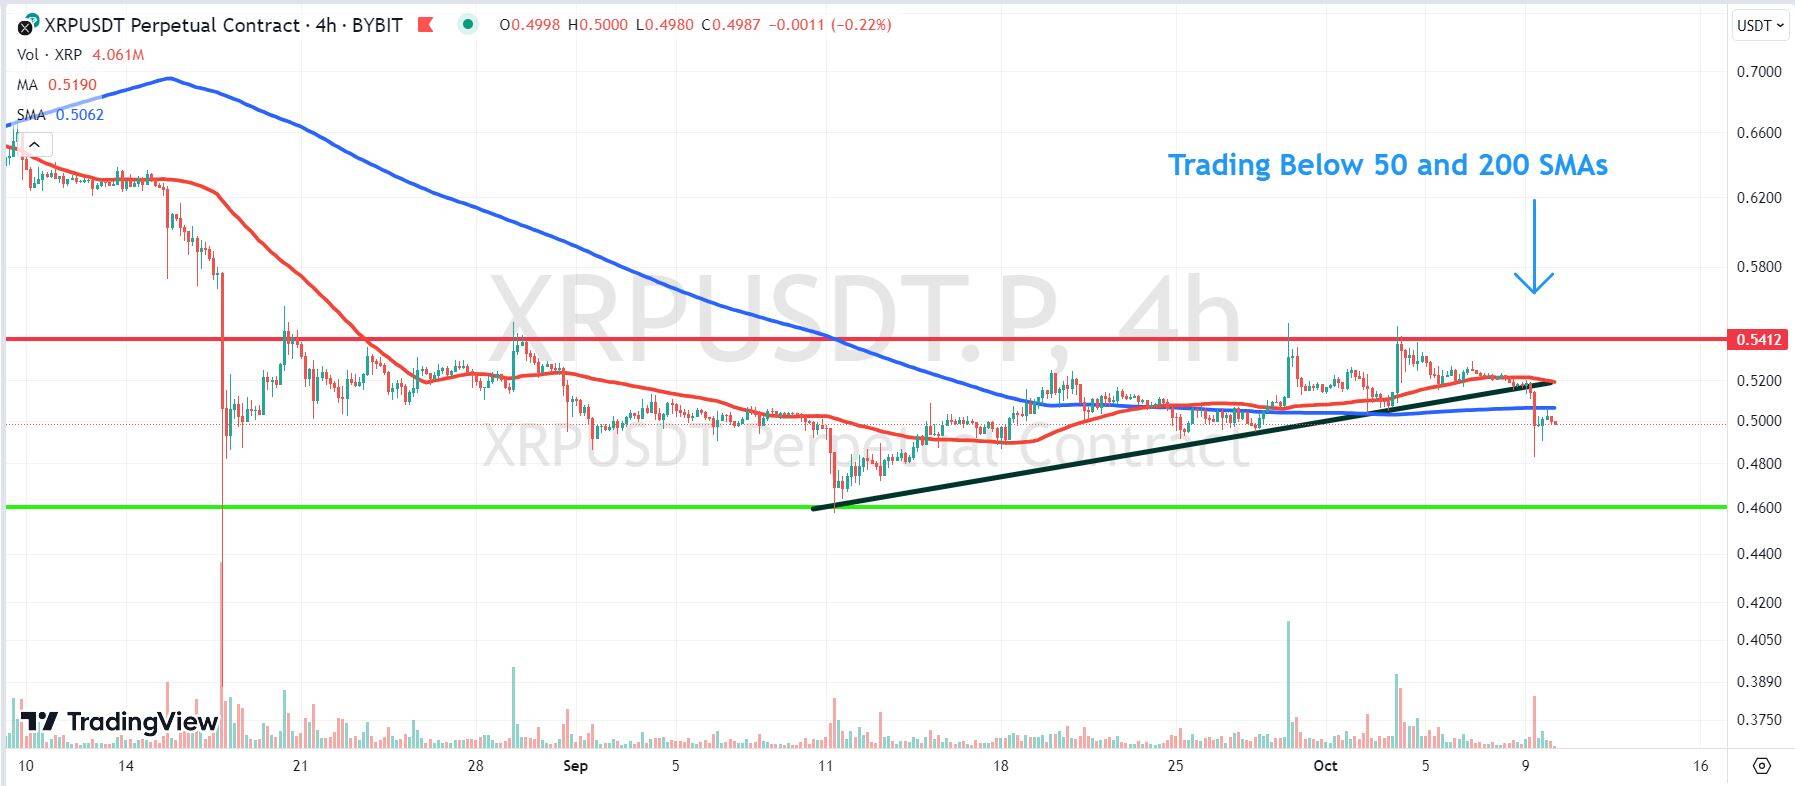
Like Ethereum, XRP’s price has broken down below the lower trendline of an ascending triangle on average volume. It also trades under both the 50 and 200 moving averages, confirming a bearish bias. A continuation of selling at these levels opens the door for falls to crucial support at 0.46. However, a close back above the 200 SMA could give bulls the confidence to revisit key overhead resistance around $0.54.
 Chat now!
Add a Comment