

Quick Fundamental Outlook
The discrepancies arose over an Israeli airstrike in Gaza: local authorities reported 500 hospital casualties, while Israel attributed it to a Palestinian attack, as per Reuters. These geopolitical tensions and positive economic data from China might influence precious metals.
China’s Q3 GDP surpassed forecasts, registering a 1.3% growth against the predicted 1.0%. The annual growth for the same period was 4.9%, beating the 4.4% estimate.
Trading Derivatives carries a high level of risk to your capital and you should only trade with money you can afford to lose. Trading Derivatives may not be suitable for all investors, so please ensure that you fully understand the risks involved, and seek independent advice if necessary. A Product Disclosure Statement (PDS) can be obtained either from this website or on request from our offices and should be considered before entering into a transaction with us. Raw Spread accounts offer spreads from 0.0 pips with a commission charge of USD $3.50 per 100k traded. Standard account offer spreads from 1 pips with no additional commission charges. Spreads on CFD indices start at 0.4 points. The information on this site is not directed at residents in any country or jurisdiction where such distribution or use would be contrary to local law or regulation.
China’s year-over-year retail sales also saw an increase of 5.5%, outdoing the previous 4.6% and anticipated 4.9%. This could have ripple effects on gold, silver, and copper prices.
Gold Prices Forecast

Gold (XAU/USD) has seen a positive trajectory today, with the price settling at a robust $1939.845, marking a commendable increase of +1.09% over the past 24 hours. Analyzing the 4-hour chart, the metal currently stands just above a pivotal point of $1932. Looking at resistance and support levels, the immediate resistance is pegged at $1950, followed by $1967 and $1984.
Conversely, gold finds its immediate support at $1909, with further cushions at $1886 and $1869. The technical indicators reveal noteworthy insights. With the Relative Strength Index (RSI) at 73, the metal is overbought, signalling strong bullish momentum.
Furthermore, the Moving Average Convergence Divergence (MACD) indicates a potential upward momentum as the MACD line is above the signal line. The price above its 50-day Exponential Moving Average (EMA) of $1895 further accentuates the short-term bullish sentiment.
From a chart pattern perspective, a bullish engulfing candle coupled with a breakout above the $1931 resistance suggests the possibility of more upward movement in the near future.
In conclusion, the overall trend for gold appears bullish above $1932.
Silver Prices Forecast
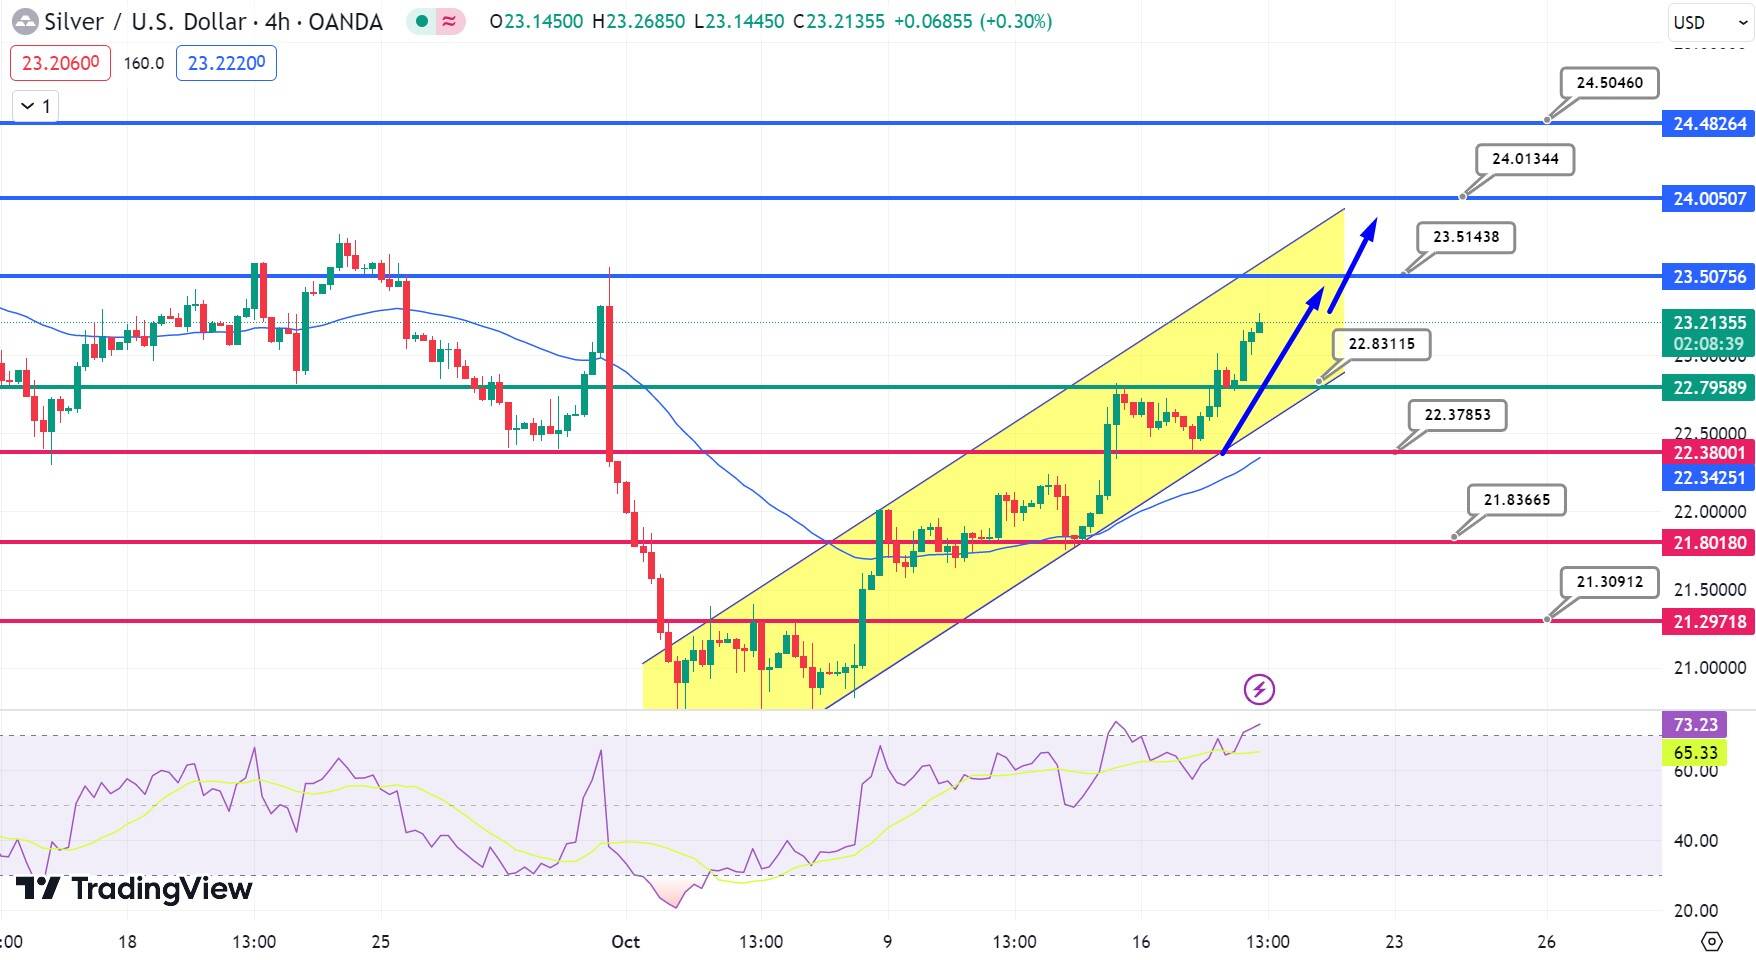
Silver (XAG/USD)‘s performance today displayed an upward momentum, with its value closing at $23.1764, representing a +1.78% increase over the past 24 hours. Analyzing its position on a 4-hour chart, silver is positioned just above the critical pivot point of $22.83.
When deciphering resistance and support metrics, the immediate resistance is noted at $23.51, with subsequent resistances at $24.01 and $24.50. Conversely, support levels are charted at $22.38, with subsequent support barriers at $21.84 and $21.31.
Diving into technical specifics, the Relative Strength Index (RSI) stands at 72, indicating that silver is in overbought conditions, reflecting an undercurrent of bullish sentiment. Its positioning above the 50-day Exponential Moving Average (EMA) of $22.34 reinforces this bullish inclination.
Chart patterns, notably the upward channel and the presence of the ‘Three White Soldiers’ candlestick formation, further affirm the bullish trajectory for silver, targeting the $23.50 mark. In conclusion, silver manifests a bullish trend beyond $22.85. The short-term forecast anticipates silver to challenge upper resistance levels soon.
Copper Prices Forecast
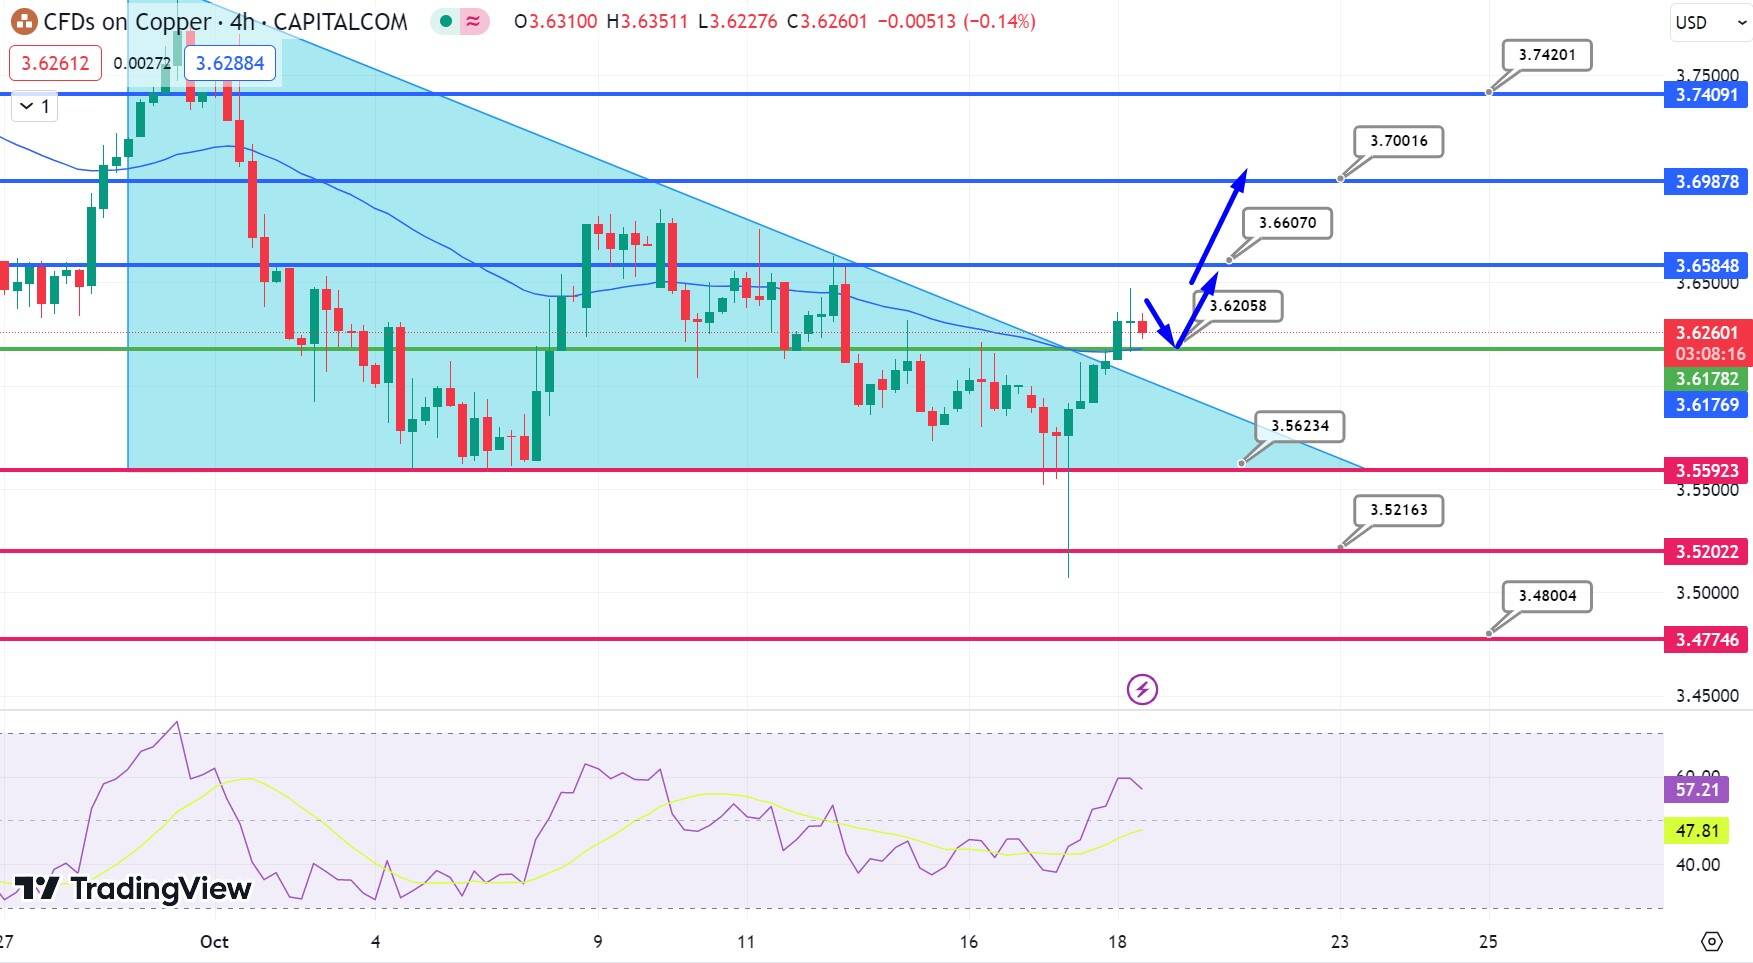
Mapping the resistance and support terrains, the metal encounters its first resistance at $3.66, followed closely by $3.70 and $3.74. On the defensive side, Copper finds sanctuary at $3.56, with subsequent fallbacks set at $3.52 and $3.48.
From a technical lens, Copper’s standing just above its 50-day Exponential Moving Average (EMA) of $3.62 hints at a short-term bullish trend. The chart elucidates a prominent descending triangle breakout around the $3.60 mark, which promotes a buying sentiment.
The consecutive candle closures outside this triangle coupled with the 50 EMA bullish crossover further endorses the bullish tilt. Summarily, Copper showcases a bullish demeanor past the $3.62 threshold.
 Chat now!
Add a Comment