

Quick Fundamental Outlook
The global cryptocurrency market cap has slightly adjusted to stand at $1.3 trillion today, marking a decline of 1.30% within the last 24 hours. However, when zooming out to an annual perspective, the market exhibits a robust growth of 27.15%.
Furthermore, it’s worth noting the substantial market cap of Stablecoins, which stands at $124 Billion, securing a 9.52% chunk of the total cryptocurrency market cap.
Trading Derivatives carries a high level of risk to your capital and you should only trade with money you can afford to lose. Trading Derivatives may not be suitable for all investors, so please ensure that you fully understand the risks involved, and seek independent advice if necessary. A Product Disclosure Statement (PDS) can be obtained either from this website or on request from our offices and should be considered before entering into a transaction with us. Raw Spread accounts offer spreads from 0.0 pips with a commission charge of USD $3.50 per 100k traded. Standard account offer spreads from 1 pips with no additional commission charges. Spreads on CFD indices start at 0.4 points. The information on this site is not directed at residents in any country or jurisdiction where such distribution or use would be contrary to local law or regulation.

Global Cryptocurrency Market Cap Charts
Bitcoin Market Cap
Bitcoin (BTC) currently encapsulates a market cap of $665 billion, cementing its dominance at 52.90% of the total crypto market. This dominance is a testament to Bitcoin’s continued significance and stature in the crypto realm.
This dominance is a testament to Bitcoin’s continued significance and stature in the crypto realm.
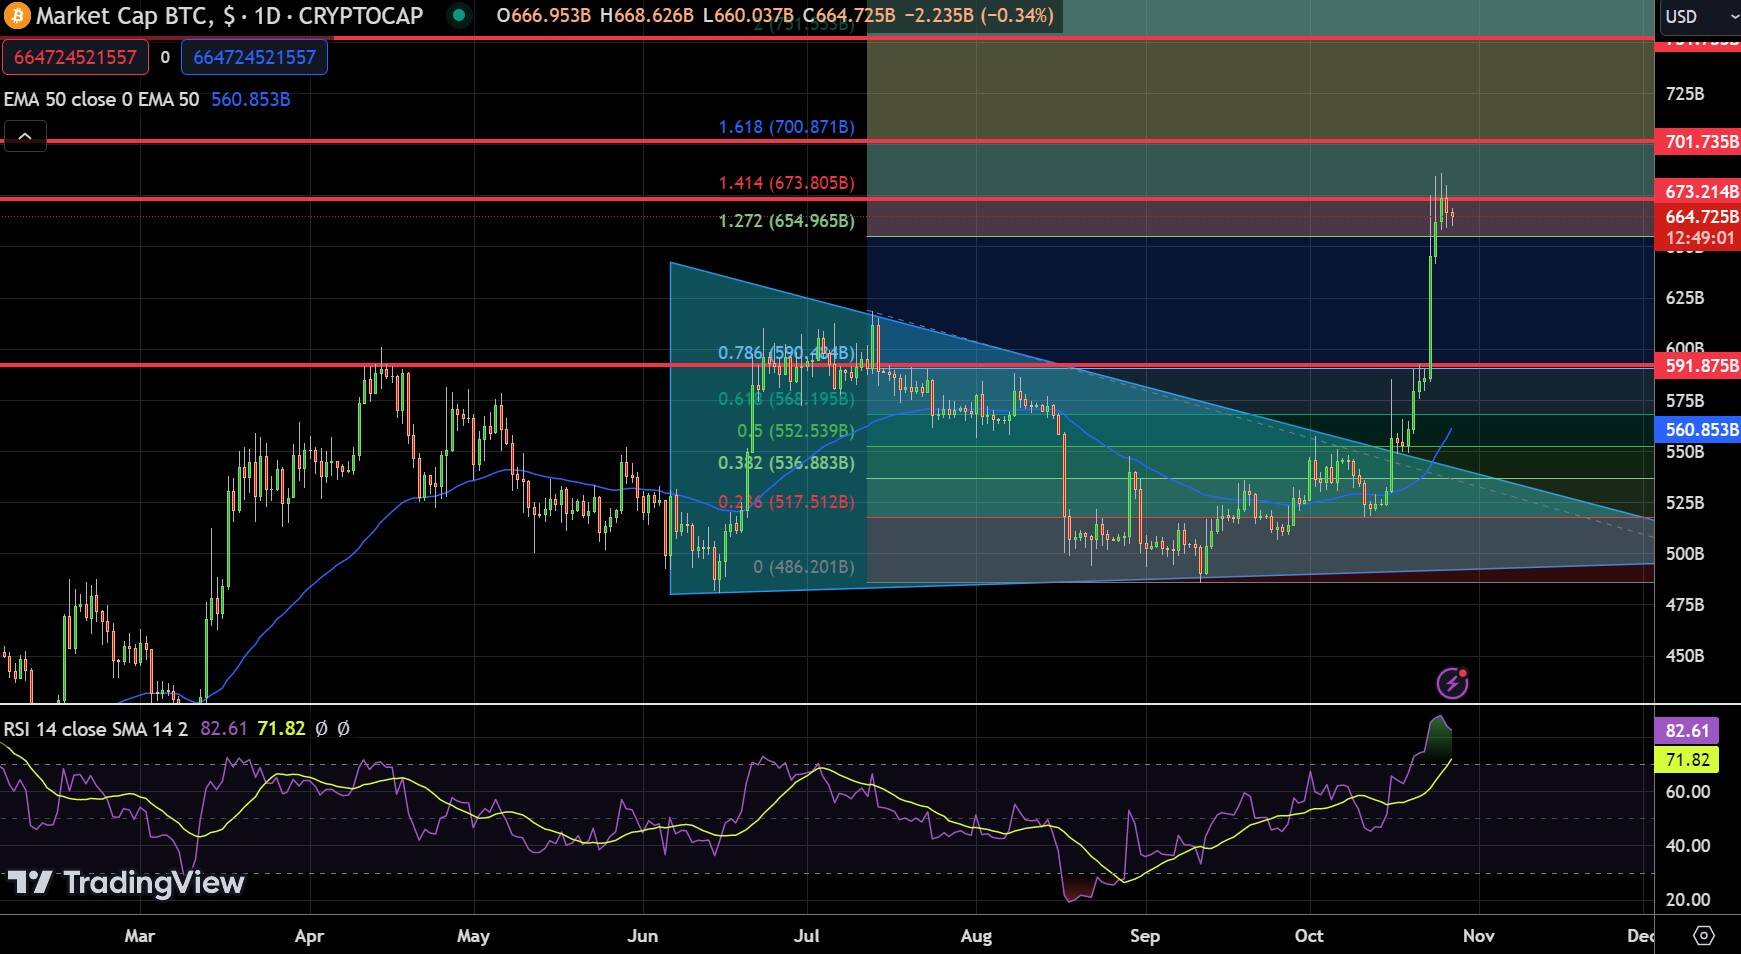
Bitcoin Market Cap Charts
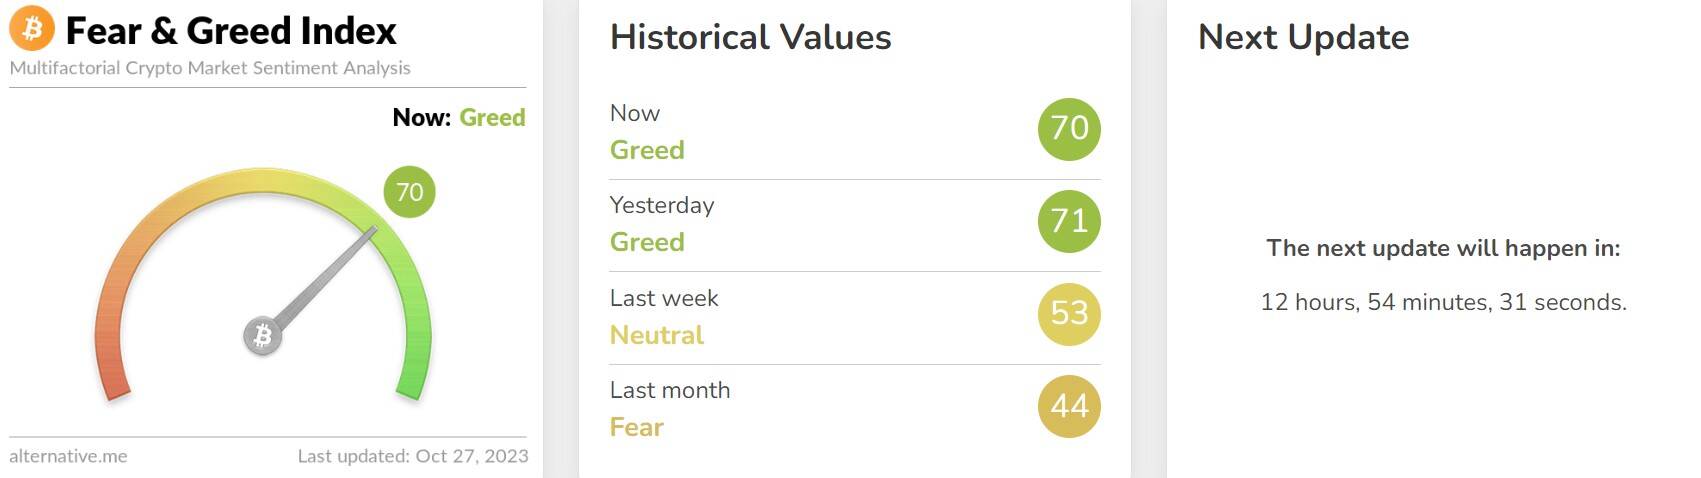
Crypto Fear & Greed Index – Source: alternative.me
Bitcoin Price Prediction
In today’s trading landscape, Bitcoin (BTC/USD) currently stands at $34,024.78, marking a 2.00% decrease over the past 24 hours. Despite this dip, it remains the leading asset on CoinMarketCap, with a robust market cap of $664.33 billion. The 4-hour chart reveals a pivotal point at $33,951, with immediate resistance anticipated at $35,225.
Should the bullish momentum continue, we could see further resistance at $36,101 and subsequently at $36,977. On the downside, support levels are earmarked at $33,144, followed by $32,442 and $31,826.
Technical indicators offer further insights. The Relative Strength Index (RSI) currently sits at 50, signalling a neutral sentiment. Meanwhile, the price slightly hovers above the 50-day Exponential Moving Average (EMA50) of $33,430, hinting at a possible short-term bullish trend.
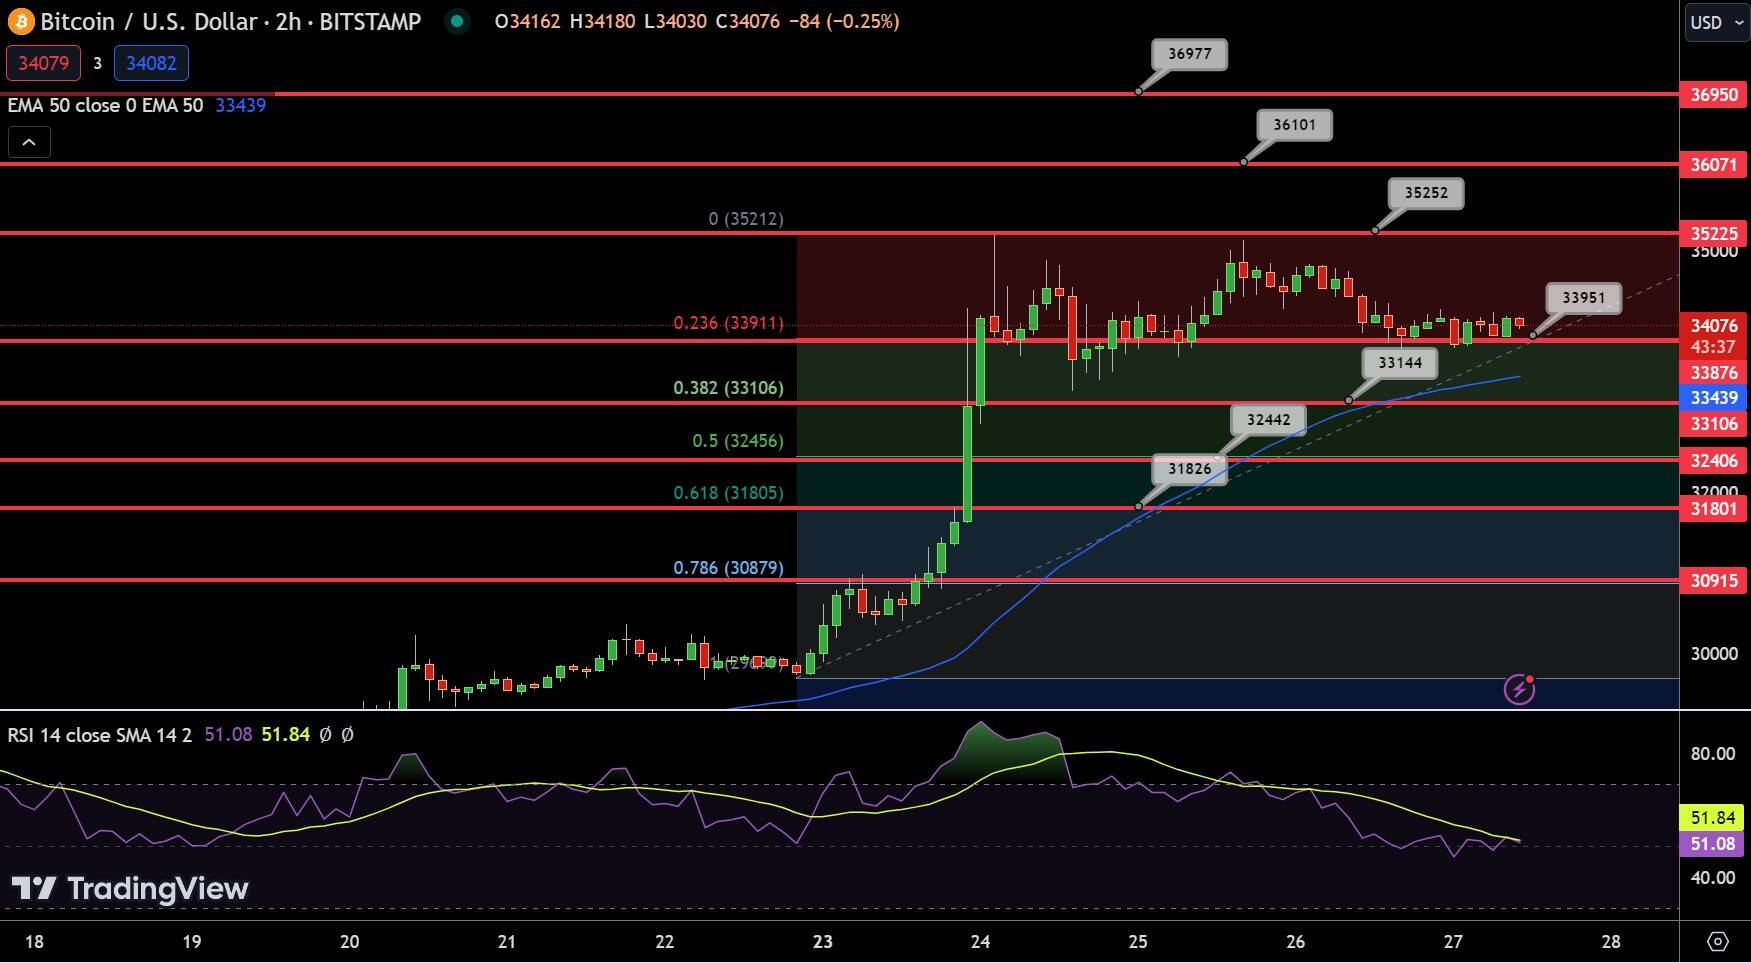
Chart patterns, especially the series of Doji candles above the 23.6% Fibonacci retracement level, suggest indecision among traders. A deeper look suggests immediate support around the 38.2% Fibo mark of $33,100.In conclusion, the current trend for Bitcoin remains bullish as long as it trades above $33,850. Traders should remain vigilant for potential shifts in market dynamics.
 Chat now!
Add a Comment