

Gold Prices Forecast
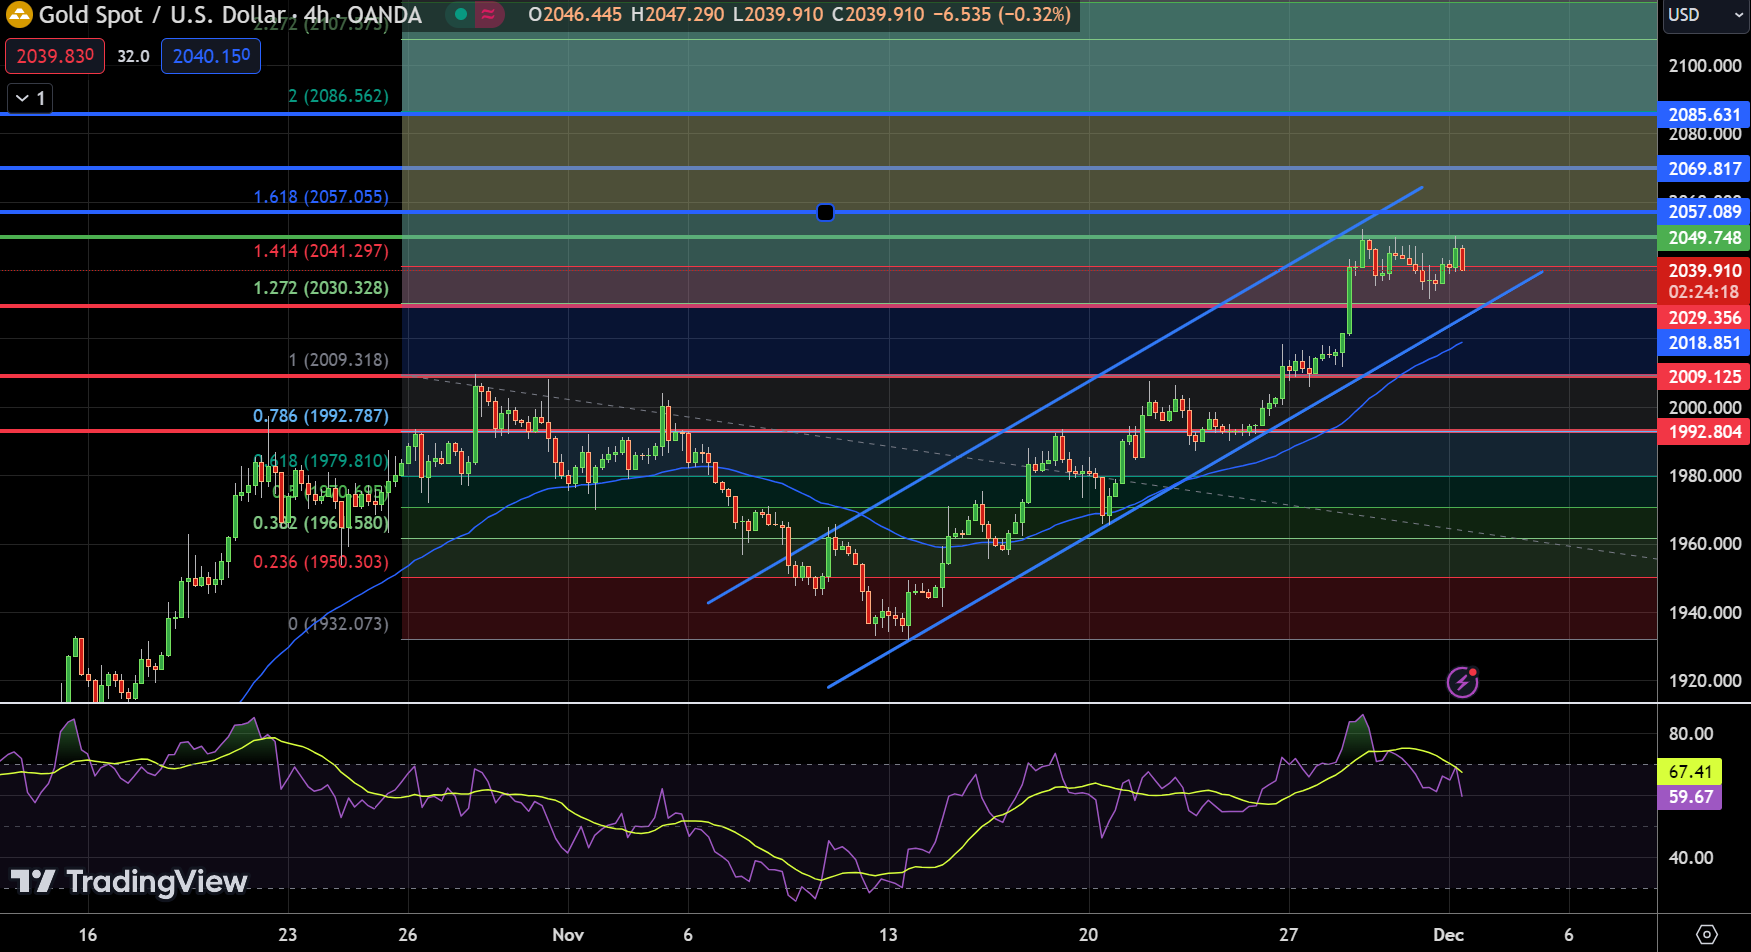
On the downside, support is seen at $2029 and $2009. The Relative Strength Index (RSI) at 59 indicates a bullish sentiment, while the MACD at -2 with a signal line at 7.57 suggests a potential for upward momentum.
The price is currently above the 50-Day Exponential Moving Average (EMA) of $2018, reinforcing the bullish trend. The upward channel pattern observed, supported by the 50 EMA, implies a continuing uptrend.
Given these indicators, the overall trend for Gold remains bullish above the $2020 mark, with expectations of testing higher resistance levels in the short term.
Silver Prices Forecast
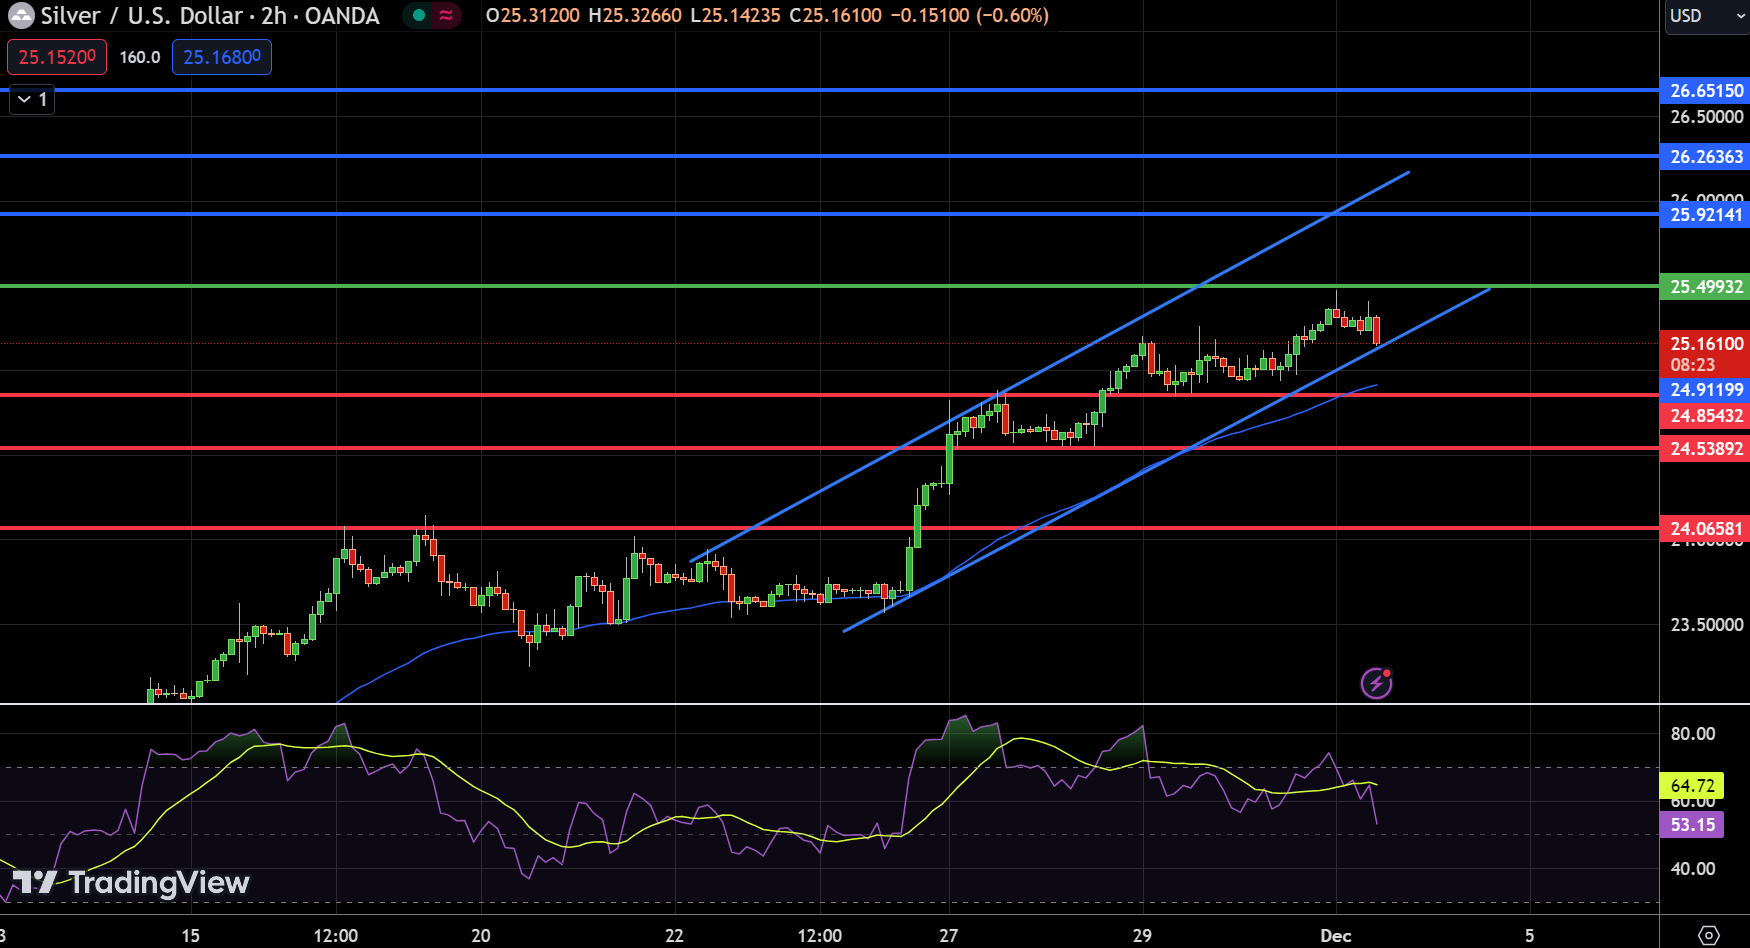
It hovers below its pivot point of $25.49, with immediate resistance levels set at $25.92, $26.26, and $26.65. Support levels are found at $24.85 and $24.53. The Relative Strength Index (RSI) stands at 53, indicating a slightly bullish sentiment.
Silver is trading above its 50-Day Exponential Moving Average (EMA) of $24.91, indicating a short-term bullish trend. The observed upward channel pattern provides crucial support near $25.15, suggesting resilience in the metal’s price.
Given these factors, the overall trend for Silver appears cautiously bullish above the $25 mark, with a short-term expectation of challenging the immediate resistance levels.
Copper Prices Forecast
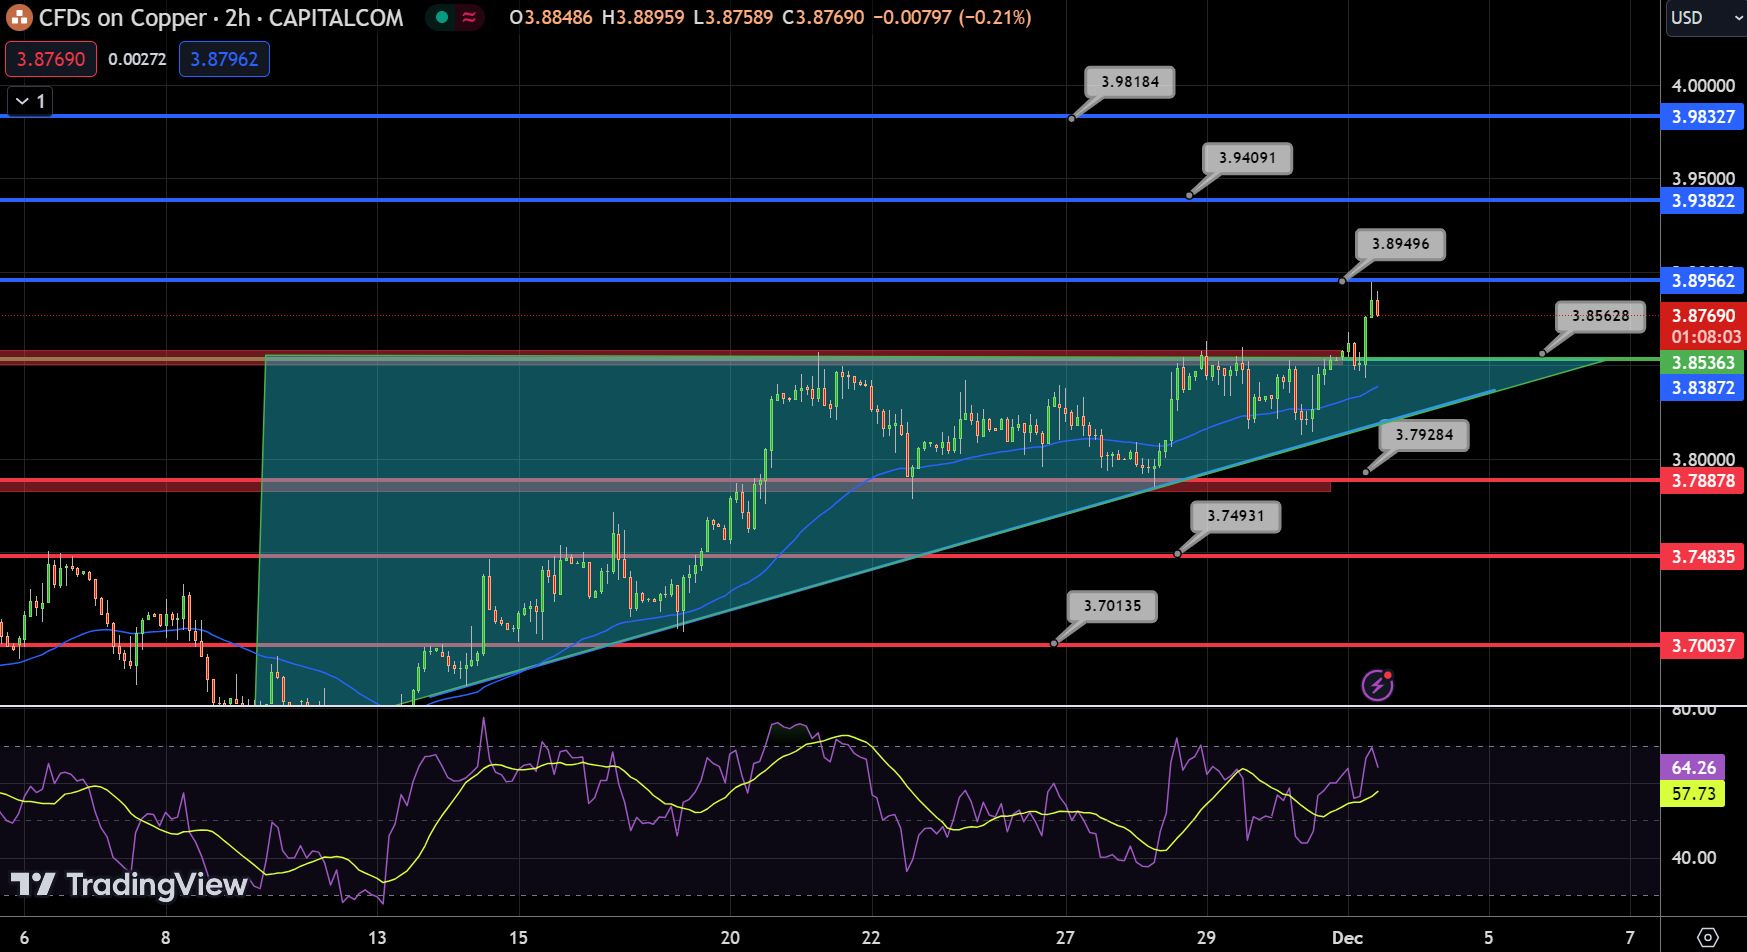
The Relative Strength Index (RSI) stands at 64, indicating a strong bullish sentiment without reaching overbought conditions. Copper’s price is comfortably above its 50-Day Exponential Moving Average (EMA) of $3.83, reinforcing the short-term bullish trend.
The chart showcases an ascending triangle breakout accompanied by a bullish engulfing candlestick pattern over $3.85, signaling a solid buying trend. Given these technical indicators, the overall trend for Copper appears bullish above the $3.85 threshold, with expectations of testing higher resistance levels in the near term.
 Chat now!
Add a Comment