

Wednesday Overview of the AUD/USD
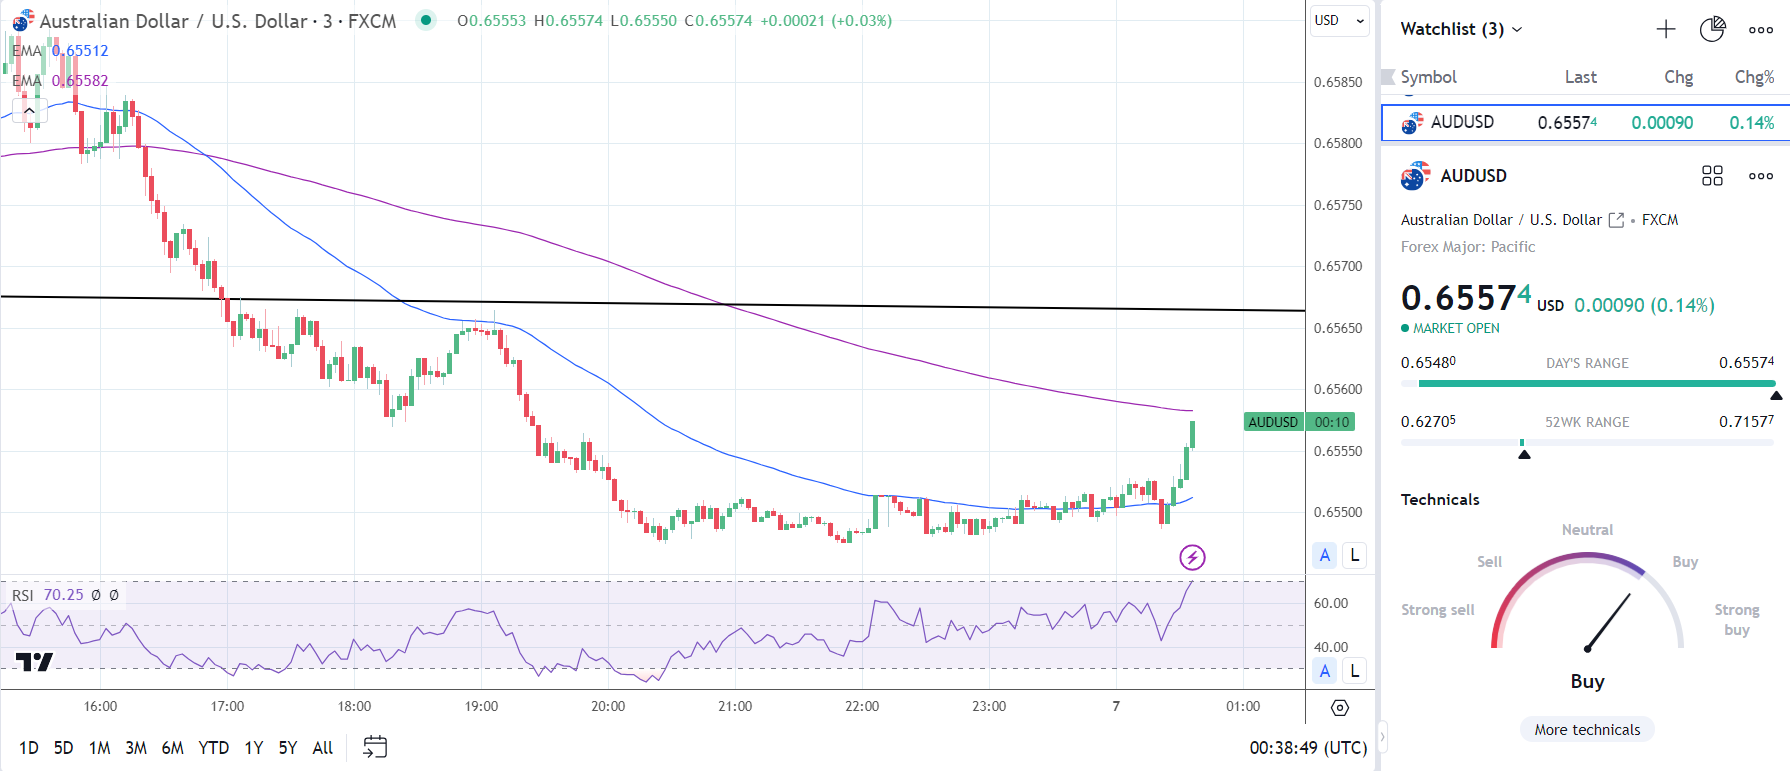
The AUD/USD declined by 0.05% on Wednesday. Following a 1.02% slide on Tuesday, the Aussie dollar ended the Tuesday session at $0.65484. The Australian dollar rose to a high of $0.65973 before falling to a low of $0.65462.
Australian Trade Surplus Widened in October
On Thursday, Australian trade data drew investor interest early in the session. The trade surplus widened from A$6.786 billion to A$7.129 billion in October. Economists forecast a trade surplus of A$7.500 billion. Significantly, exports increased by 0.4%, while imports declined by 1.9%.
Trading Derivatives carries a high level of risk to your capital and you should only trade with money you can afford to lose. Trading Derivatives may not be suitable for all investors, so please ensure that you fully understand the risks involved, and seek independent advice if necessary. A Product Disclosure Statement (PDS) can be obtained either from this website or on request from our offices and should be considered before entering into a transaction with us. Raw Spread accounts offer spreads from 0.0 pips with a commission charge of USD $3.50 per 100k traded. Standard account offer spreads from 1 pips with no additional commission charges. Spreads on CFD indices start at 0.4 points. The information on this site is not directed at residents in any country or jurisdiction where such distribution or use would be contrary to local law or regulation.
According to the ABS,
- General merchandise exports increased by 0.1% while merchanting goods exports jumped by 22.5%.
- Exports of non-monetary gold rose by 5.3%.
- Imports of general merchandise declined by 2.6%.
- However, non-monetary gold imports surged by 26.4%.
The Aussie dollar responded positively to the stats. After an initial dip to $0.65519, the AUD/USD rose to a post-stat high of $0.65574. However, the trade data is unlikely to ease bets on a December 2024 RBA rate cut.
China Trade Data in the Spotlight
On Thursday, trade data from China will garner investor interest. Better-than-expected trade terms would fuel buyer appetite for the Aussie dollar.
China accounts for one-third of Australian exports. Australia has a trade-to-pivot ratio above 50%. Improving trade terms for China would drive demand Australian goods, supporting the Australian economy and the Aussie dollar.
Economists forecast exports to decline by 1.1% year-over-year in November versus -6.4% in October. However, economists expect imports to rise by 3.3% vs. 3.0% in October. A less marked decline in exports and uptick in imports could signal an improving demand environment.
US Labor Market in the Spotlight
Later in the Thursday session, US labor market numbers also need consideration. US weekly jobless claims could influence bets on a Q1 2024 Fed rate cut.
Softer labor market conditions could impact wage growth and reduce disposable income. A downward trend in disposable income would affect consumer spending and dampen demand-driven inflation. A softer inflation outlook would allow the Fed to take a less hawkish Fed rate path.
Economists forecast initial jobless claims to increase from 218k to 222k in the week ending December 2.
Short-Term Forecast
In the near term, AUD/USD trends will hinge on the trade data from China and the US Jobs Report. A pickup in demand for Chinese goods and softer US wage growth would support an AUD/USD move toward $0.67.
AUD/USD Price Action
Daily Chart
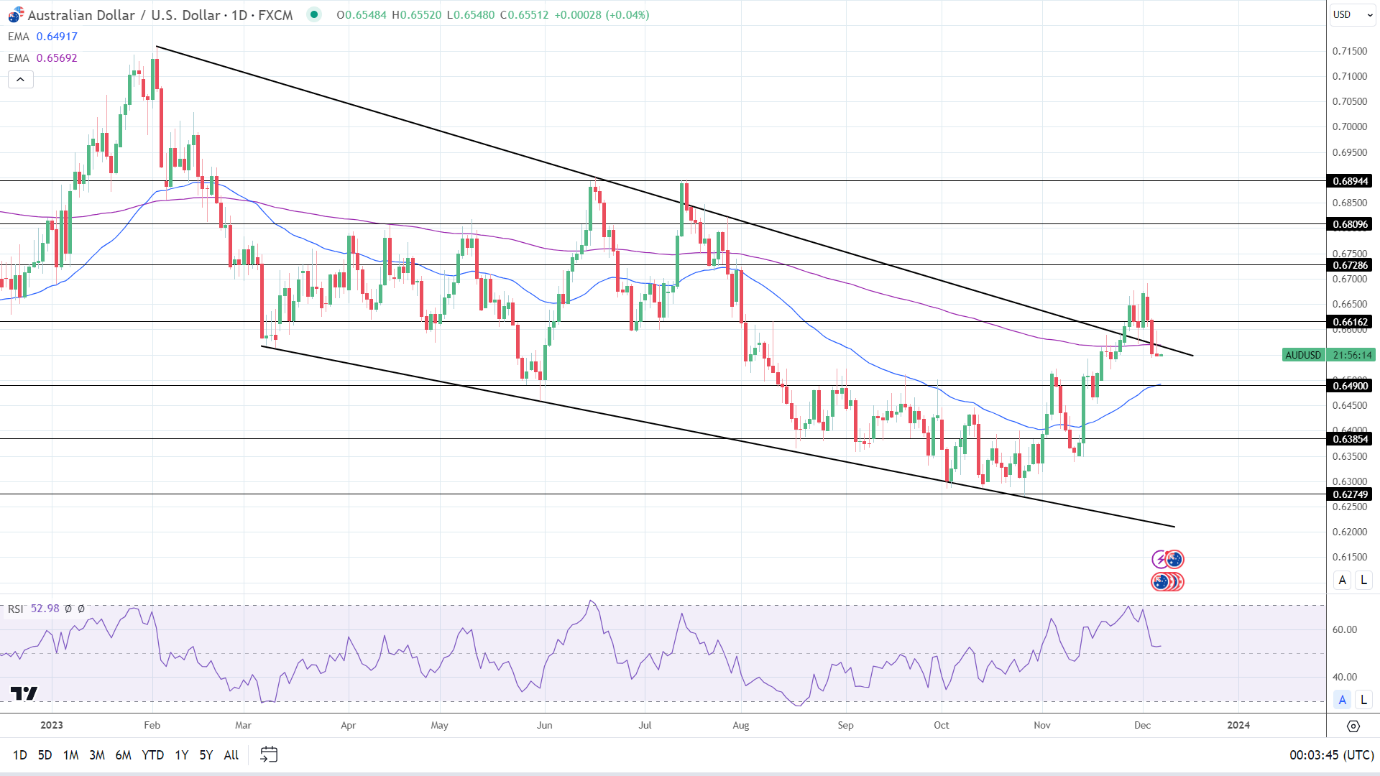
The AUD/USD remained below the 200-day EMA while sitting above the 50-day EMA, affirming bullish near-term but bearish longer-term price signals.
An AUD/USD move through the trend line and 200-day EMA would give the bulls a run at the $0.66162 resistance level. Selling pressure could intensify at $0.65700. The 200-day EMA is confluent with the trend line.
China trade data and the US labor market are focal points on Thursday.
However, a fall through the $0.65500 handle would support a move to the $0.64900 support level.
A 14-period Daily RSI reading of 52.98 indicates an AUD/USD return to the $0.66 handle before entering overbought territory (typically above 70 on the RSI scale).
4-Hourly Chart
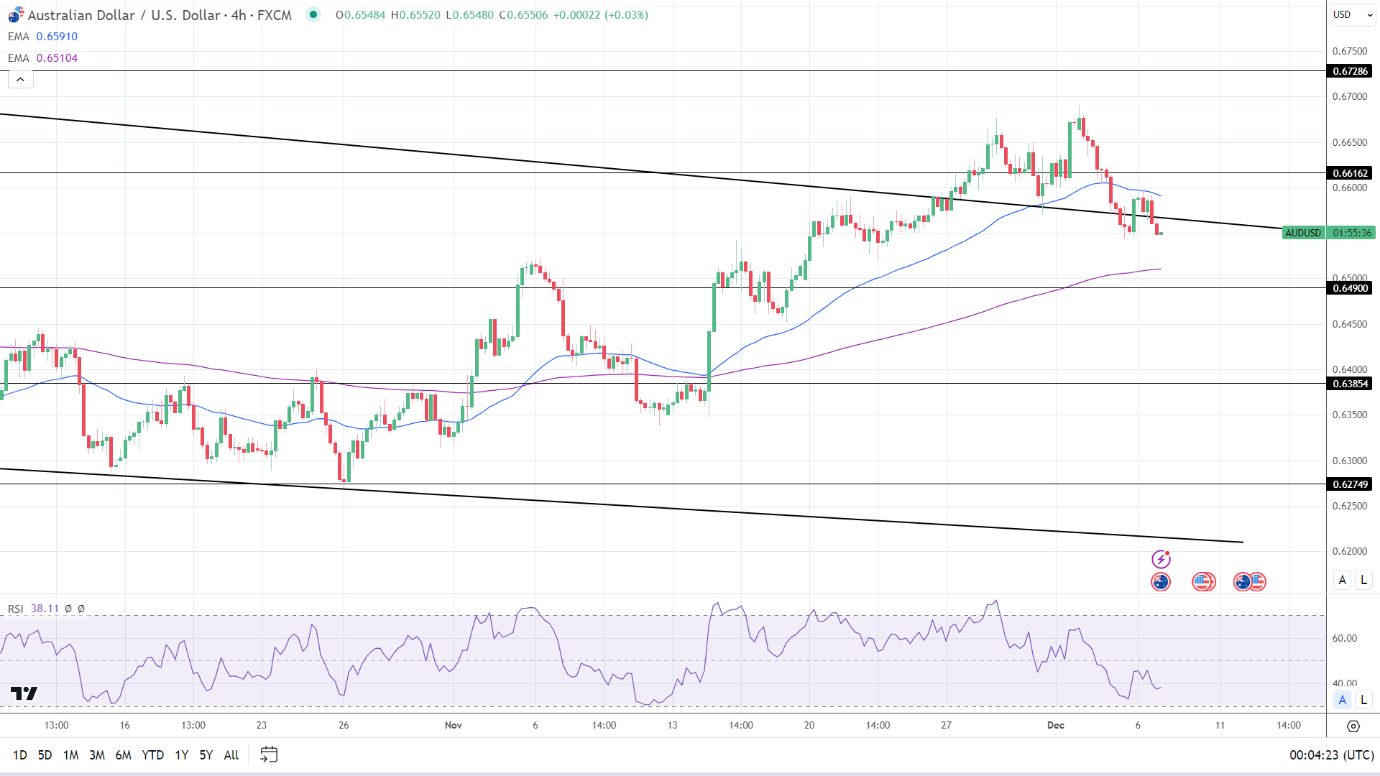
The AUD/USD remained below the 50-day while holding above the 200-day EMA, affirming bearish near-term but bullish longer-term price signals.
An AUD/USD move through the trend line would bring the 50-day EMA and the $0.66162 resistance level into play.
However, a fall through the $0.65500 handle would give the bears a run at the 200-day EMA and the $0.64900 support level.
The 14-period 4-Hourly RSI at 38.11 indicates an AUD/USD drop to the 200-day EMA before entering oversold territory.
 Chat now!
Add a Comment