

US Dollar Rises Amid Strong GDP, Eurozone and UK Consumer Sentiments Diverge
The US Dollar Index exhibited bullish behavior on January 26, climbing 0.18% to 103.321, buoyed by U.S. economic data. The Advance GDP growth at 3.3% surpassed the 2.0% forecast, underscoring a strong U.S. economy. Meanwhile, Unemployment Claims were slightly above expectations at 214K but still indicate a stable job market.
In contrast, the Eurozone’s outlook appears less optimistic. The German GfK Consumer Climate plummeted to -29.7, suggesting growing consumer pessimism and potentially impacting the EUR/USD pair negatively. Conversely, the UK’s GfK Consumer Confidence index showed less pessimism at -19, potentially lending some support to the GBP/USD pair.
Events Ahead
Looking forward, key U.S. indicators such as the Core PCE Price Index and Pending Home Sales could further drive the dollar’s momentum. In Europe, upcoming reports like the Spanish Unemployment Rate and insights from the German Buba Monthly Report are expected to influence the EUR/USD, especially if they diverge from the ECB’s outlook.
US Dollar Index (DXY)
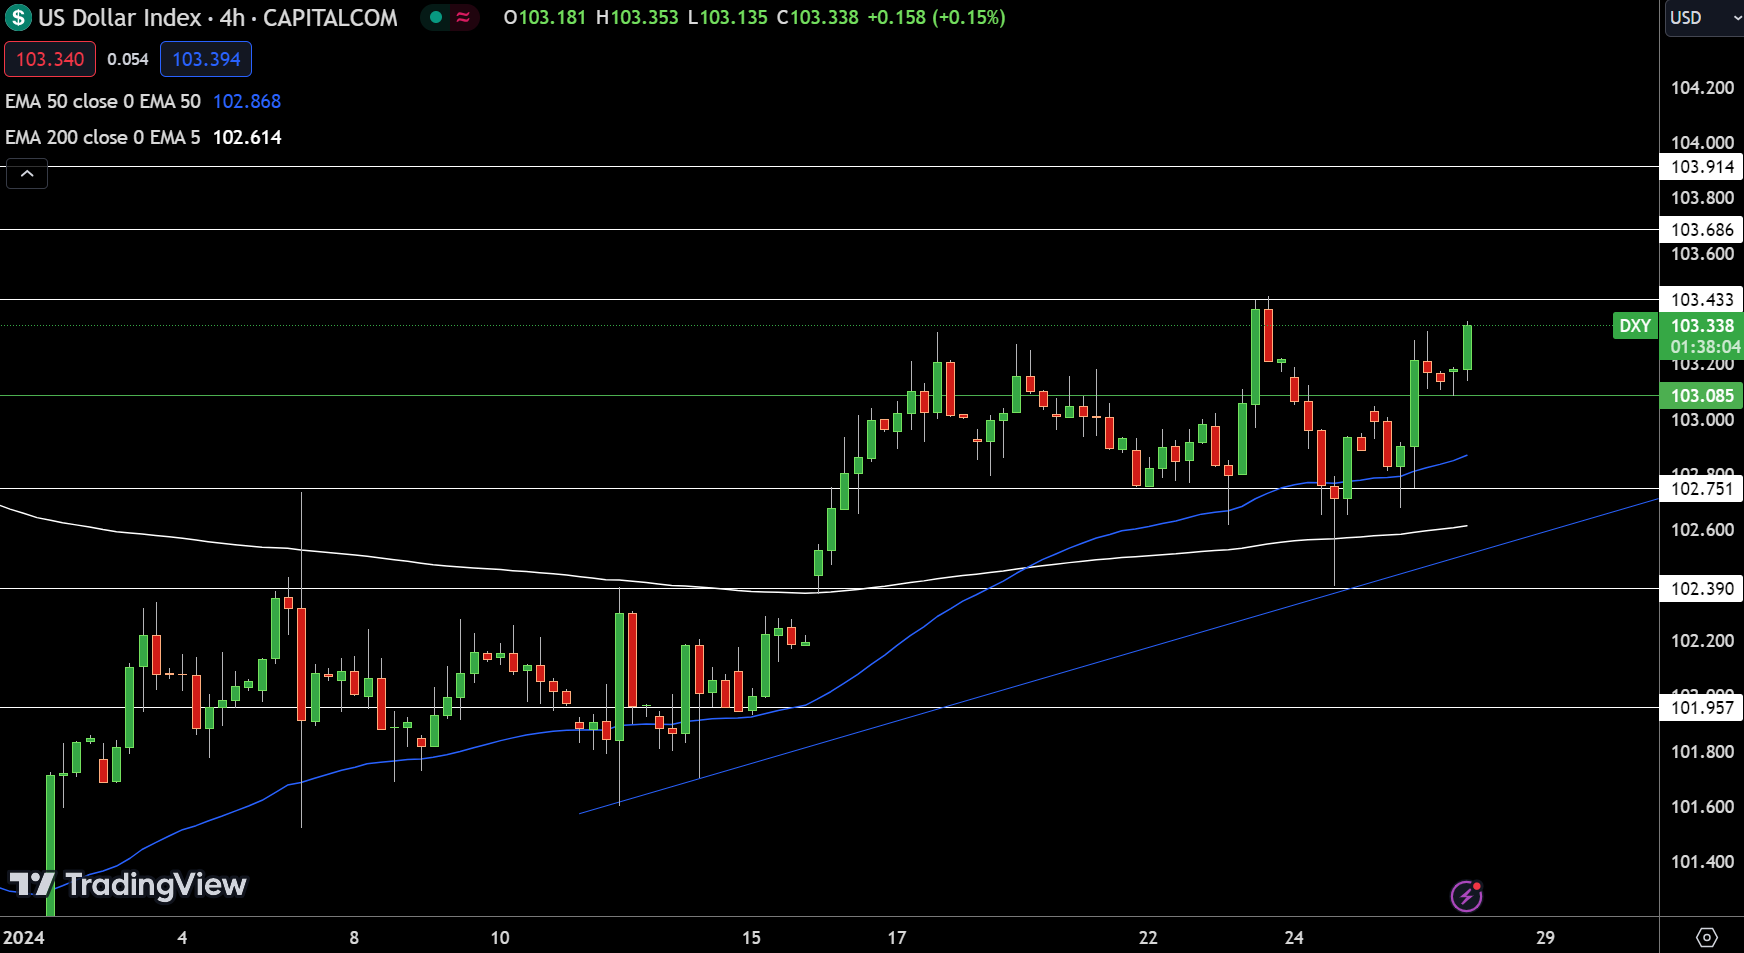
On the downside, support levels are positioned at $102.751, $102.390, and $101.957. The 50-day and 200-day Exponential Moving Averages, at $102.868 and $102.614 respectively, reinforce this bullish sentiment.
EUR/USD Technical Forecast
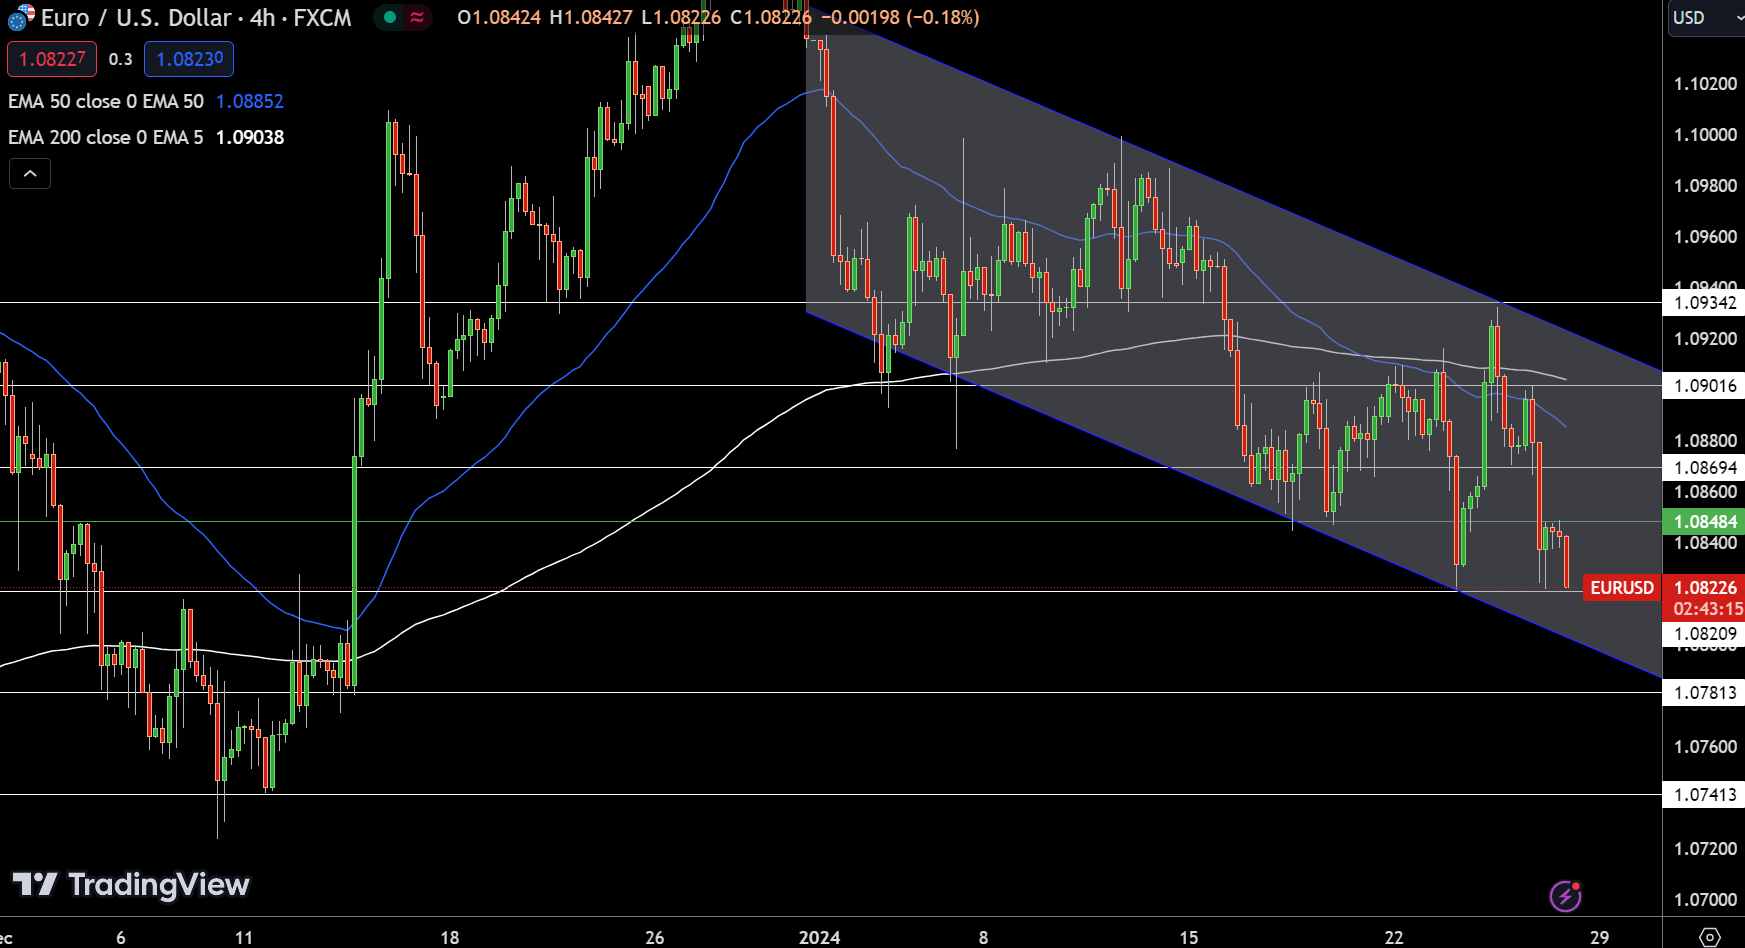
Surpassing these levels is crucial for reversing the current downward trend. Support lies at $1.08209, with subsequent levels at $1.07813 and $1.07413, potentially stabilizing further drops.
Technical analysis shows the 50-day and 200-day Exponential Moving Averages (EMAs) at $1.08852 and $1.09038, respectively, both reinforcing the downward trend.
A bearish engulfing candlestick pattern on the 4-hour chart, combined with a downward channel, further suggests a bearish outlook. Consequently, the current trajectory for EUR/USD remains bearish, particularly below the pivotal $1.08484 mark.
GBP/USD Technical Forecast
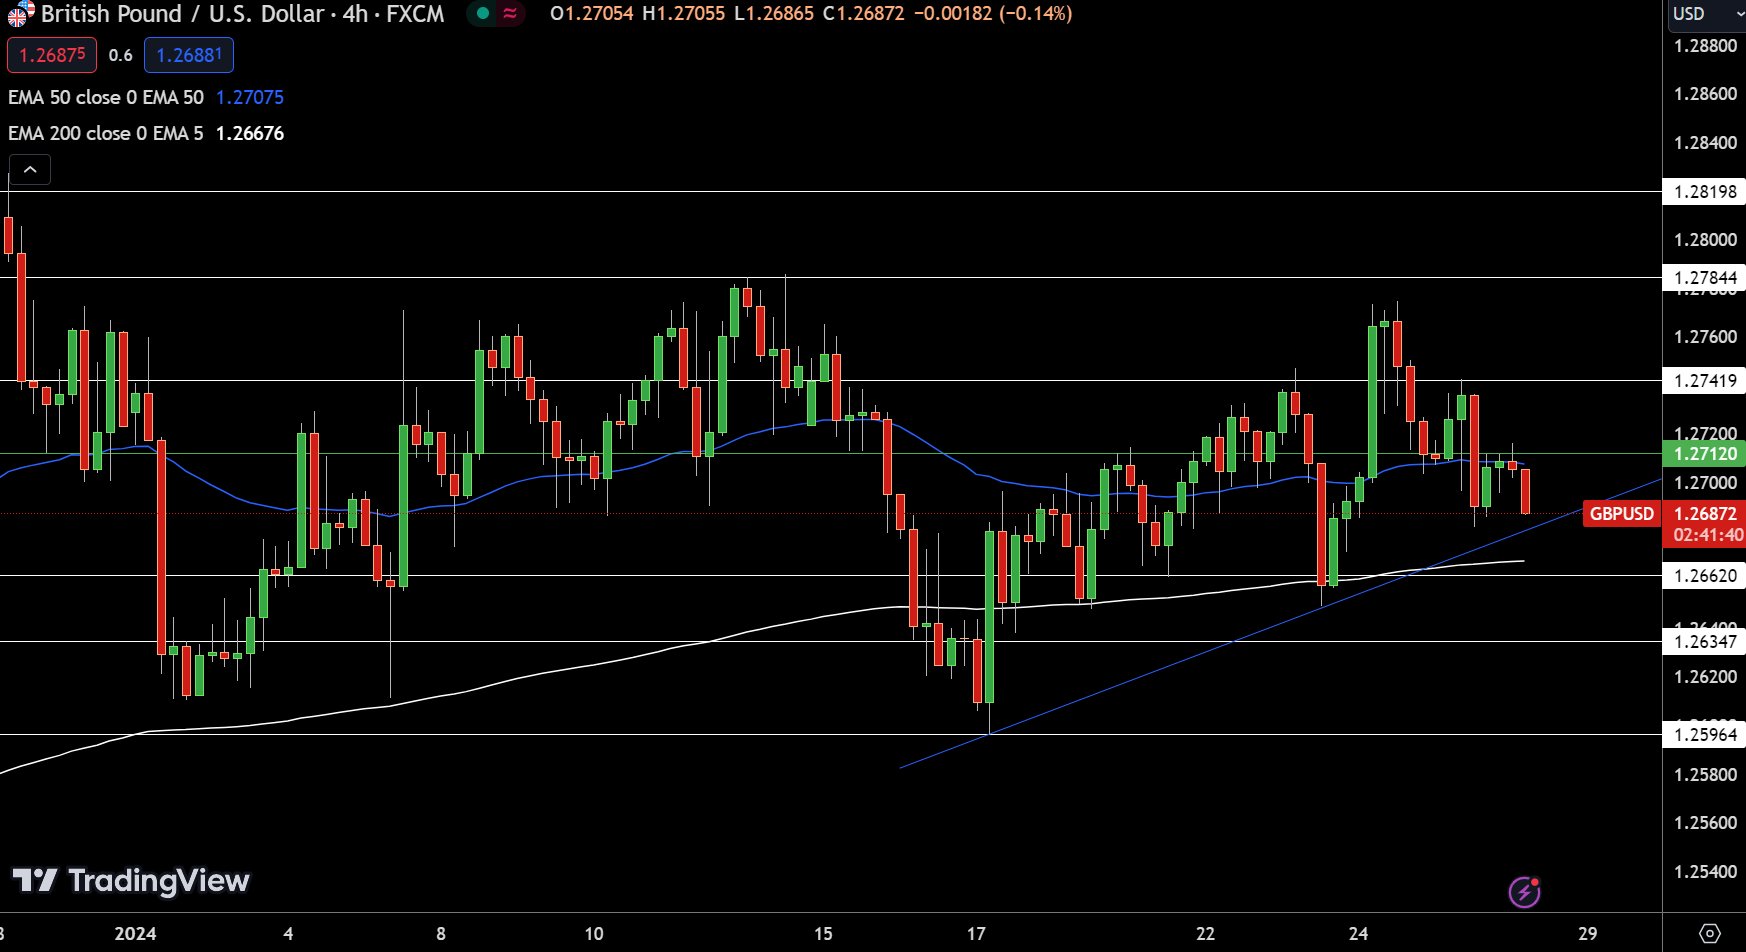
Resistance levels are set at $1.27419, $1.27844, and $1.28198, each serving as potential barriers to upward movements. Support levels are established at $1.26620, followed by $1.26347 and $1.25964, which are critical for preventing further declines.
Technical indicators show the 50-day Exponential Moving Average (EMA) at $1.27075, just above the current rate, and the 200-day EMA at $1.26676, both validating the downward trend.
The chart pattern, including a tweezers top formation near the 50 EMA line and an evening star candlestick, further signals potential bearishness. Notably, the GBP/USD pair’s future could hinge on the support around $1.2675; a fall below this mark might intensify selling.
Overall, the pair displays a bearish tendency below the $1.27120 pivot, calling for caution in trading strategies.
 Chat now!
Add a Comment