Gold, Silver, Copper Daily Forecast: Eye CPI Data, Sell XAU Under $2,185

Gold, Silver, Copper Daily Forecast: Eye CPI Data, Sell XAU Under $2,185

Gold, Silver, and Copper Await U.S. Inflation Data

Gold prices hovered near record highs, anticipating U.S. inflation data that may influence Federal Reserve rate decisions. Last week, expectations of rate cuts, fueled by Fed Chair Jerome Powell’s comments on nearing comfortable inflation levels and lukewarm U.S. labor data, propelled gold to new heights.

The dollar’s weakness and falling Treasury yields also supported bullion prices. Attention now shifts to Tuesday’s U.S. consumer price index, expected to reveal a slight ease in inflation, yet above the Fed’s target.

Copper prices remained steady, reflecting mixed economic indicators from China, the top importer. Despite a rise in China’s copper imports in the early year, factory activity’s slowdown suggests tempered demand, as indicated by recent inflation data. The metals market is keenly awaiting further economic cues, especially U.S. inflation figures, for directional clarity.

Gold Prices Forecast
Gold - Chart
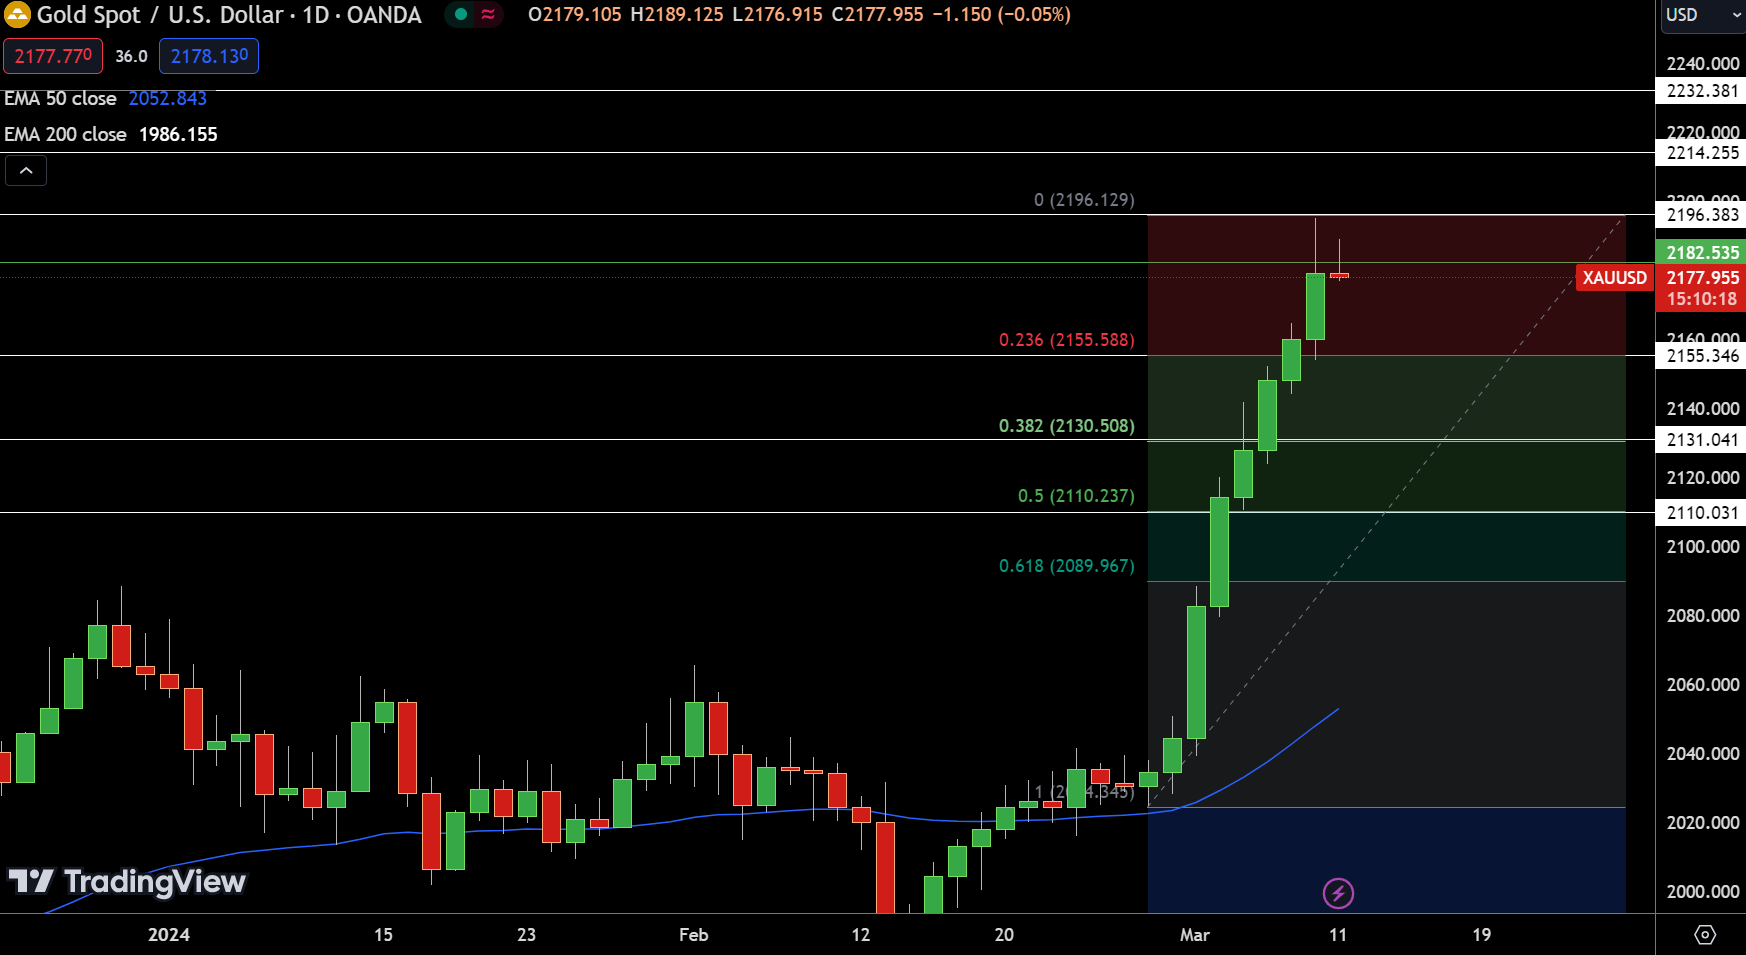
Gold – ChartGold‘s price today marks a slight decrease, trading at $2,177.39, down by 0.10%. Analyzing the 4-hour chart, the metal’s pivot point is at $2,182.54, indicating key price movements ahead.

Resistance levels are set at $2,196.38, $2,214.26, and $2,232.38, while support is found at $2,155.35, followed by $2,131.04 and $2,110.03. The 50-Day Exponential Moving Average (EMA) at $2,052.843 and the 200-Day EMA at $1,986.155 both suggest a longer-term uptrend, despite current pressures.

A Doji candle formation near the $2,185 level hints at potential selling pressure. The overall trend suggests bearish momentum below $2,185, with a break above this level potentially shifting the bias to bullish.

Silver Prices Forecast
Silver - Chart
Silver – Chart

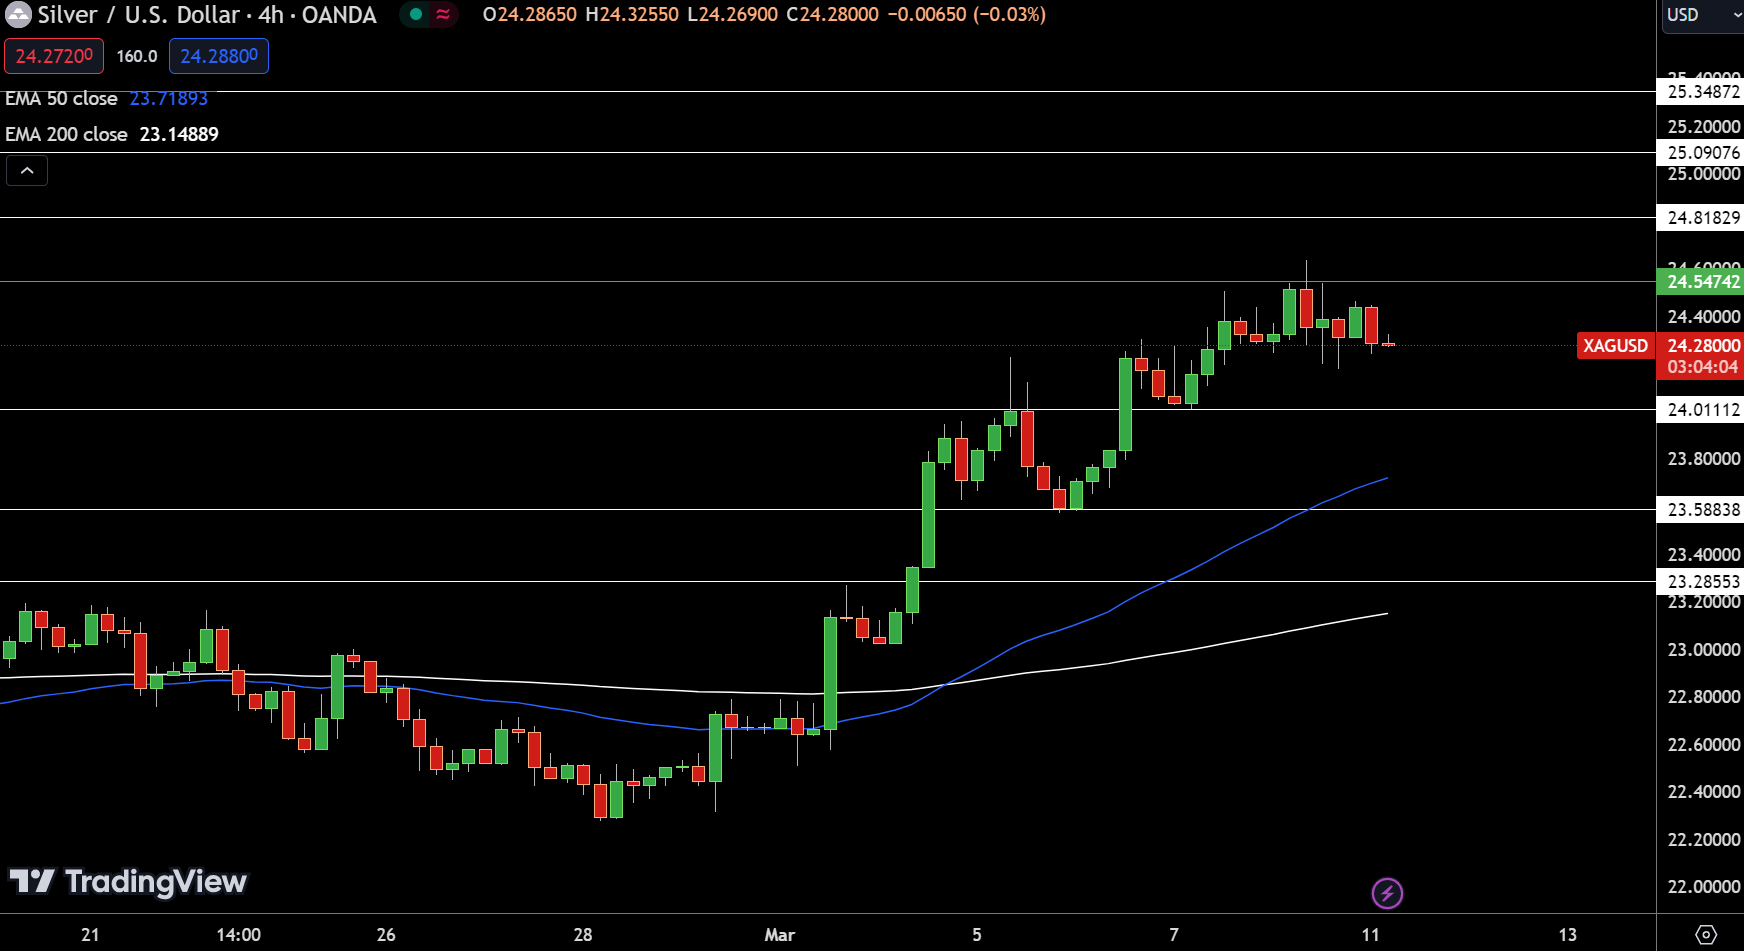
Silver‘s market price slightly declined to $24.28, marking a decrease of 0.11% as observed on the 4-hour chart. The metal’s pivot point at $24.55 serves as a key determinant for future movements, with resistance levels identified at $24.82, $25.09, and $25.35.

Support levels are positioned at $24.01, indicating the immediate floor, followed by stronger supports at $23.59 and $23.29. Technical indicators, including a 50-Day Exponential Moving Average (EMA) at $23.72 and a 200-Day EMA at $23.15, underscore a prevailing bullish trend over the longer term, despite short-term setbacks.

The trend for silver appears bearish beneath $24.55, yet a surge above this threshold could signal a shift towards a more bullish sentiment.

Copper Prices Forecast

Copper - Chart
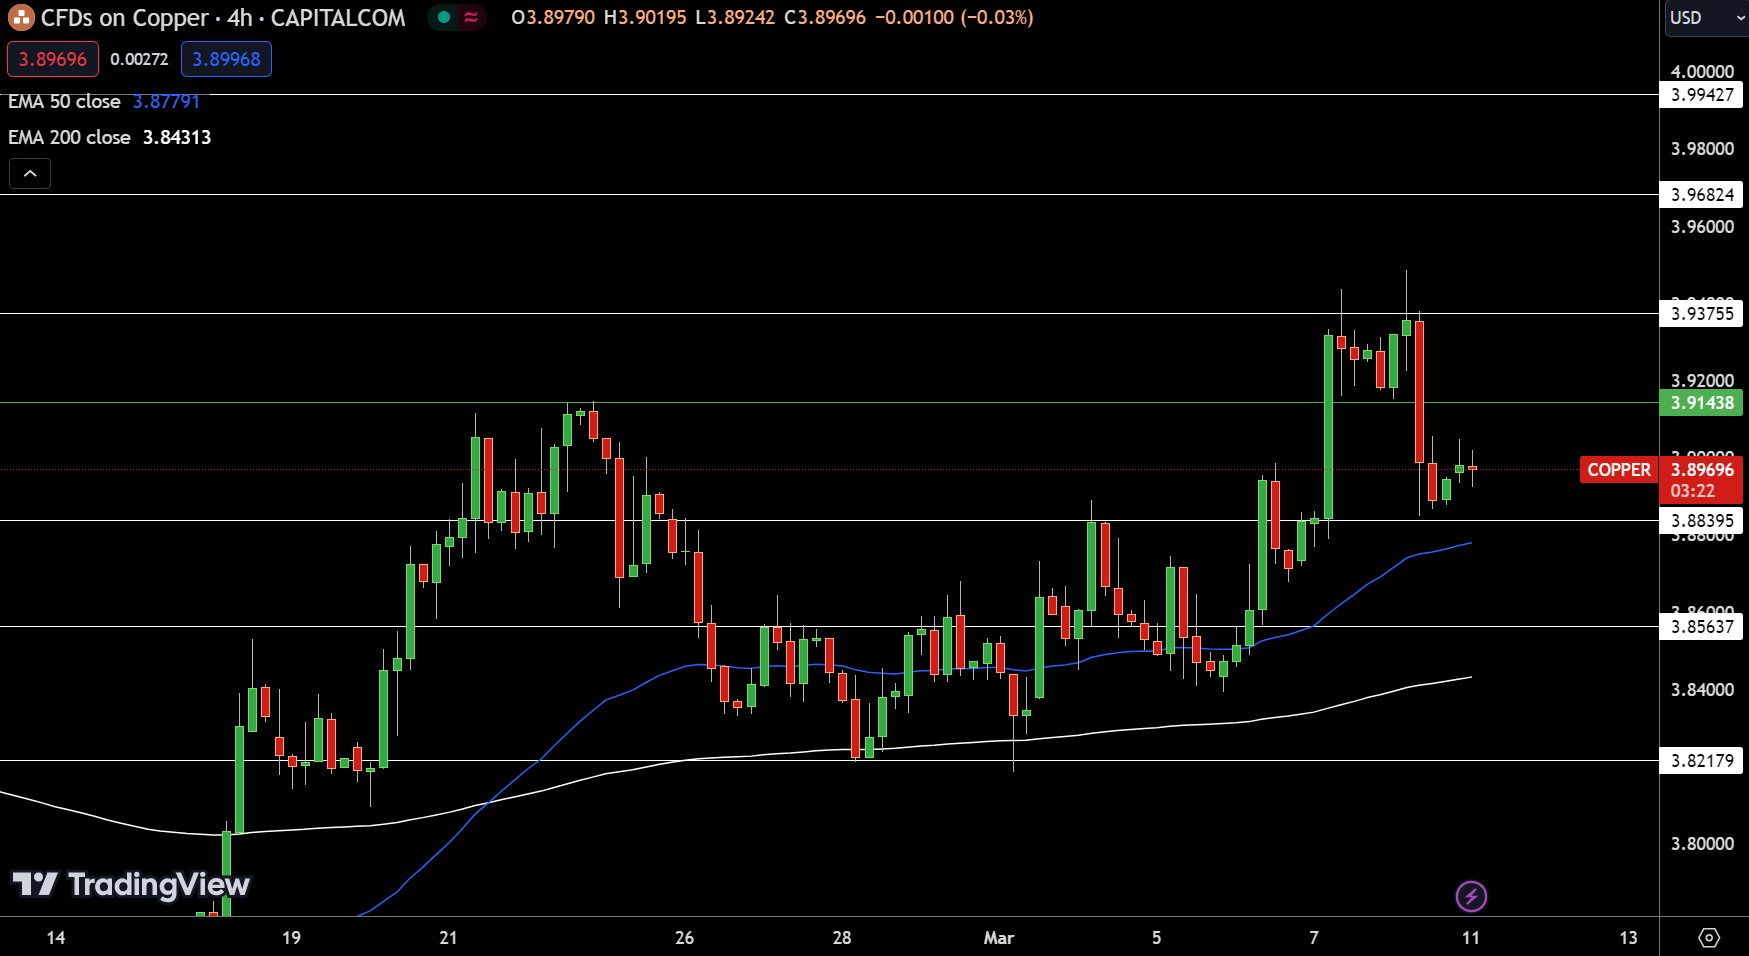
Copper – ChartCopper‘s current trading price of $3.89 reflects a modest increase of 0.05%, as seen in the 4-hour chart. The metal’s pivot point is at $3.91, with resistance levels anticipated at $3.94, $3.97, and $3.99.

Conversely, immediate support is found at $3.88, with subsequent levels at $3.86 and $3.82, suggesting potential areas for price stabilization. The 50-Day Exponential Moving Average (EMA) stands at $3.88, closely aligned with the 200-Day EMA at $3.84, indicating a slightly bullish trend over the longer term.

The overall outlook for copper is bullish above $3.88, yet a descent below this critical juncture could trigger a significant selling pressure.

Tags: No tags

Add a Comment

Your email address will not be published. Required fields are marked *