

GOLD PRICE TECHNICAL ANALYSIS
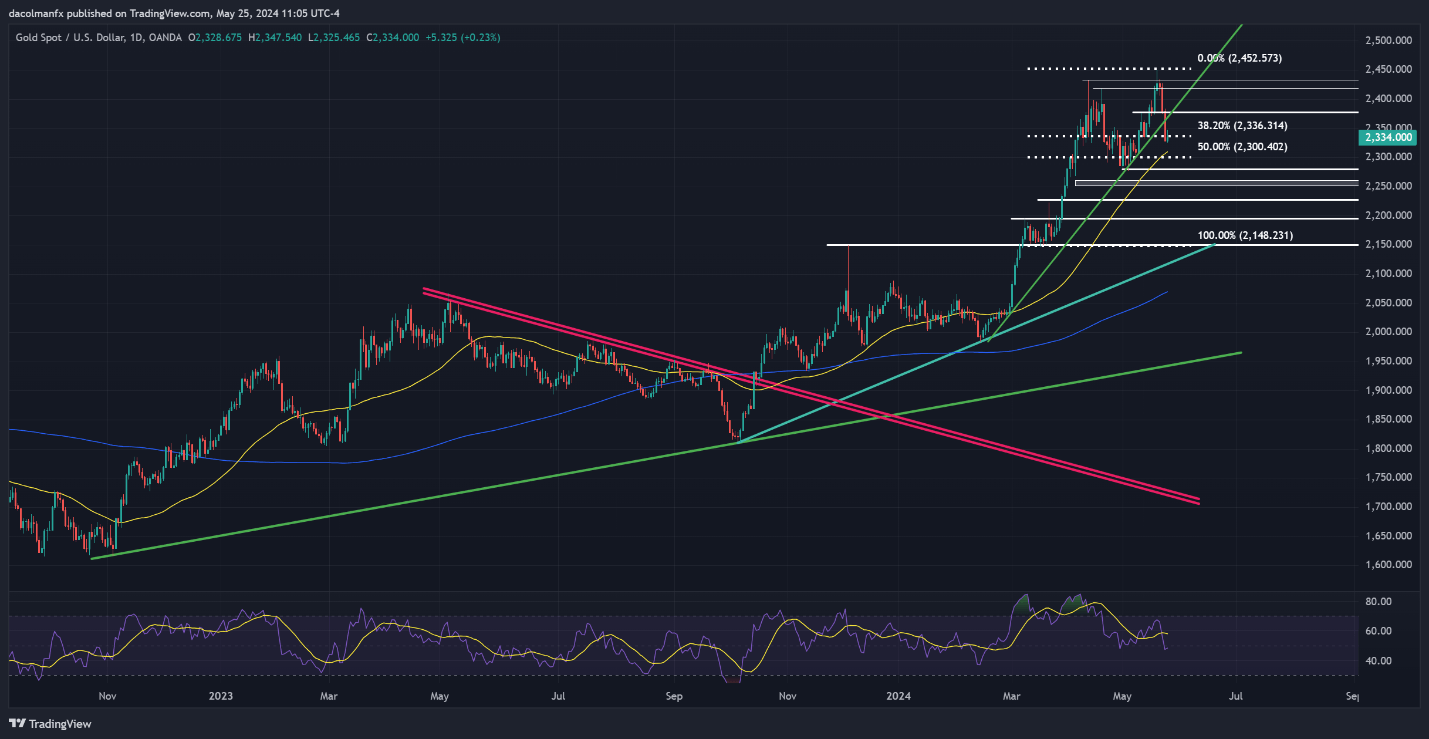
Gold (XAU/USD) plummeted this week, slipping below a key trendline at $2,360 and the 38.2% Fibonacci retracement of the 2024 advance at $2,335. With bearish momentum seemingly accelerating, sellers could soon make a move on the 50-day SMA at $2,310. On further weakness, the focus will be on the psychological $2,300 threshold, followed by $2,280, May’s swing low.
In case of a market rebound, resistance could manifest near the $2,375 zone. Surmounting this technical ceiling could prove challenging, yet a breakout could encourage buyers to launch an assault on $2,420. Additional gains beyond this point could set the stage for a rally towards $2,430, with the all-time high at $2,450 representing the next noteworthy bullish target to keep an eye on.
GOLD PRICE TECHNICAL CHART
 Chat now!
Add a Comment