
The Japanese candlestick chart is popular among many traders in the market. This type of chart provides information about prices and gives trading signals, allowing traders to predict the future price movement of an asset.
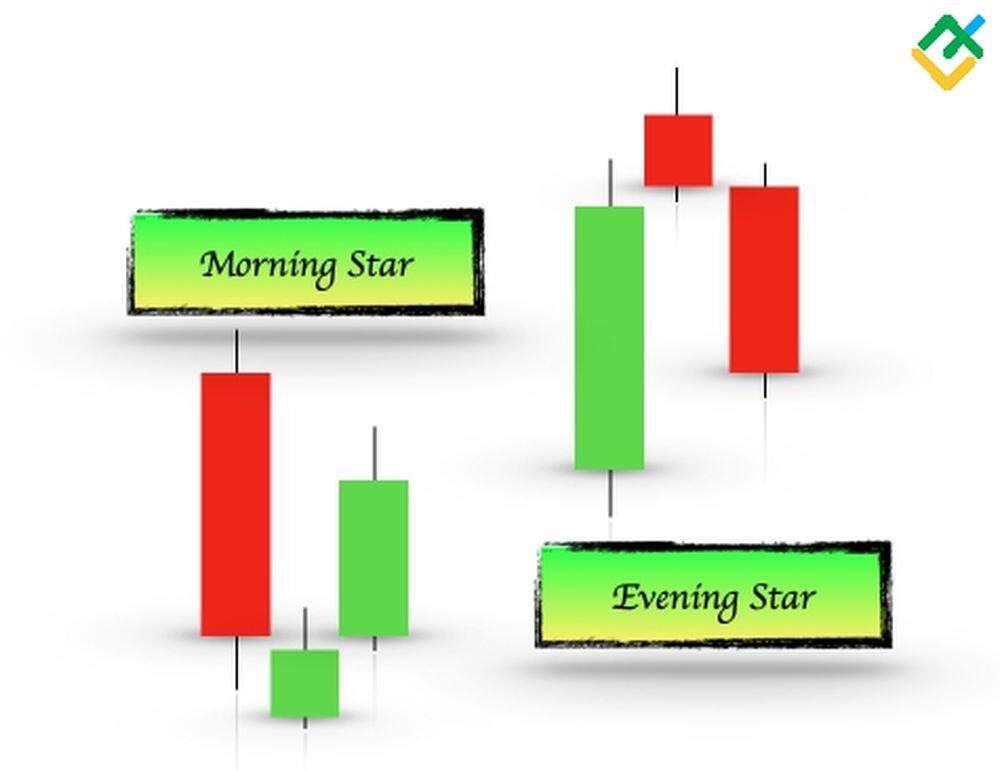
Candlestick analysis includes various patterns, which can consist of one, two, three, or more candlesticks, such as the Morning star. This pattern combines three candlesticks: a large bearish candlestick, a smaller candlestick in the middle, and a large bullish candlestick.
The appearance of this bullish reversal pattern on the chart signals an upcoming upward price reversal and warns market participants that the bearish trend has ended.
You have probably encountered this pattern many times while analyzing asset charts. But what does it signal?
You will find out the answer to this and many other questions in this article.
Key Takeaways
What Is a Morning Star
The Morning star is a candlestick with a small body that forms at the bottom of the downtrend and signals an upward trend reversal. The pattern consists of three candlesticks: two large ones with different directions and a smaller candlestick between them.
The Morning star can also occur without a body. This pattern is called the Morning star doji. It provides a stronger signal for a trend reversal.
The key feature of the Morning star is that the candlestick’s body can be either bearish or bullish. In the classic example, when the pattern is formed, there should be gaps between the short and tall candlesticks.

Morning Star Pattern Formation
Let’s consider each stage in detail:
- The first tall red candlestick indicates the sustained sellers’ prevalence in the market.
- Next, a short candlestick with a small body forms, which alerts market participants. The construction of this candlestick signals diminishing bearish pressure, as buyers and sellers start to balance out over the session.
- Then a large green candlestick begins to form, which finally confirms the bullish influence on the price. That is, quotes reach a critical level during the formation of a candle with a short body. Sellers are unlikely to push the asset’s price below this level.

The above chart shows the Morning star pattern, after which bulls attempted to reverse the trend. However, the price returned to the support level. Then Inverted hammer and Hammer patterns appeared on the daily chart of #DIS shares. Market participants received the final bullish signal for the upward price reversal and the uptrend’s beginning.
How to Identify a Morning Star
Each candlestick pattern has its distinctive features. Before identifying the Morning star pattern and opening a trade, make sure that the pattern is properly built.
- The Morning Star pattern is formed after the downtrend end or during a long consolidation, precisely when the trading instrument hits the downtrend’s bottom.
- The first Japanese candlestick should be bearish.
- As a rule, a small gap between the first and the second candlestick, which characterizes the Morning star, should appear.
- The second candlestick should have a short body of any color or be in the form of a doji, which has no body at all. This candlestick is the star. It shows that the strength of bears is fading.
- After the middle candlestick has formed, a gap may appear. The second gap strengthens the level at which the Morning star is formed.
- The third candlestick should be bullish and overlap the first bearish candlestick by at least half. In some cases, the green candlestick may significantly overlap the first one, strengthening the pattern and confirming that the buyers are gaining power.
- The last candlestick is no less significant than the star itself. It shows the market’s bullish bias and readiness to open long positions.
- After the Morning star pattern is built, the market continues growing in the next trading sessions. The price goes upward, resulting in the subsequent development of the uptrend.
Morning Star Example
The Morning Star pattern can be formed on different time frames and financial markets. Below are examples of the pattern for different trading instruments.
1. Commodity market, USCRUDE, M30 time frame.
Intraday trading example.

The chart shows a short-term downtrend. After breaking through the upper boundary, the price formed the Morning star pattern.
After the pattern was completed, the price reversed and started to grow. After the Bullish engulfing pattern, oil surged rapidly.
When the price hit the resistance of 79.82, bears started to sell the asset, and the Bearish marubozu pattern was formed. This became a signal to close long trades.
2. Forex market, GBPUSD, H4 time frame.
Medium-term swing trading example.

After a prolonged downtrend, the GBPUSD quotes continued to decline within the Symmetrical triangle chart pattern.
Before breaking the upper boundary of the pattern, a series of Morning star doji and Morning star reversal candlestick patterns emerged on the chart.
In addition, the latest pattern included an Inverted hammer pattern. After that, the price began to grow sharply, breaking the resistance of 1.2214.
3. Cryptocurrency market, BTCUSD, H4 time frame.

Before reaching a new high in mid-March, the Bitcoin price formed a Morning star pattern at the end of a short-term downtrend.
Notably, the pattern’s third candlestick failed to overlap at least half of the first bearish candlestick. Nevertheless, this pattern signaled a rally.
The upward reversal is also confirmed by the Three white soldiers uptrend continuation pattern.
4. Stock market, #SBUX, D1 time frame.
Long-term trading example.

After a sustained decline, the price kept trading within the large Double bottom pattern, exceeding the neckline.
In the area of the first bottom, several Morning star patterns were formed, providing a signal for a downtrend reversal.
Besides, the first pattern’s third long bullish candlestick opened with a large gap, giving a strong signal for a trend reversal.
Most often, such gaps can be found on stock charts.
How to Trade Morning Star
The Morning star pattern can be applied to many trading strategies. Let’s analyze the most effective of them.
1. Trading strategy using support levels

This strategy involves trading the Morning star pattern and opening trades at support levels.
Let’s take a closer look at this strategy on the hourly chart of Alphabet, Inc.
After the gap formed on the chart, the price continued to fall and reached the support level of 121.58, where the Morning star doji reversal pattern appeared. In addition, history shows that the gap will close sooner or later.
Therefore, it is possible to go long after the formation of the Morning star doji at the key support level.
The targets are 129.26, 135.15, and 140.67, i.e., the whole area of the gap. It is necessary to take profits partially at 129.26 and 135.15 and close the position completely at 140.67.
A stop-loss order should be placed below the support level and the Morning star doji pattern.
On the chart, after closing the gap at the resistance level of 140.67, the price began to form the bearish reversal patterns of Shooting star and Evening star and began to fall.
2. Trading strategy with Morning star confirmation using other candlestick patterns

On the four-hour chart, the EURUSD pair has dropped within the downward trend to the buy zone between 1.0667 and 1.0635.
The Bullish engulfing candlestick pattern offered the first confirmation of the upward reversal. Two Morning star patterns formed, which included the Hammer patterns. Another Hammer and Three white soldiers patterns also confirmed the reversal near 1.0734.
In this connection, long trades can be opened near 1.0734 after the Hammer pattern forms and confirms bullish momentum.
Targets are 1.0779, 1.0864, 1.0954, and 1.1007. Close your trade partially to maximize profits.
A stop-loss order is placed below 1.0667 and the second Morning star pattern.
The pair started a downward reversal at 1.1007 after the Shooting star bearish pattern, giving a signal to close the long trade.
3. Combined strategy for trading the Morning star pattern using technical indicators and large chart patterns
The combined strategy appears to be more effective as it involves the Morning star candlestick pattern, technical indicators, and large chart patterns.
This strategy depends on the instrument. Use different types of technical indicators such as :
- Trend indicators: MACD, MA Cross.
- Stochastic oscillators: RSI, Stochastic.
- Volume indicators: OBV, MFI, VWAP with SMA, Chaikin oscillator, AD (Accumulation/Distribution), tick volume.

The RSI, MFI, MACD, VWAP with SMA20 indicators can be used to analyze USCRUDE’s daily chart.
These indicators allow you to determine support/resistance levels, overbought and oversold zones, the strength of the current trend, and the expected price reversal levels.
In addition, it is necessary to use graphical and candlestick analysis to determine more favorable entry and exit points.
Technical analysis is as follows:
- Determine the buy zone and support levels.
- On the daily chart, the Symmetrical triangle patterns have emerged. The price can breach its upward or downward boundary. Nevertheless, the price is likely to increase.
- The Hammer reversal pattern has also formed.
- The Bullish engulfing pattern is following the Hammer.
- Notably, several Morning star reversal patterns have completed.
- The MFI rebounds upwards from the oversold boundary.
- The RSI shows an upward reversal from the lower boundary.
- MACD gave an earlier upward reversal signal by crossing the zero threshold from below when the price was inside the Symmetrical triangle.
- When the triangle was violated, the MACD was rising rapidly in the positive zone, finally confirming the bullish trend.
- Tick volumes began to grow intensively after the breakdown of the Symmetrical triangle’s upper boundary, indicating the mass opening of long trades.
- The price crossed the VWAP and SMA20 lines from below, giving another confirmation of a bullish trend.
- Buy after the breakout of the Symmetrical triangle pattern.
- Stop-loss.
- Target 1.
- Target 2.
- Target 3, close the trade completely.
- The Marubozu bearish pattern, signaling a downward price reversal.
In general, the combined technical analysis gave more than 10 buy signals after the Morning star pattern formed and the triangle’s upward boundary was breached. In the long term, such a trade could generate a significant profit within 2-3 months. The asset has appreciated by more than 80% over this period.
Morning Star vs. Evening Star Patterns

The Morning star pattern has a bearish counterpart, the Evening star, which signals an imminent trend reversal at its peak.
| Morning star | Evening star |
| The Morning star pattern is formed at the downtrend’s bottom. | The Evening Star pattern is formed at the uptrend’s peak. |
| Signals a downtrend reversal to the upside. | Signals an uptrend reversal to the downside. |
| The Morning star pattern’s first candlestick should be bearish, and the third one should be bullish. The second candlestick can be either bullish or bearish. | The first candlestick of the Evening Star pattern should be bullish, and the third candlestick is bearish. The second candlestick can be bullish or bearish. |
| A stop-loss order is set below the support level and the Morning star pattern. | A stop-loss order is placed above resistance level and the Evening star pattern. |
Pros and Cons of Using Morning Star Pattern
Any candlestick pattern has its advantages and disadvantages.
Despite the fact that the Morning star pattern gives a strong reversal signal, it is necessary to follow the risk and money management rules when using it in trading.
Pros
- The Morning star pattern indicates a potential trend reversal at the bottom, which allows you to open long positions at more favorable prices.
- The pattern is formed in almost all financial markets, including Forex, cryptocurrency, stock, and commodity markets.
- It can be used when trading on various timeframes from M5 to MN. The higher the time frame is, the stronger the Morning star signals are.
- The Morning star pattern generates clear entry points, targets, and stop-loss levels.
- The candlestick pattern is easy to identify on the price chart.
Cons
- On lower time frames, the pattern may give false signals due to the increased level of market noise.
- The pattern requires confirmation by other candlestick or chart patterns, as well as technical indicators.
Conclusion
The Morning star pattern is a classic Japanese candlestick pattern that signals the price reaching a low price area followed by a trend reversal.
The pattern is easy to recognize on a price chart and has effective trading criteria. Properly using the pattern will increase the profitability of your trades.
It is best to use the Morning star candlestick pattern with other chart patterns and technical indicators. This approach will allow you to conduct a more accurate technical analysis and open more profitable trades.
You can test trading the Morning star pattern for free on a loss-free demo account from LiteFinance, one of the best brokers in the market. The multifunctional online platform provides access to a wide array of trading instruments.

 Chat now!
Add a Comment