

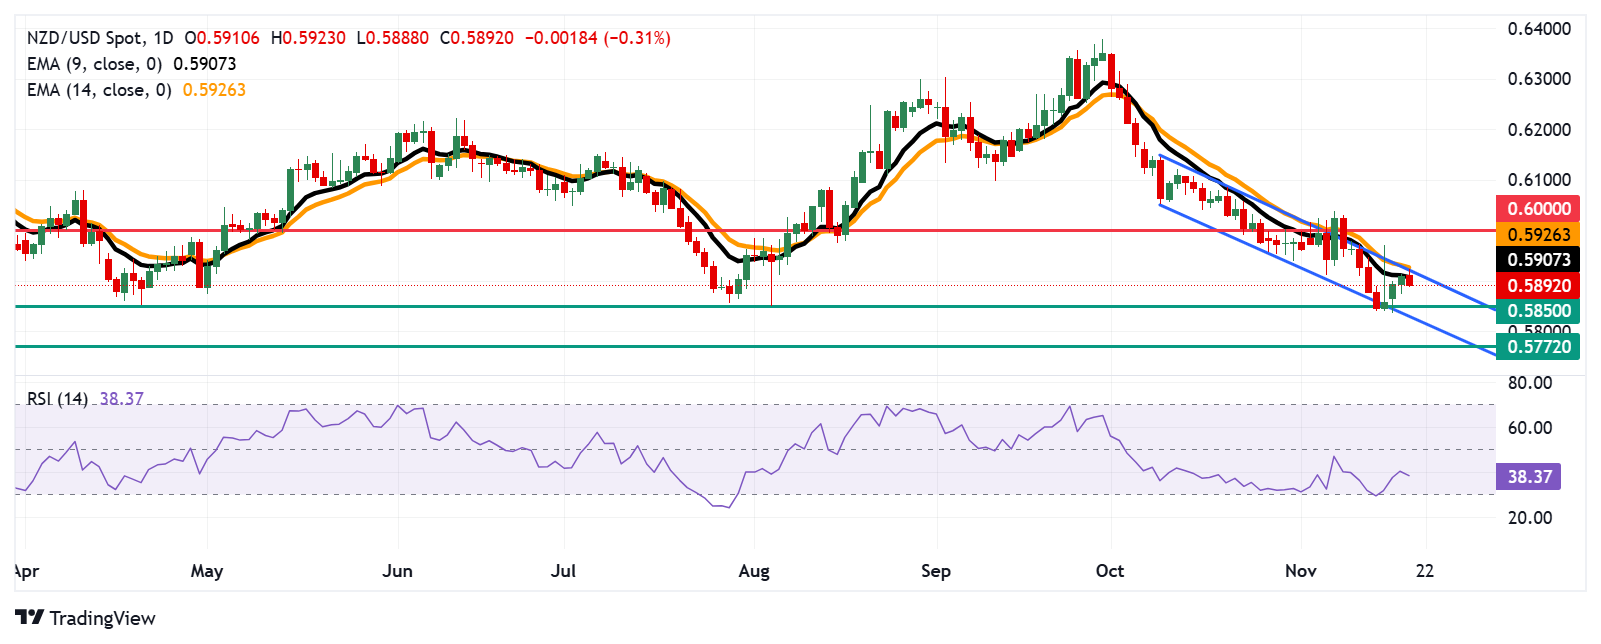
The NZD/USD pair breaks its three-day winning streak, trading around 0.5890 during the European session on Wednesday. A review of the daily chart highlights a growing bearish bias, as the pair moves downwards within the descending channel pattern.
The nine-day Exponential Moving Average (EMA) remains below the 14-day EMA, signaling persistent weakness in short-term price momentum. Meanwhile, the 14-day Relative Strength Index (RSI) consolidates below 50 level, confirming the ongoing bearish sentiment.
Regarding the support, the NZD/USD pair could navigate the region around the “throwback support” at the psychological level of 0.5850, followed by the lower boundary of the descending channel at 0.5930 level.
A decisive break below this channel would reinforce the bearish outlook, increasing downward pressure and potentially driving the Kiwi pair toward its two-year low of 0.5772, last seen in November 2023.
On the upside, immediate resistance lies at the nine-day EMA at 0.5907, followed by the 14-day EMA at 0.5926, which coincides with the upper boundary of the descending channel. A breakout above this channel would weaken the bearish momentum, paving the way for the NZD/USD pair to target the psychological level of 0.6000.
NZD/USD: Daily Chart
 Chat now!
Add a Comment