

The Australian Dollar (AUD) continues to struggle against the US Dollar (USD) on Friday. The tariff threats from Trump’s administration have boosted the US Dollar (USD) across the board and created a headwind for the AUD/USD pair. Additionally, speculations about a potential 10% tariff on Chinese goods might drag the AUD lower as China has been the largest trading partner of Australia.
The AUD received support after the release of domestic mixed employment data on Thursday. The seasonally adjusted Employment Change rose by 35,600, bringing the total number of employed people to 14,535,500 in November. Meanwhile, the Unemployment Rate dropped to 3.9%, the lowest since March, lower than market estimates of 4.2%.
The US Dollar appreciated due to the hotter-than-expected US Producer Price Index (PPI) report released on Thursday. The US PPI jumped 0.4% MoM in November, the largest gain since June, after an upwardly revised 0.3% increase in October. This reading was better than the 0.2% expected.
The US Federal Reserve (Fed) interest rate decision will take center stage next week. Traders are now fully pricing in a 25 basis point rate cut on December 18, according to the CME FedWatch Tool.
Technical Analysis: Australian Dollar maintains its position above 0.6350, yearly lows
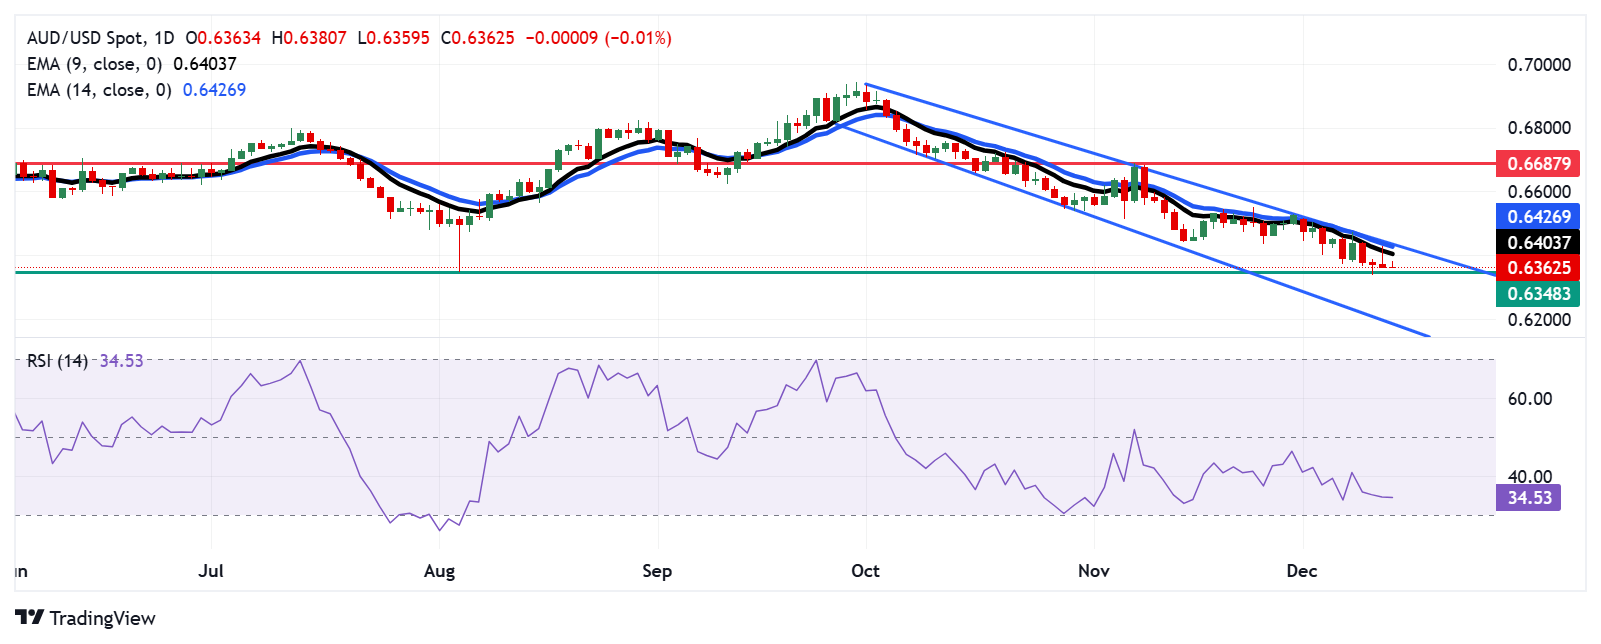
The AUD/USD pair hovers near 0.6360 on Friday. The daily chart analysis suggests a strengthening bearish bias as the pair moves downwards within a descending channel pattern. The 14-day Relative Strength Index (RSI) also remains slightly above the 30 level, indicating sustained bearish momentum.
The yearly low of 0.6348, last seen on August 5, serves as immediate support. A successful break below this level could strengthen the bearish bias and lead the AUD/USD pair toward the descending channel’s lower boundary around the 0.6190 level.
On the upside, the AUD/USD pair may find initial resistance around the nine-day Exponential Moving Average (EMA) at 0.6404. The next barrier appears at the 14-day EMA at 0.6427, which is aligned with the upper boundary of the descending channel. A decisive breakout above this channel could drive the pair toward the seven-week high of 0.6687.
AUD/USD: Daily Chart
 Chat now!
Add a Comment