

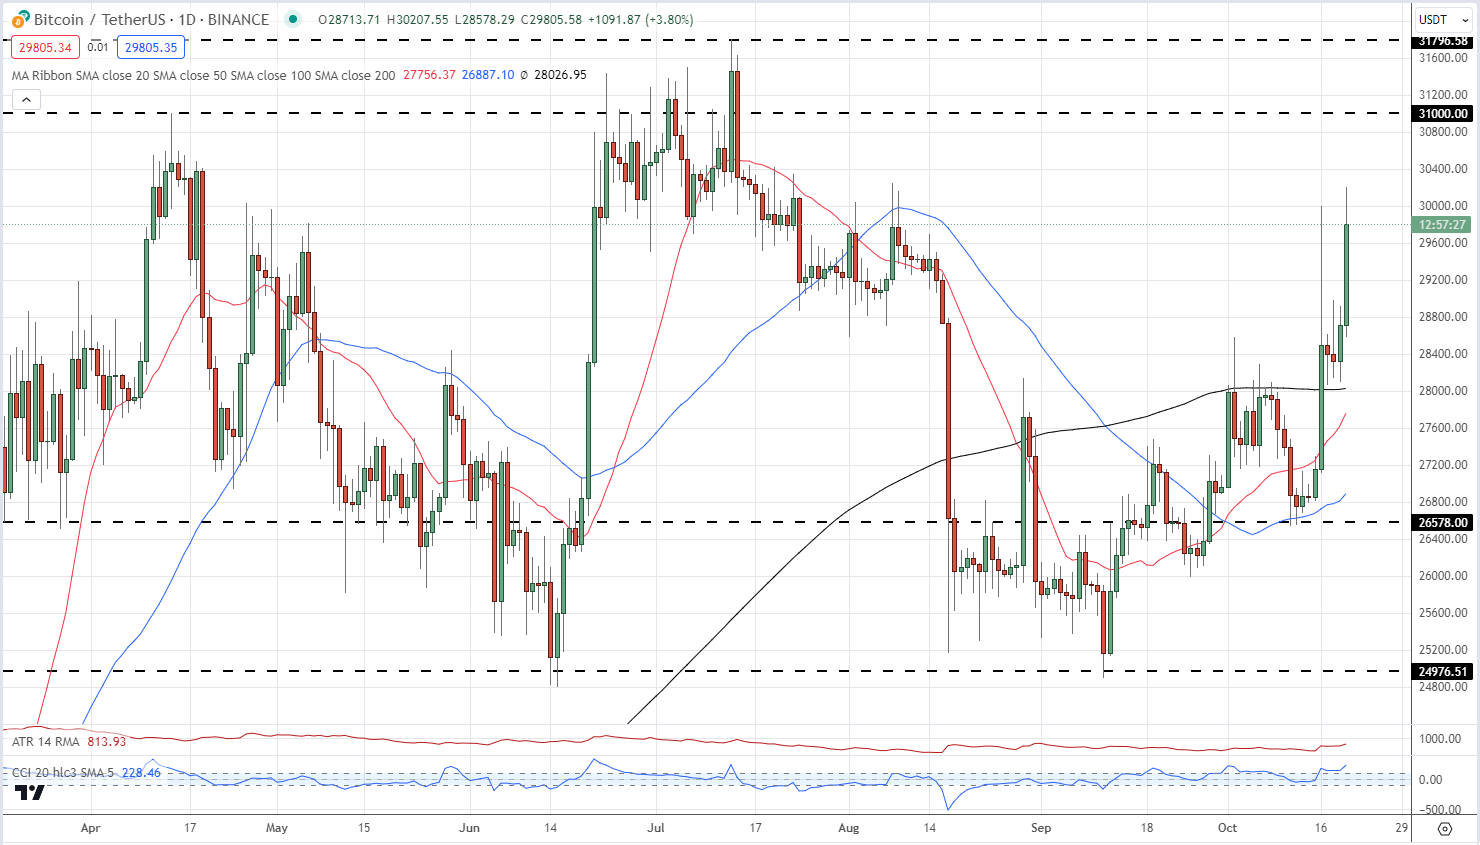
While the fundamental backdrop for Bitcoin may be built on growing hope, the technical picture has turned bullish this week. The long-dated moving average (200-dsma) has been broken convincingly and has now turned from resistance to support. The midweek price action saw this moving average hold firm and today’s rally confirms that $28k should now be seen as support in the near-term at least. A series of higher lows and higher highs underpins the bullish outlook. The next level of resistance is seen around $31k before the 2023 high print at $31,796 comes into play.
Bitcoin (BTC/USD) Daily Price Chart – October 20, 2023
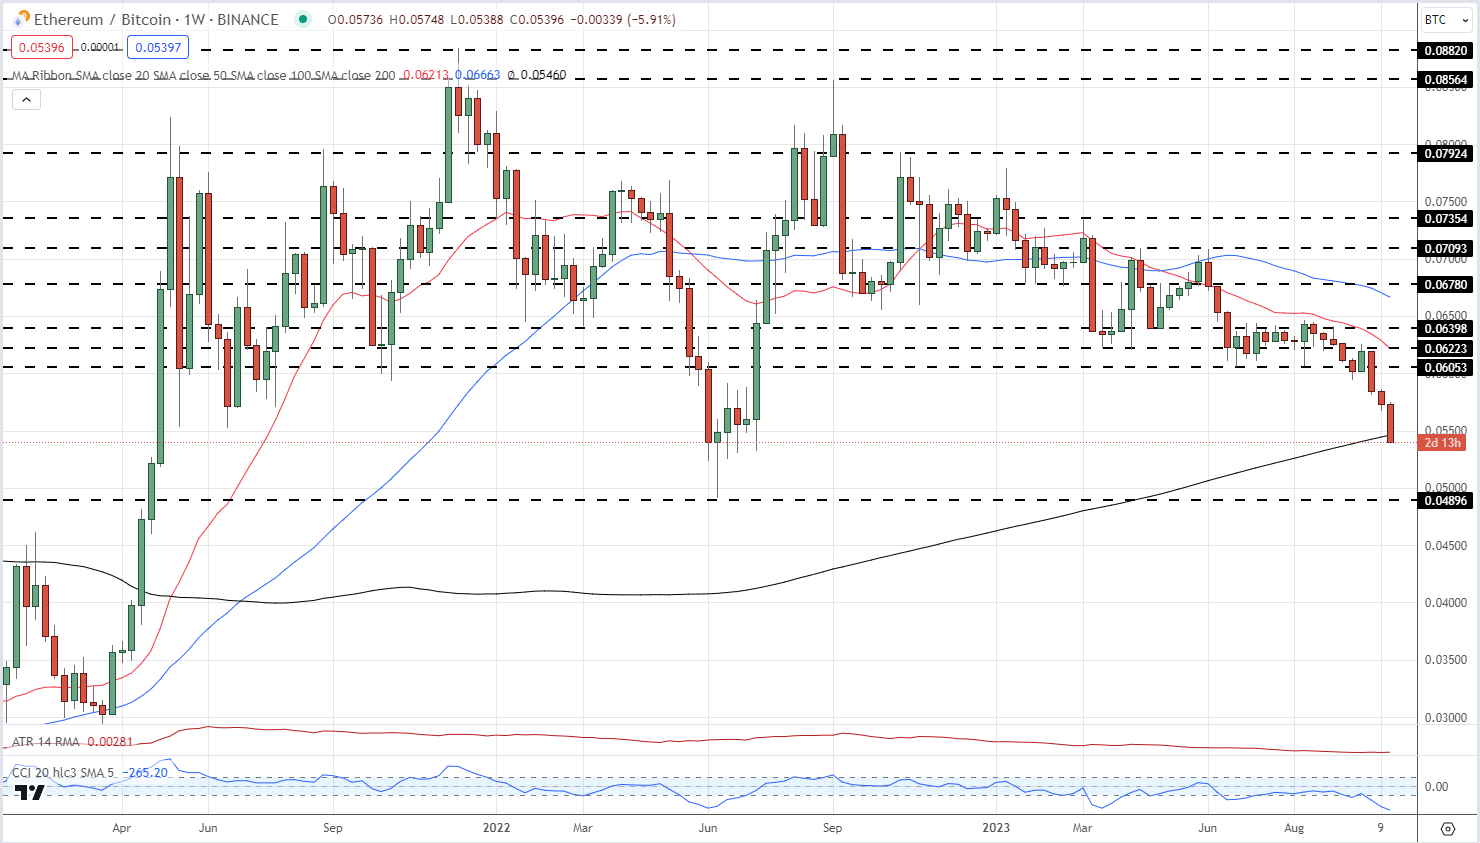
 Bitcoin has rallied in excess of 80% this year and remains the dominant cryptocurrency coin by a wide margin. Bitcoin makes up just under 51.5% of the total market capitalization, currently USD1.14 trillion, with Ethereum second at 17.3%. Bitcoin has also outperformed Ethereum by a margin as well and with horizontal support still a little bit away, BTC may well continue to outperform the market in the short term.
Ethereum/Bitcoin Weekly Price Chart – October 20, 2023
 What is your view on Bitcoin – bullish or bearish?? You can let us know via the form at the end of this piece or you can contact the author via Twitter @nickcawley1.
 Chat now!
Add a Comment