

Natural gas could be set for a material rebound: it rose to an eight-month high last week on higher heating demand, smaller-than-expected inventory build, and rising exports.
Natural gas rose 14% last week, the biggest weekly percentage increase since mid-June. LSEG forecast US gas demand, including exports, would rise in the coming two weeks. On technical charts, natural gas’ break above crucial resistance at the March & August highs of 3.03 has triggered a significant break out from an eight-month-long sideway range.
Natural Gas Daily Chart
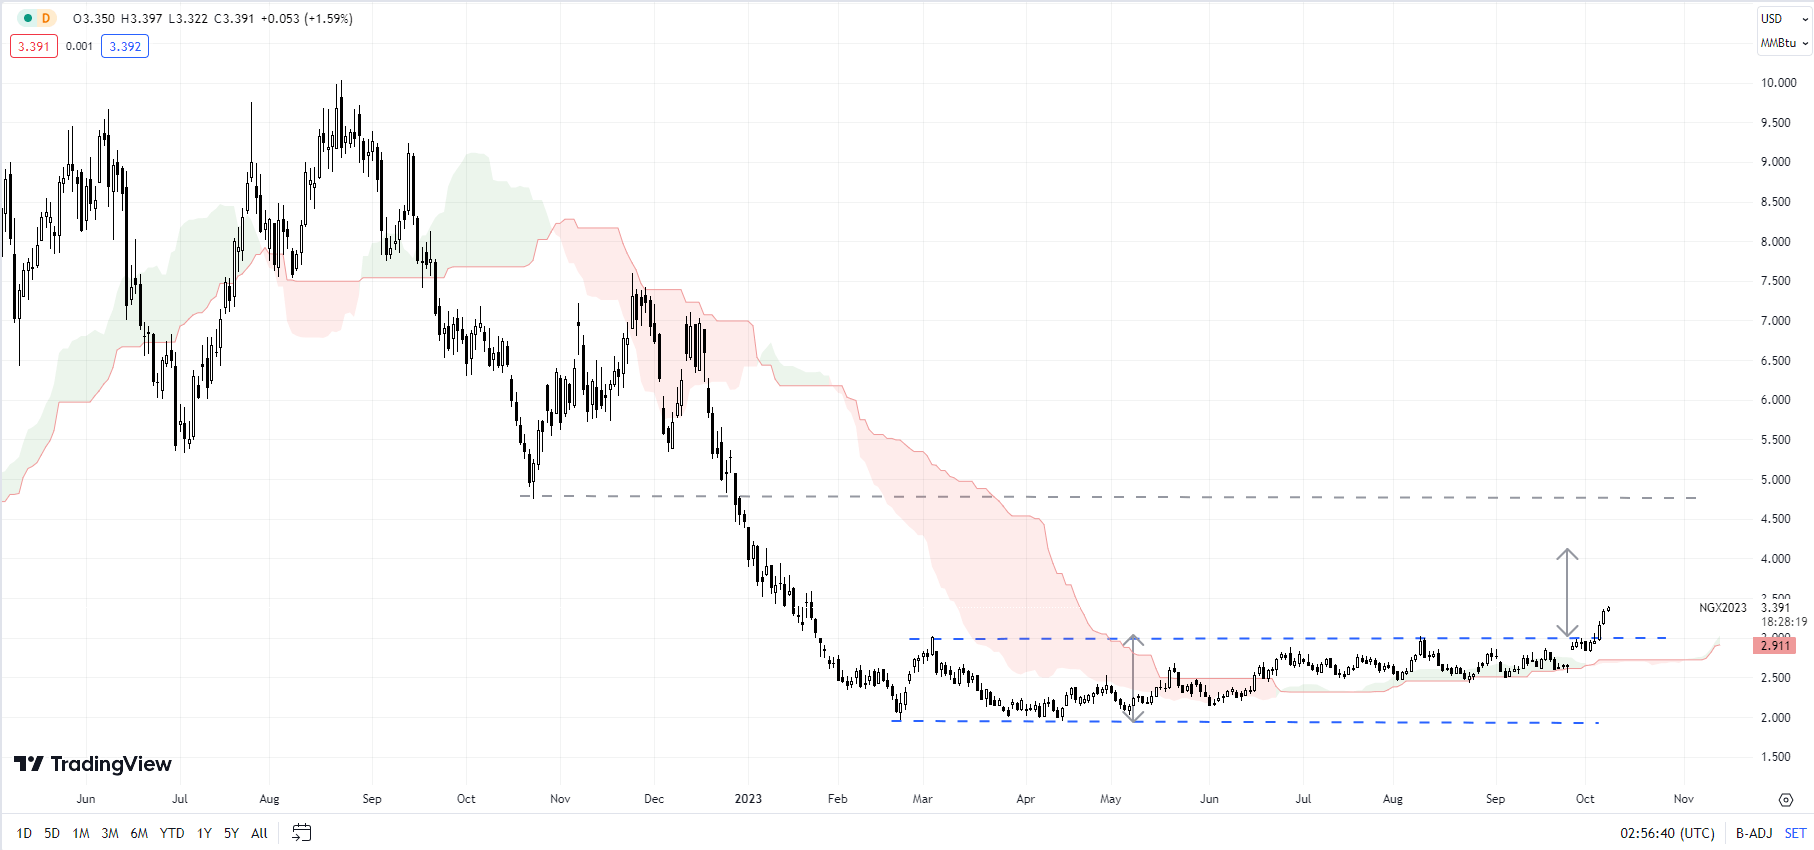
The price objective of the pattern points to a rise to around 4.00-4.10 in the coming weeks. Last week’s jump was also associated with a rise above the 200-day moving average and a decisive break above the 89-day moving average for the first time this year. Natural gas pulled back in August-September but held fairly strong support on the lower edge of the Ichimoku cloud on the daily charts.
Natural Gas Monthly Chart
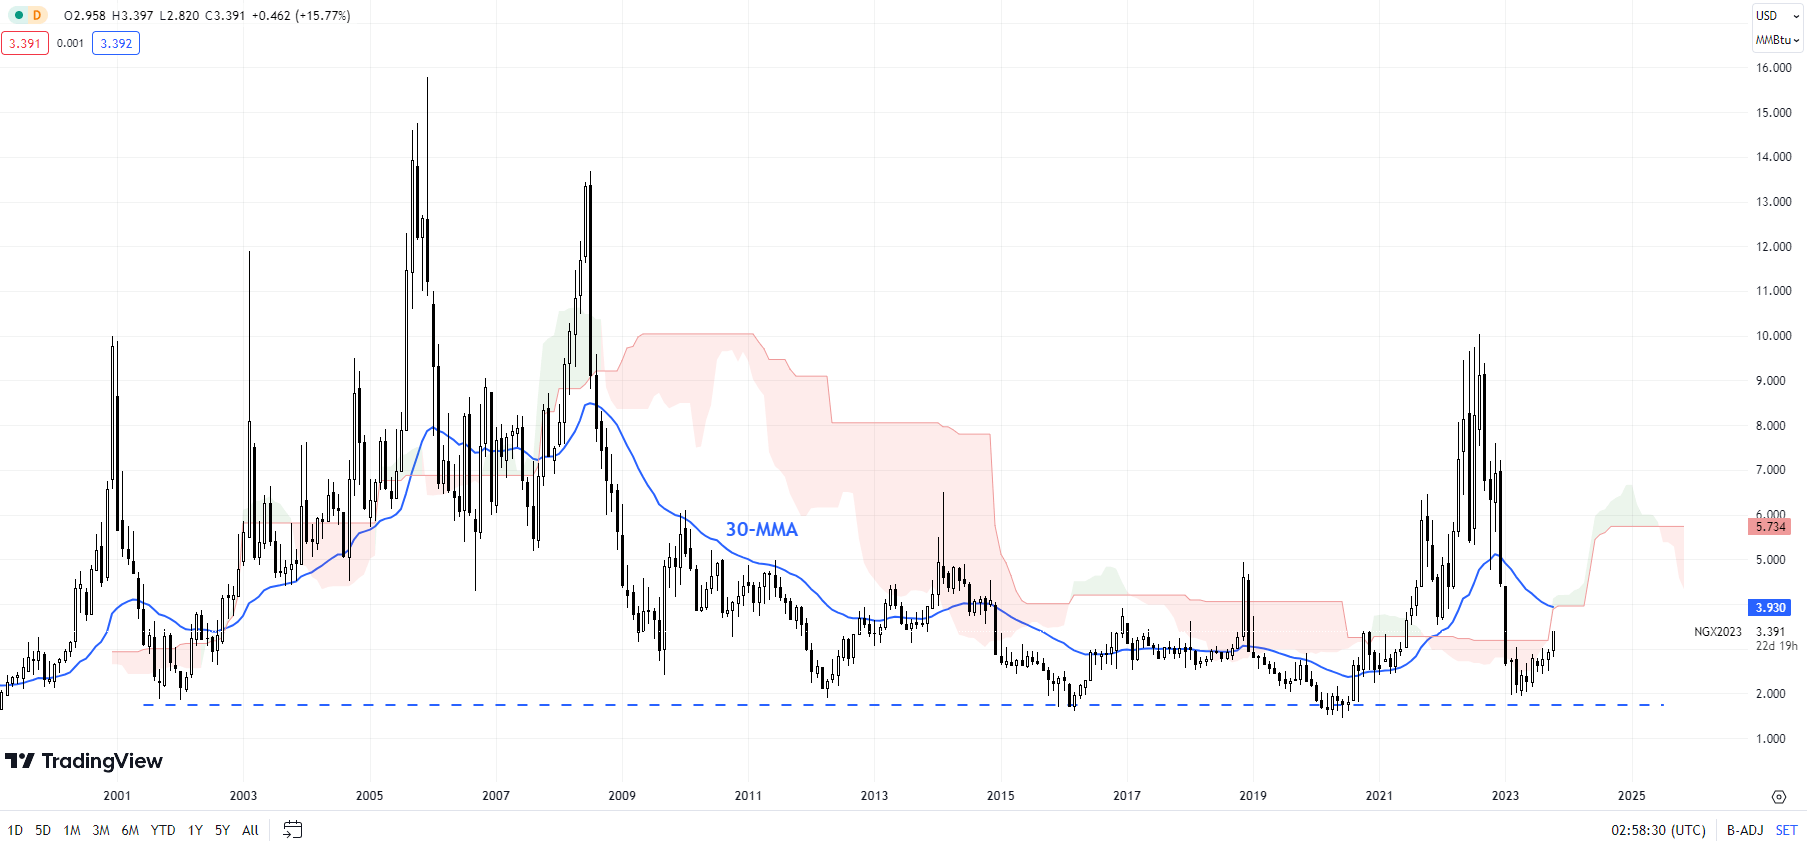
Importantly for the first time in 2023, natural gas staged a higher low. Last week’s rise has sealed the higher-high-higher-low sequence in the interim. 30-month moving average, coinciding with the 200-month moving average, around the psychological 4.00 mark. Subsequent resistance is at 4.20 (the 38.2% retracement of the November 2022-February 2023 fall, followed by the October 2022 low of 4.75. On the downside, a fall below the August low of 2.40 would negate the bullish view. Immediate support is at 3.03.
 Chat now!
Add a Comment