
Market Overview
Tuesday’s economic data had mixed results for the U.S. and Europe. The ISM Manufacturing PMI for the U.S. came in lower than expected at 47.2, below the forecast of 47.5, signaling continued contraction in the manufacturing sector.
However, ISM Manufacturing Prices were stronger at 54.0, indicating rising costs. On the European side, Spanish and Italian Services PMIs missed expectations, while France and Germany’s numbers remained in line with forecasts.
Experts trade the markets with IC Markets
Events Ahead
Looking forward, the EUR/USD pair will likely be influenced by upcoming economic reports, including the Eurozone’s PPI and the U.S. JOLTS Job Openings, which are forecasted to drop slightly to 8.09M.
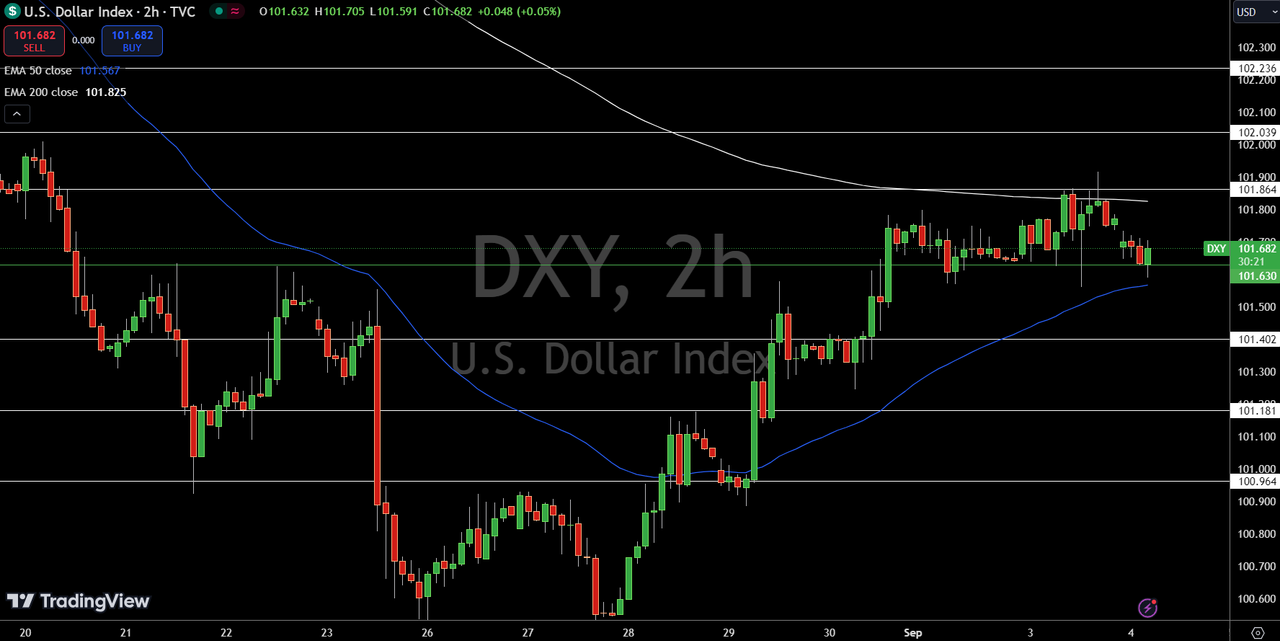
Additionally, U.S. 10-year bond yields remain elevated, which could bolster the Dollar Index (DXY), currently near 101.68.
A widening U.S. trade deficit, expected at -$78.8B, might also impact market sentiment, potentially driving further volatility in EUR/USD.
US Dollar Index (DXY)

The Dollar Index (DXY) is trading at $101.684, down 0.09% on the 4-hour chart. The pivot point sits at $101.630, with immediate resistance at $101.864 and further levels at $102.039 and $102.236. On the downside, support is seen at $101.402, followed by $101.181 and $100.964.
The 50-day Exponential Moving Average (EMA) at $101.567 is offering support, suggesting potential for a bullish reversal if the price stays above the pivot. However, a break below $101.630 could trigger further selling pressure.
US 10-year Bond Yields

If yields break below 3.80%, we could see further declines toward 3.76%. This decline in yields often correlates with a weaker U.S. dollar, as lower yields reduce demand for dollar-denominated assets.
Conversely, if yields bounce above the 3.85% level, the U.S. dollar could see renewed strength, making it more attractive to investors globally.
EUR/USD Technical Forecast

On the downside, support is seen at $1.10330, with further levels at $1.10112 and $1.09854. The 50-day EMA sits at $1.10693, while the 200-day EMA aligns closely at $1.10599.
The downward channel presents significant resistance, keeping a bearish bias below $1.10596. If EUR/USD breaks above this pivot level, we could see bullish momentum resume.
 Chat now!
Add a Comment