
EUR/USD struggles to find direction early Friday and moves sideways at around 1.1200 after closing virtually unchanged on Thursday. The near-term technical outlook reaffirms the pair’s indecisiveness.
Euro PRICE This week
The table below shows the percentage change of Euro (EUR) against listed major currencies this week. Euro was the weakest against the Japanese Yen.
| USD | EUR | GBP | JPY | CAD | AUD | NZD | CHF | |
|---|---|---|---|---|---|---|---|---|
| USD | 0.45% | 0.04% | -0.65% | 0.39% | -0.18% | 0.30% | 0.12% | |
| EUR | -0.45% | -0.28% | -0.57% | 0.43% | -0.00% | 0.34% | 0.15% | |
| GBP | -0.04% | 0.28% | -0.10% | 0.71% | 0.29% | 0.54% | 0.42% | |
| JPY | 0.65% | 0.57% | 0.10% | 1.05% | -0.15% | 0.10% | 0.54% | |
| CAD | -0.39% | -0.43% | -0.71% | -1.05% | -0.31% | -0.09% | -0.29% | |
| AUD | 0.18% | 0.00% | -0.29% | 0.15% | 0.31% | 0.24% | 0.11% | |
| NZD | -0.30% | -0.34% | -0.54% | -0.10% | 0.09% | -0.24% | -0.22% | |
| CHF | -0.12% | -0.15% | -0.42% | -0.54% | 0.29% | -0.11% | 0.22% |
The heat map shows percentage changes of major currencies against each other. The base currency is picked from the left column, while the quote currency is picked from the top row. For example, if you pick the Euro from the left column and move along the horizontal line to the US Dollar, the percentage change displayed in the box will represent EUR (base)/USD (quote).
The US Dollar (USD) failed to gather strength following the mixed macroeconomic data releases and allowed EUR/USD to hold its ground on Thursday.
The Bureau of Labor Statistics reported that annual producer inflation, as measured by the change in the Producer Price Index, softened to 2.4% in April from 2.7% in March. Other data from the US showed that Retail Sales increased 0.1% on a monthly basis in April, while the weekly Initial Jobless Claims came in at 229,000, matching the previous week’s reading and the market expectation.
The US economic calendar will feature Housing Starts and Building Permits data for April on Friday. More importantly, the University of Michigan (UoM) will publish the preliminary Consumer Sentiment Index data for May.
The UoM Consumer Sentiment Index declined for six consecutive months. If the data points to a further deterioration in consumer confidence, the USD could have a hard time finding demand heading into the weekend. On the other hand, a noticeable improvement could have the opposite impact on the currency’s valuation.
EUR/USD Technical Analysis
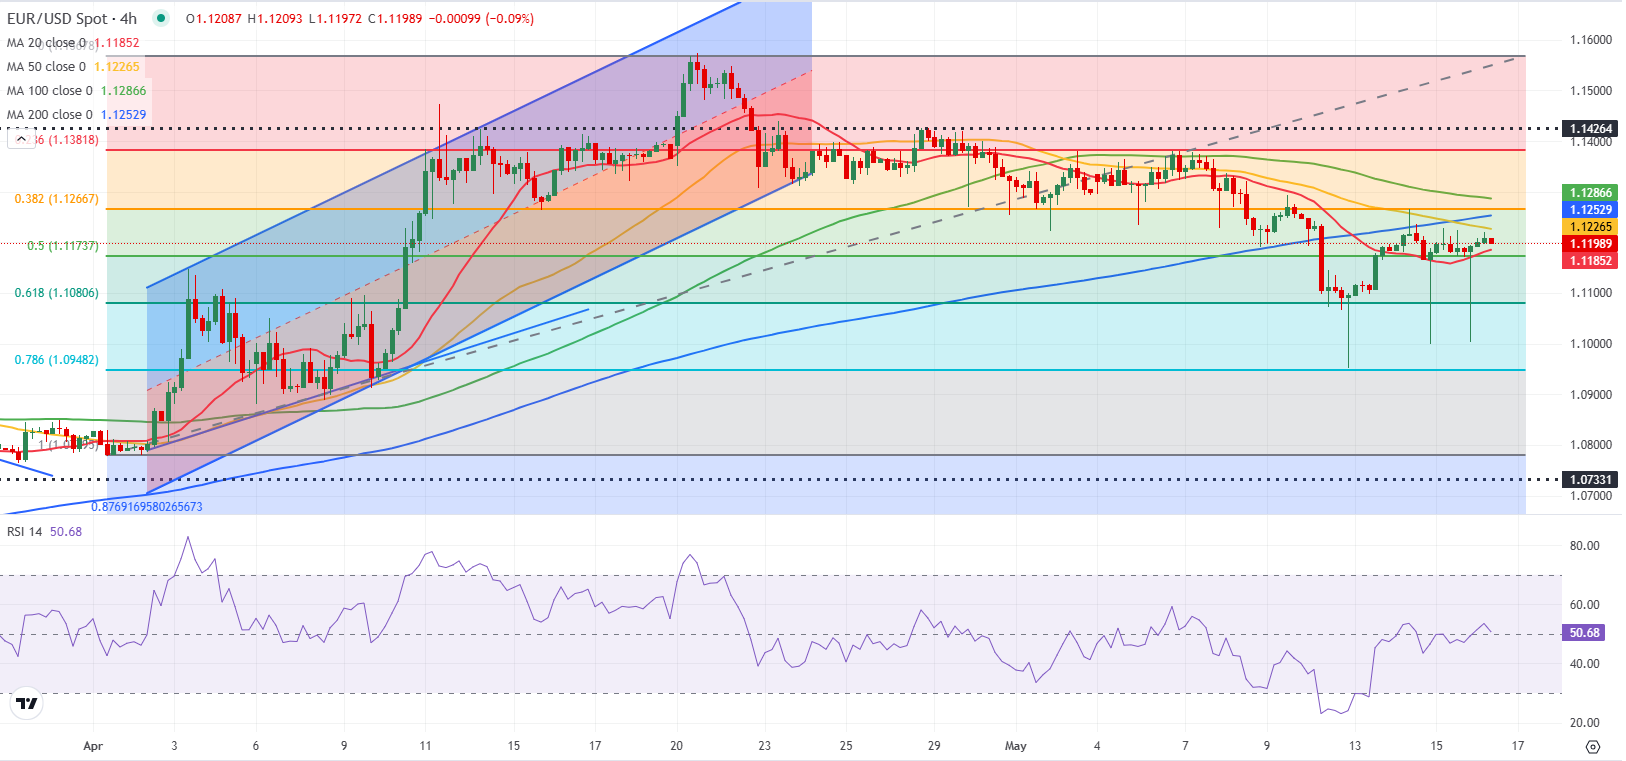
The Relative Strength Index (RSI) indicator stays near 50, highlighting a lack of directional momentum in the near term.
The Fibonacci 50% retracement level of the latest uptrend aligns as the first support level at 1.1170. In case EUR/USD falls below this level and starts using it as resistance, technical sellers could show interest. In this scenario, 1.1080 (Fibonacci 61.8% retracement) and 1.1000 (round level, static level) could be seen as next support levels.
On the upside, resistances are located at 1.1260-1.1270 (200-period Simple Moving Average (SMA), Fibonacci 38.2% retracement), 1.1290-1.1300 (100-period SMA, static level) and 1.1380 (Fibonacci 23.6% retracement).
 Chat now!
Add a Comment