
The Federal Reserve (Fed) and the Bank of Japan (BoJ) have just done something remarkably similar. Both central banks raised interest rates by 25 basis points (bps) last week, both are confronting inflation risks, and both signal that future decisions will depend on incoming economic data.
On paper, the two decisions appear to tell the same story: Monetary policy is becoming tighter on both sides of the Pacific. Markets, however, rarely trade on the headline alone.
What investors believe will happen next can matter much more than what a central bank has just done. And once the market reaction following the two decisions is brought into the picture, the apparent similarity between the Fed and the BoJ begins to disappear.
The USD/JPY chart makes that divergence difficult to miss.
The USD/JPY chart reveals which rate hike markets believe
The Fed raised interest rates by 25 bps on Wednesday, September 16, taking its target range to 3.75%-4.00%. Two days later, on Friday, September 18, the BoJ followed with its own 25-basis-point increase, lifting its policy rate to 1.25%, the highest level in 31 years.
However, USD/JPY rose after the two central-bank decisions, clearly indicating how investors interpreted them.
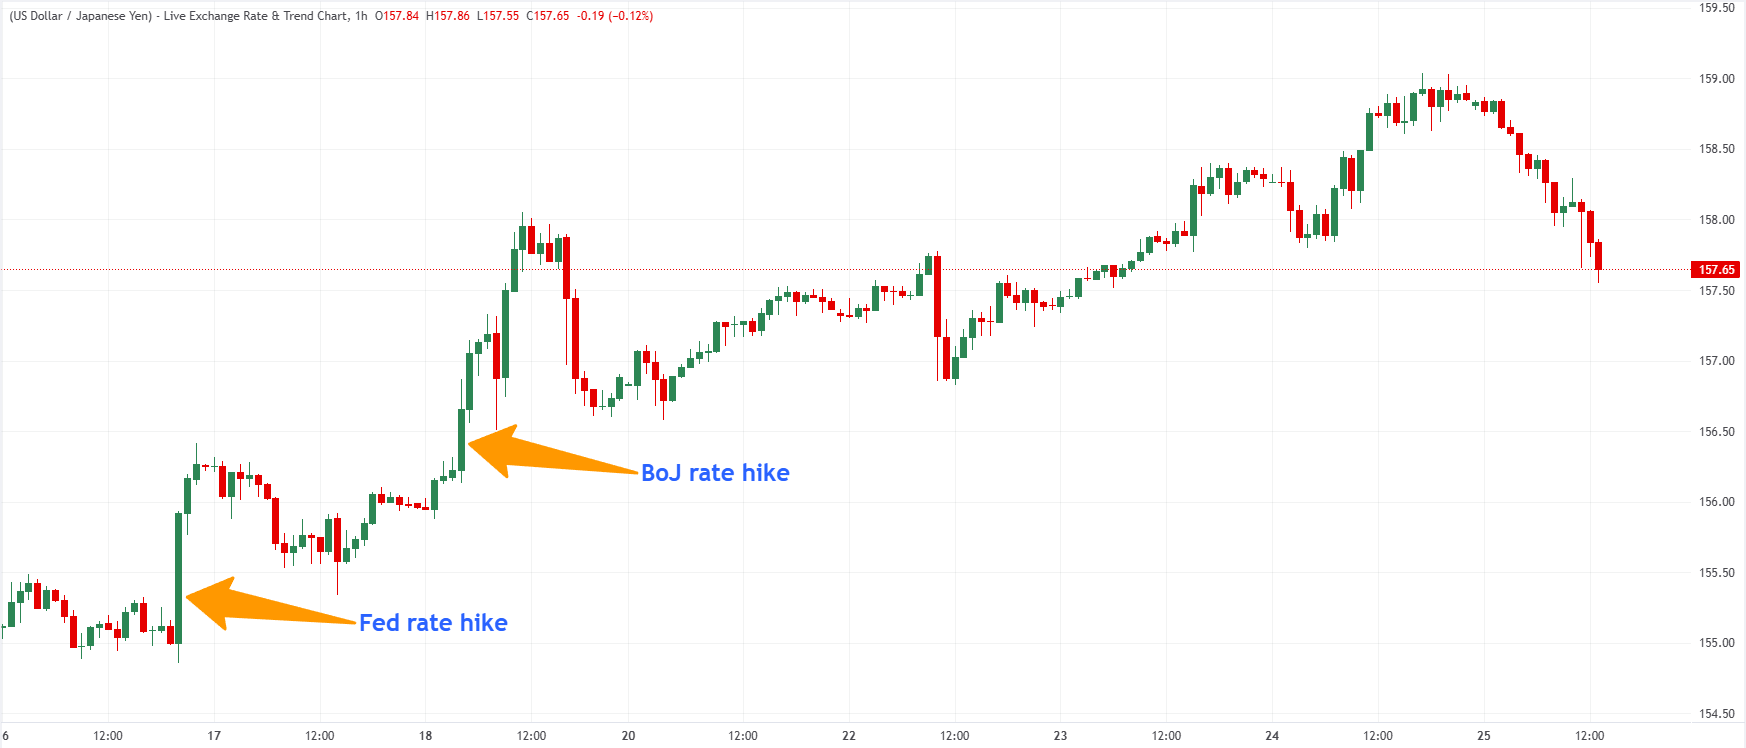
A rising USD/JPY means that the US Dollar (USD) is appreciating against the Japanese Yen (JPY), and that the JPY is weakening. In other words, even though both central banks tightened policy by the same 25 bps, the currency market treated the two decisions very differently.
That reaction is particularly striking on the Japanese side. The BoJ raised its policy rate to 1.25%, its highest level in 31 years. Higher interest rates would normally be expected to make a currency more attractive by increasing returns on assets denominated in that currency. Yet the Japanese Yen weakened after the decision.
The explanation lies less in the rate hike itself than in what accompanied it.
The BoJ approved the increase by a 7-2 vote, with board members Toichiro Asada and Ayano Sato opposing the move. Governor Kazuo Ueda also provided no clear timetable for another increase, leaving investors uncertain about how quickly the central bank is prepared to continue normalizing monetary policy.
Ray Attrill, head of FX strategy at National Australia Bank, told Reuters that the BoJ had “clearly underwhelmed versus expectations,” noting that the two dissenting votes raised additional questions about the strength of the central bank’s tightening consensus.
The market, therefore, received a rate hike, but not necessarily the promise of a forceful hiking cycle.
The Fed delivered the same hike but a very different signal
The Fed also raised interest rates by 25 bps, taking the fed funds rate target range to 3.75%-4.00%. The size of the move was identical to the BoJ’s. The message surrounding it was not.
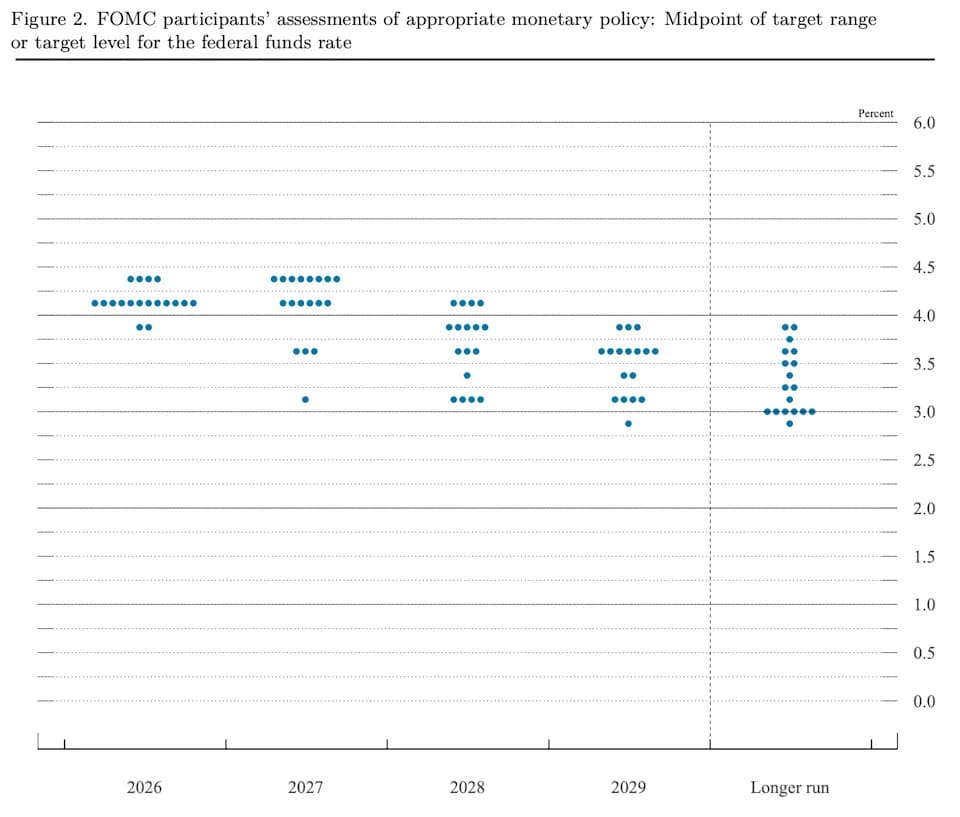
Sixteen of the Fed’s 18 policymakers expect at least one additional 25 bps increase before the end of the year. Updated projections put the policy rate at 4.10% at the end of 2026, compared with 3.80% in the previous projections. For investors, that changed the meaning of the hike.
 Chat now!
Add a Comment