
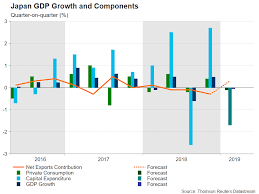
In Q2 2023, gross domestic product (GDP) increased significantly (+0.5% in volume terms*, after +0.1% in the previous quarter).
Foreign trade contributed positively to GDP growth (+0.7 points after +0.5 points). Exports bounced back this quarter (+2.6% after -0.8%), as well as imports to a lesser extent (+0.4% after – 2.0%).
Conversely, final domestic demand (excluding inventories) contributed again negatively to GDP growth (-0.1 points in Q2 2023, as in the previous quarter), because of the decrease of household consumption (-0.4% after 0.0%). Gross fixed capital formation (GFCF) increased (+0.1% after – 0.4%).
Finally, the contribution of inventory changes to GDP growth was slightly negative this quarter (- 0.1 points after -0.3 points in Q1 2023).
* Volumes are measured at previous year’s prices, chain-linked and adjusted for seasonal variations and working day effects (SA-WDA).
GDP – SA-WDA
470 000 500 000 530 000 560 000 590 000 470 000 500 000 530 000 560 000 590 000 in million euros Q1 2005 Q1 2006 Q1 2007 Q1 2008 Q1 2009 Q1 2010 Q1 2011 Q1 2012 Q1 2013 Q1 2014 Q1 2015 Q1 2016 Q1 2017 Q1 2018 Q1 2019 Q1 2020 Q1 2021 Q1 2022 Q2 2023
GDP and its main components
| 2022 Q3 | 2022 Q4 | 2023 Q1 | 2023 Q2 | 2022 | 2023 (ovhg) | |
|---|---|---|---|---|---|---|
| GDP | 0.2 | 0.1 | 0.1 | 0.5 | 2.5 | 0.8 |
| Imports | 3.2 | -0.5 | -2.0 | 0.4 | 8.8 | -0.3 |
| Household consumption expenditure | 0.5 | -0.8 | 0.0 | -0.4 | 2.1 | -0.4 |
| General government’s consumption expenditure | 0.3 | 0.7 | -0.2 | 0.0 | 2.6 | 0.4 |
| GFCF | 2.3 | 0.3 | -0.4 | 0.1 | 2.3 | 1.2 |
| Of which non-financial corporations and unincorporated enterprises | 4.1 | 0.7 | -0.2 | 0.7 | 3.8 | 3.0 |
| Households | -1.2 | -1.0 | -1.4 | -1.6 | -1.2 | -3.7 |
| General government | 1.4 | 0.8 | 0.2 | 0.5 | 1.5 | 1.8 |
| Exports | 0.5 | 1.1 | -0.8 | 2.6 | 7.3 | 2.3 |
| Contributions: | ||||||
| Internal demand excluding inventory changes | 0.9 | -0.2 | -0.1 | -0.1 | 2.4 | 0.2 |
| Inventory changes | 0.2 | -0.3 | -0.3 | -0.1 | 0.7 | -0.3 |
| Net foreign trade | -0.9 | 0.5 | 0.5 | 0.7 | -0.6 | 0.9 |
- This growth rate is seasonally and working-day adjusted; volumes are chain-linked previous-year-prices volumes.
Total production accelerated in Q2 2023 (+0.8% after +0.4%)
Total production (goods and services) rose in the second quarter of 2023 at a faster pace than in the previous quarter (+0.8% after +0.4%).
This acceleration was partly due to the dynamism of the manufacturing industry (+1.1% after +0.8%). Production accelerated in transport equipment (+3.6% after +2.8%), slowed down significantly in the refineries (+1.7% after +10.1%), and recovered in “other manufactured products” (+0.5% after -0.4%). At the same time, energy production remained dynamic, following the continued reopening of nuclear power plants (+4.1% after +4.0%). Production of market services accelerated as well (+0.7% after 0.0%). It was driven in particular by production of business services (+0.8% after +0.2%), in information-communication (+1.4% after +1.1%), and of transport services (+1.2% after -1.1%). Conversely, production declined more markedly in construction (‑0.8% after ‑0.3%).
GDP and its main components
symboles_defaut.xml, symboles_defaut.xml,rond 0.0 1.0 2.0 3.0 4.0 -1.0 -2.0 -2.0 -1.0 0.0 1.0 2.0 3.0 4.0 quarterly variation in % and contribution in percentage points 2021 2022 2023 Inventory changes Net foreign trade Consumption GDP GFCF
Production, consumption and GFCF: main components
| 2022 Q3 | 2022 Q4 | 2023 Q1 | 2023 Q2 | 2022 | 2023 (ovhg) | |
|---|---|---|---|---|---|---|
| Production of branches | 0.4 | 0.2 | 0.4 | 0.8 | 3.7 | 1.6 |
| Goods | 0.2 | 0.1 | 1.5 | 1.8 | 0.5 | 3.0 |
| Manufactured industry | 0.9 | -0.8 | 0.8 | 1.1 | 1.7 | 1.6 |
| Construction | -0.2 | 0.1 | -0.3 | -0.8 | -0.7 | -1.0 |
| Market services | 0.7 | 0.2 | 0.0 | 0.7 | 6.5 | 1.4 |
| Non-market services | 0.2 | 0.2 | 0.5 | 0.2 | 1.1 | 0.7 |
| Household consumption | 0.5 | -0.8 | 0.0 | -0.4 | 2.1 | -0.4 |
| Food products | -1.1 | -3.0 | -2.6 | -2.7 | -3.7 | -7.6 |
| Energy | 0.4 | -7.9 | 6.2 | 1.7 | -4.1 | 0.8 |
| Engineered goods | -0.2 | 0.2 | -0.1 | -0.1 | -1.1 | -0.1 |
| Services | 0.0 | 0.6 | 0.4 | 0.7 | 8.5 | 2.1 |
| GFCF | 2.3 | 0.3 | -0.4 | 0.1 | 2.3 | 1.2 |
| Manufactured goods | 6.9 | 1.3 | -0.9 | 0.4 | 3.4 | 3.9 |
| Construction | -0.1 | 0.2 | -0.4 | -0.9 | -0.9 | -1.1 |
| Market services | 2.4 | -0.1 | -0.2 | 1.2 | 5.4 | 2.3 |
Household consumption declined in Q2 2023 (-0.4% after 0.0%)
Household consumption declined in the second quarter of 2023 (-0,4% after 0.0%). The decline in household purchases of goods this quarter (-0.7% after +0.1%) was due to a further decrease of food consumption, which fell for the sixth consecutive quarter (-2.7% after -2.6%).
Energy consumption slowed down (+1.7% after +6.2%). Half of the increase in the second quarter was explained by the rise in actual energy consumption, and half by a further reduction this quarter in the share of energy expenditure borne by the public sector, due to the timing of payment of the energy voucher.
Household consumption of services rose by 0.7% (after +0.4% in the previous quarter). This acceleration was driven by accommodation and food services (+1.6% after -0.3%) and transport services (+3.0% after +1.6%).
GFCF bounced back slightly in Q2 2023 (+0.1% after -0.4%)
Total GFCF was slightly back on the rise in Q2 2023 (+0.1% after -0.4%). This rebound was driven by the GFCF in manufactured goods (+0.4% after -0.9%), thanks in particular to increased investment in transport equipment (+1.9% after ‑0.8%). GFCF in market services rebounded this quarter (+1.2% after -0.2%), driven by the dynamism of investment in information-communication (+2.1% after +1.7%), and despite the continuing decline of investment in real estate transaction services (‑1.3% after ‑8.0%). Investment in construction declined also again (‑0.9% after ‑0.4%).
In particular, household GFCF kept falling for the fourth consecutive quarter (-1.6% after -1.4%) due to a decline in new housing construction and a drop in real estate transactions in both new and existing buildings.
Foreign trade contributed positively to GDP growth (+0.7 points)
The contribution of foreign trade to GDP growth was positive again in Q2 2023 (+0.7 points, after +0.5 points in the previous quarter), due to a greater increase in exports than in imports.
Exports recovered clearly in the second quarter of 2023 (+2.6% after -0.8%). In particular, exports of transport equipment increased sharply (+11.2% after +1.8%), with notably the delivery of a cruise ship. Moreover, exports rebounded in coking and refining (+10.3% after -5.9%) and in the “other manufactured products” (+1.4% after -1.3%). Exports of services were for their part almost stable (+0.1% after -1.0%).
Imports partially rebounded in the second quarter of 2023 (+0.4% after -2.0%) driven by a rebound in manufactured product imports (+1.2% after -2.3%). In particular, imports in coking and refining grew significantly this quarter (+12.1%), after a sharp decline (-17.8%) in Q1 2023. Imports of the “others manufactured goods” increased this quarter (+1.5% after -3.0%) while those of capital goods continued to decline (-1.2% after -1.0%). At last, imports of services fell back this quarter (-2.0% after +2.5%), due to a decline in transport services (-7.0% after +7.7%).
The contribution of inventory changes to GDP growth was slightly negative in Q2 2023 (-0.1 points)
The contribution of inventory changes to GDP growth was slightly negative this quarter: -0.1 points, after -0.3 points in Q1 2023. This near-stability was due to a fall in transport equipment inventories, due in particular to the delivery of a cruise ship, offset by a rebound in coking and refining inventories, following the strikes in the first quarter of 2023.
Households’ disposable income and ratios of households’ account
| 2022 Q3 | 2022 Q4 | 2023 Q1 | 2023 Q2 | 2022 | 2023 | |
|---|---|---|---|---|---|---|
| HDI | 2.5 | 3.3 | 1.6 | na | 5.0 | 5.7 |
| HDI (purchasing power) | 0.9 | 1.3 | -0.4 | na | 0.2 | 0.8 |
| HDI by cu* (purchasing power) | 0.7 | 1.2 | -0.5 | na | -0.4 | 0.5 |
| Adjusted HDI (purchasing power) | 0.7 | 1.2 | -0.3 | na | 1.1 | 0.8 |
| Saving rate (level) | 16.9 | 18.6 | 18.3 | na | 17.5 | 18.3 |
| Financial saving rate (level) | 5.5 | 7.6 | 7.3 | na | 6.2 | 7.3 |
Ratios of non-financial corporations’s account
| 2022 Q3 | 2022 Q4 | 2023 Q1 | 2023 Q2 | 2022 | |
|---|---|---|---|---|---|
| Profit share | 32.0 | 31.8 | 31.7 | na | 31.7 |
| Investment ratio | 26.3 | 26.3 | 26.1 | na | 25.9 |
| Savings ratio | 22.6 | 22.5 | 21.1 | na | 22.2 |
| Self-financing ratio | 85.8 | 85.6 | 80.9 | na | 85.7 |
Expenditure, receipts and net borrowing of public administrations
| 2022 Q3 | 2022 Q4 | 2023 Q1 | 2023 Q2 | 2022 | |
|---|---|---|---|---|---|
| In billions of euros | |||||
| Total expenditure | 388.3 | 394.2 | 393.6 | na | 1,536.0 |
| Total receipts | 356.3 | 352.2 | 360.6 | na | 1,411.5 |
| Net lending (+) or borrowing (–) | -32.0 | -42.1 | -33.0 | na | -124.5 |
| In % of GDP | |||||
| Net lending (+) or borrowing (–) | -4.8 | -6.2 | -4.8 | na | -4.7 |
Revisions
The estimate of GDP growth has been revised downwards by 0.1 points in the first quarter of 2023 and upwards by 0.1 points in the fourth quarter of 2022. GDP thus increased by +0.1% in the fourth quarter of 2022 as in the first quarter of 2023. Since the previous publication, new information has been incorporated and the seasonal adjustment (SVA) and working day adjustment (WDA) coefficients have been updated.
 Chat now!
Add a Comment