

Gold Forecast Video for 12.10.23 by Bruce Powers
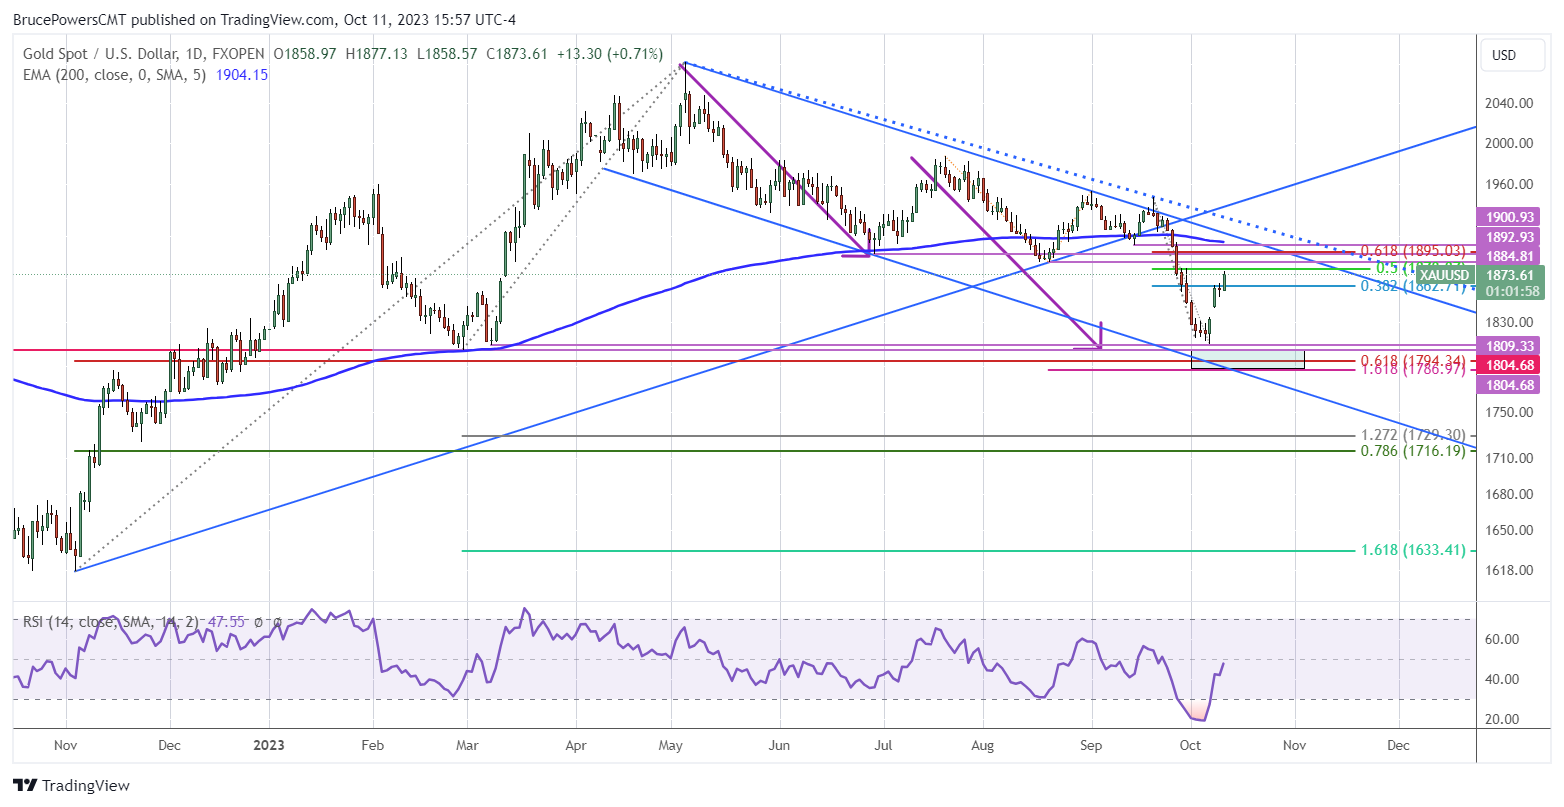
Gold continued its rally off the 1,810-swing low today as it advanced to a new trend high of 1,877, and it is on track to close at a new daily high for the rally. Today’s advance almost completed a 50% retracement, which is at 1,879. Further, gold is set to close strong, in the top third of the day’s range.
Trading Derivatives carries a high level of risk to your capital and you should only trade with money you can afford to lose. Trading Derivatives may not be suitable for all investors, so please ensure that you fully understand the risks involved, and seek independent advice if necessary. A Product Disclosure Statement (PDS) can be obtained either from this website or on request from our offices and should be considered before entering into a transaction with us. Raw Spread accounts offer spreads from 0.0 pips with a commission charge of USD $3.50 per 100k traded. Standard account offer spreads from 1 pips with no additional commission charges. Spreads on CFD indices start at 0.4 points. The information on this site is not directed at residents in any country or jurisdiction where such distribution or use would be contrary to local law or regulation.
Gold Points to Test of 1,885 or Higher
The current advance looks to be heading higher to test resistance around prior lows, along with the 200-Day EMA and downtrend line. Next on the agenda is a test of resistance around the 1,885-swing low from August. This is followed by a price range from 1,893 to 1,895. The lower level is the June swing low and the higher is the 61.8% Fibonacci retracement. Subsequently, the September swing low at 1,901 matches the 200-Day EMA at 1,904.
Relative Strength of the Rally Points to Higher Prices
There have only been two advances of notes since the retracement began from the record 2,082 high in gold. So far, gold is up as much as 3.7% from the October swing low of 18.10. That slightly exceeds the prior rally of 3.6% that started from the August 21 swing low and is less than the 5.0% advance that began from the June 29 swing low.
Certainly, given the potential significance of this month’s swing low, as it may be the low for some time, an advance to at least match the 5.0% rally seems possible before a significant correction. That would occur at a high of 1,901. An exact match for potential resistance around the September swing low. Therefore, there are three methods identifying a similar price zone.
Bull Hammer Breakout on Weekly
The strength seen so far during the rally is supported by a bullish breakout in the weekly chart at the beginning of this week. Last week completed a bullish hammer candlestick pattern. It triggered Monday on a rally above last week’s high of 1,850. And strength was confirmed by two daily closes on Monday and Tuesday above that high.
Downside Support
On the downside, a drop below today’s low signals likely further weakness. There is a possibility that the earlier gap may be filled. If so, gold will have to drop to 1,835 to fill the gap.
 Chat now!
Add a Comment