

Gold prices are experiencing a mild pullback after testing their highest levels since May 8 on Monday, as investors continue to digest trade-related headlines, including US President Donald Trump’s request that countries submit their trade offers by Wednesday and the possibility of a call between Trump and Chinese President Xi Jinping.
Looking at the US economic calendar, the JOLTS (Job Openings and Labor Turnover Survey) data report, scheduled for release at 14:00 GMT, will mark the start of a critical week of labor-related economic data.
This report is expected to provide further insight into labor market conditions. Expectations are for the number of job openings in April to decrease to 7.1 million from 7.192 million in March.
The release of the JOLTs data will be closely watched as it provides crucial signals regarding labor demand, which could influence the Fed’s decision-making on interest rates. Job openings and labor turnover are key indicators for the Fed as it assesses whether economic conditions warrant a shift in its monetary policy stance.
Additionally, Chicago Fed President Austin Goolsbee and Fed Governor Lisa Cook will speak during the US session, offering further insights into the economic and interest rate outlook for the United States. Participants are eagerly awaiting any hints regarding when the Federal Reserve might begin to reduce interest rates again after keeping them unchanged for many months.
According to the CME FedWatch Tool, market participants are currently pricing in a 57% chance of a rate cut in September. For June and July meetings, the expectation is that the Fed will maintain its benchmark rate at the current range of 4.25%-4.50%.
This data and commentary are crucial in shaping expectations for future monetary policy moves, especially as the Fed navigates the delicate balance between combating inflation and supporting employment growth.
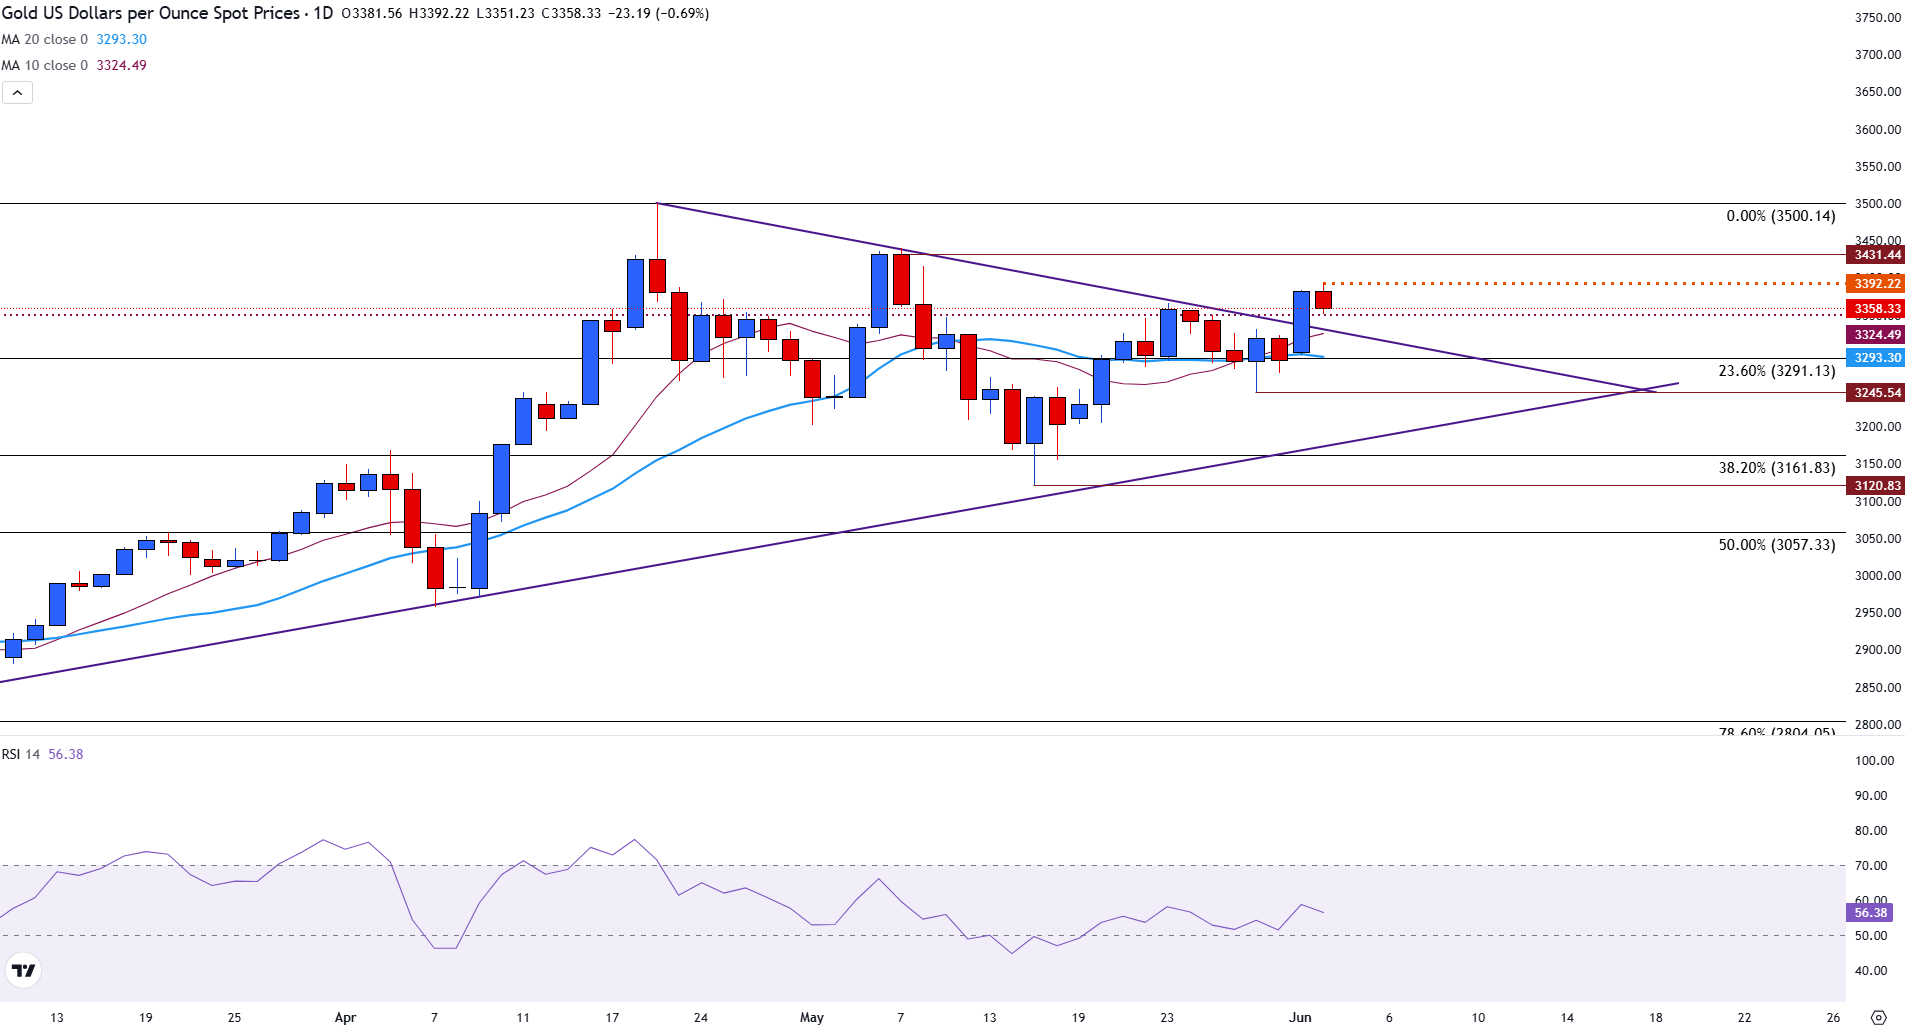
Gold technical analysis: Finding support above $3,350
Gold prices are currently trading above the psychological level of $3,350, which is providing near-term support for the precious metal.
Following a 2.80% gain on Monday, prices broke above the upper-bound of the symmetrical triangle on the daily chart, supporting a surge in bullish momentum.
However, failure to retest $3,400, the next significant level of resistance required for a potential retest of the April $3,500 all-time high (ATH), limited the upside move.
With the Relative Strength Index (RSI) at 56, the momentum of the trend remains above the 50 neutral level, but is far from technically overbought.
With prices still exhibiting signs of strength, the near-term trajectory may be further influenced by technical levels.
For the upside potential, a break of $3,400 is crucial to reignite the momentum of the uptrend.
On the downside, the upper bound of the triangle aligns with the 10-day Simple Moving Average (SMA) at $3,324, with the $3,300 psychological level just below. At $3,293, the 20-day Simple Moving Average (SMA) is providing an additional layer of support, a break of which could bring the 23.6% Fibonacci retracement level of the January-April move near $3,291.
Gold daily chart
 Chat now!
Add a Comment