

What Goes into RSI?
The Relative Strength Index is going to measure price changes over the past X periods (with X being the input that you can enter into the indicator.)
If you set RSI of 5 periods, it will measure the strength of this candles price movement against the previous 4 (for a total of the last 5 periods). If you use RSI at 55 periods, you will be measuring this candles strength or weakness to the last 54 periods. The more periods you use, the ‘slower’ the indicator will appear to react to recent price changes.
The picture below will show 2 RSI indicators: The top RSI is set with 9 periods, and the bottom at 25 periods. Notice how much more erratic the 9 period RSI is compared to the 25 period version. This is because the indicator is changing so much faster due to the fewer inputs used to calculate its value.
RSI
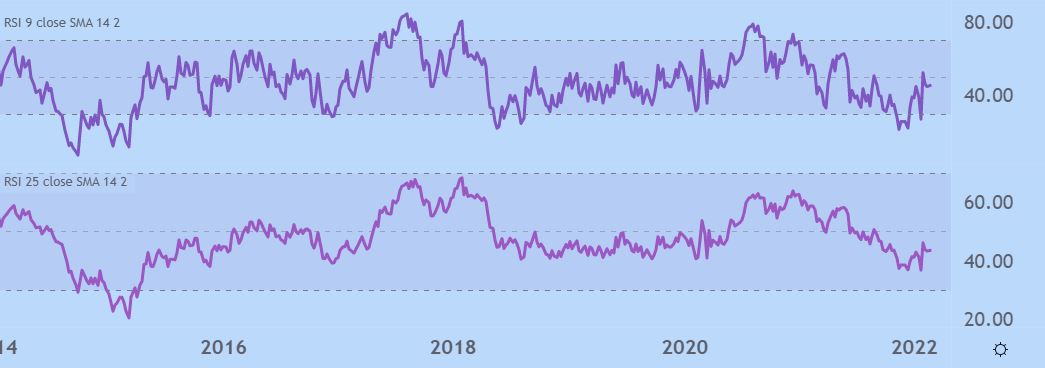
RSI of 25 periods (on bottom) and RSI of 9 periods (above)
What can RSI tell us?
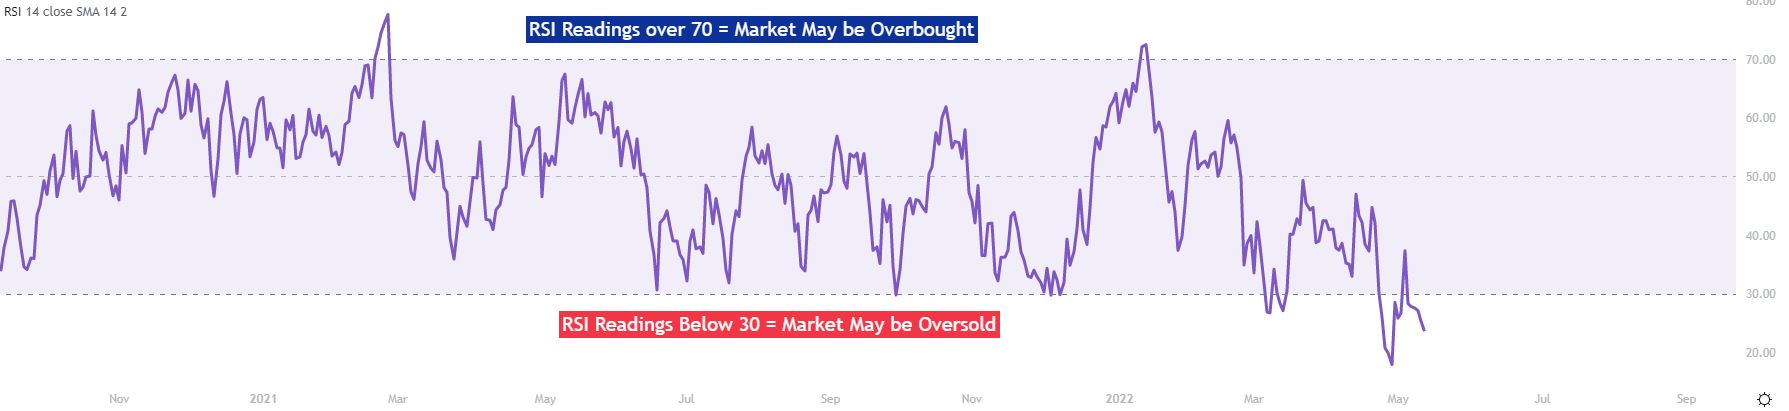
As an oscillator, RSI will read a value between one and 100, and will tell us how strong or weak price has been over the observed number of periods. If RSI is reading below 30, traders will often construe that to mean that price action has been weak, and the asset being charted may be oversold. If RSI is reading above 70, then price action has been strong, and price may potentially be overbought.
I say ‘may’ here as an important qualifier – because a market can get even more overbought or oversold. A market going oversold does not assure of strength nor does an overbought RSI reading denote certain losses.
RSI Oversold, Overbought Readings
Basic Usage of RSI
Because the indicator can show potentially over-bought or over-sold conditions, traders will often take this a step further to look for potential price reversals.
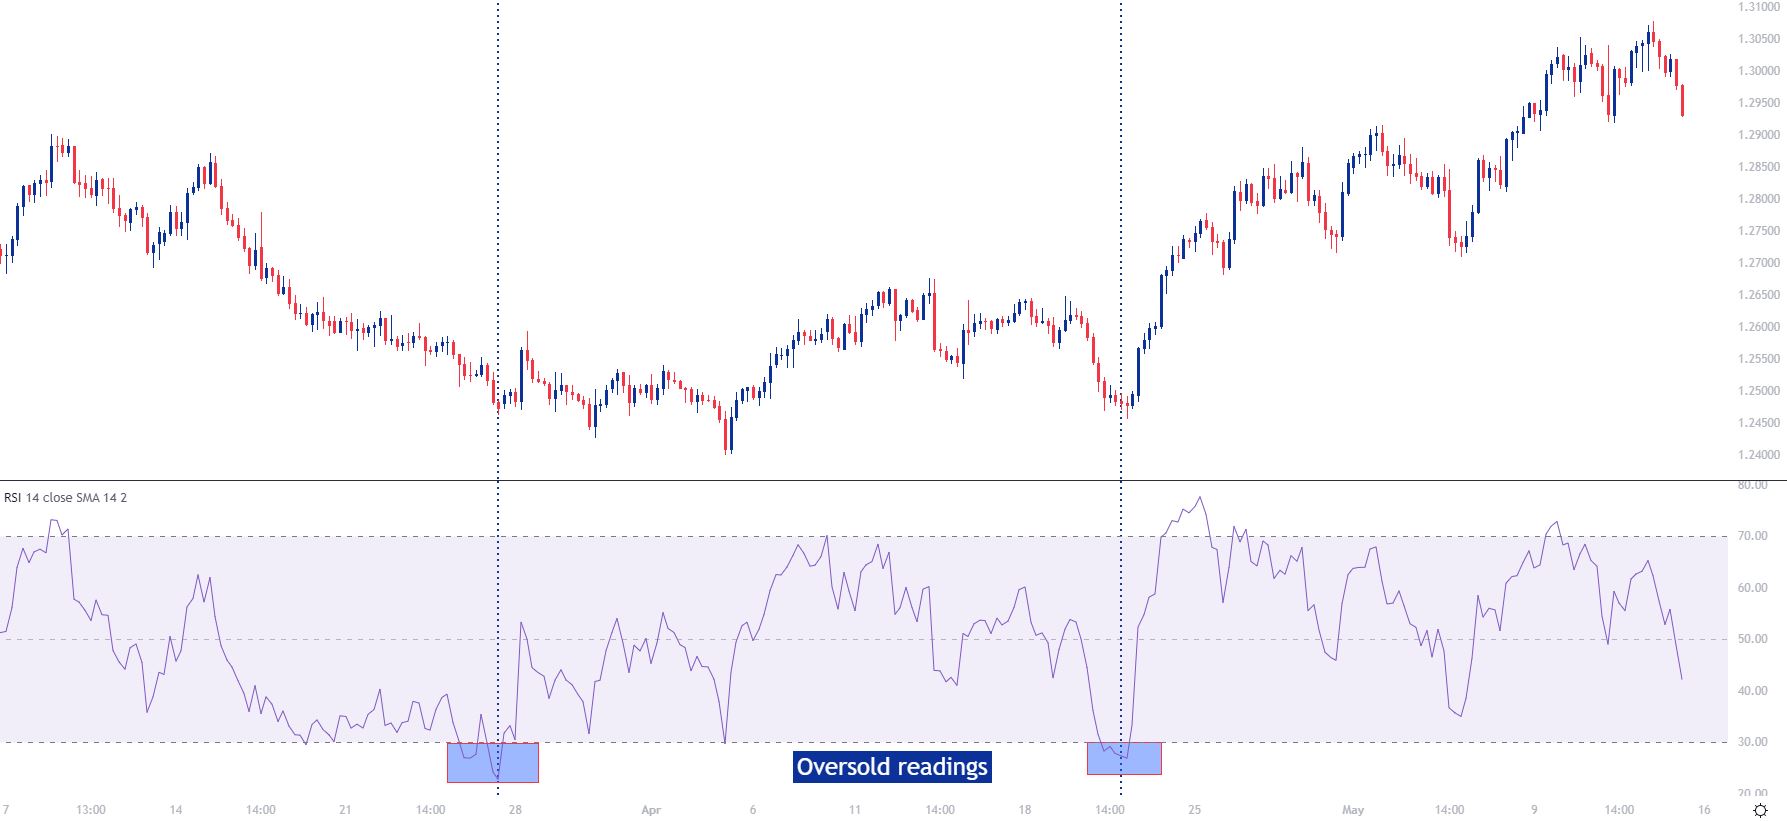
The most basic usage of RSI is looking to buy when price crosses up and over the 30 level, with the thought that price may be moving out of oversold territory with buying strength as price was previously taken too low. The picture below will illustrate further:
RSI Potential to Identify Ranges Across Time Frames
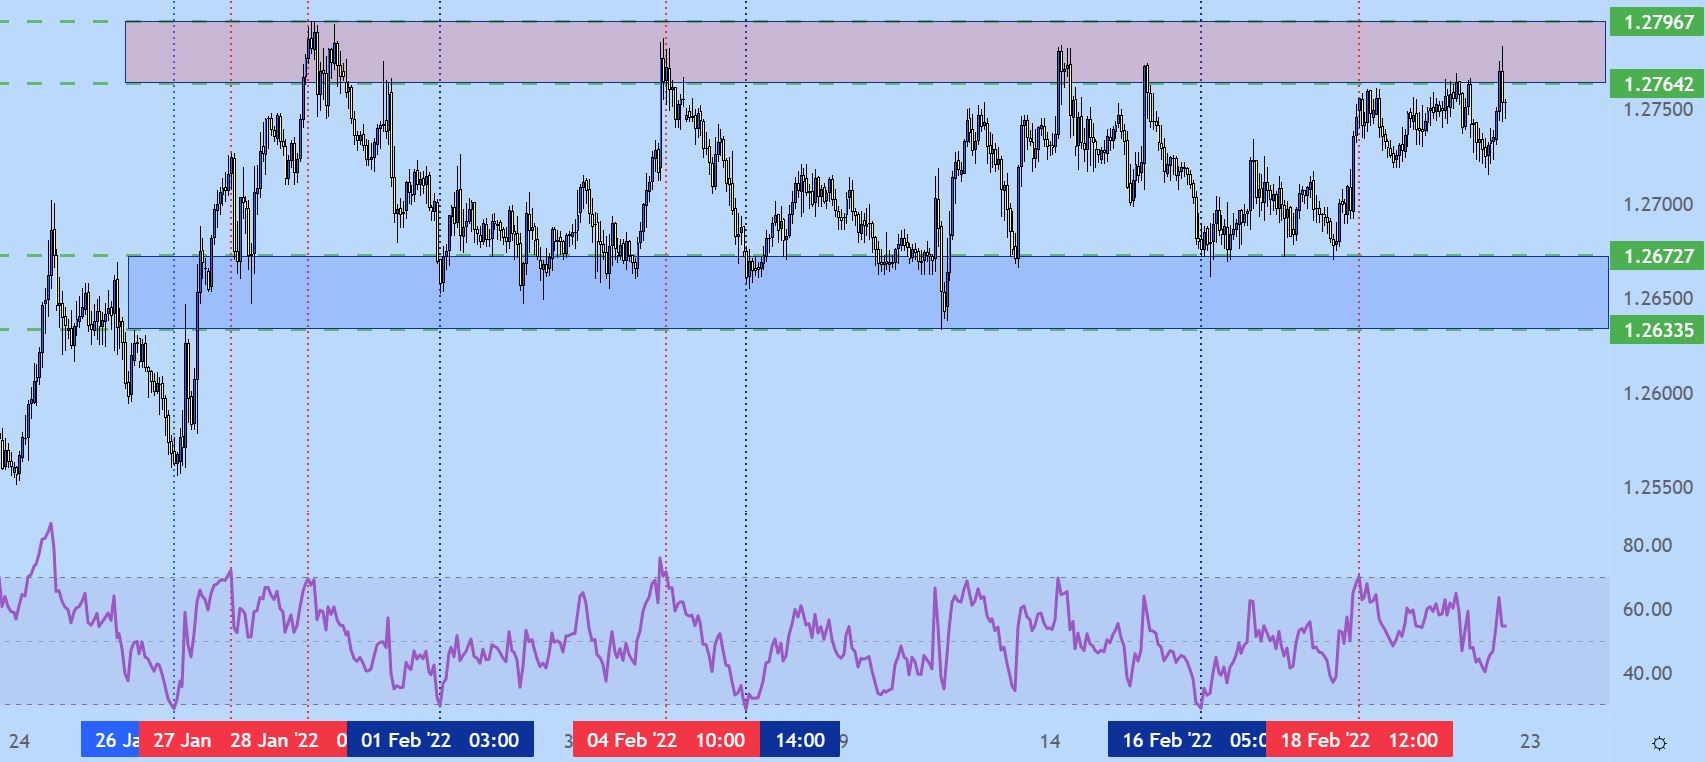
The RSI indicator can be applied on numerous time frames. Like any other indicator built off of past pricing information, it certainly will not be predictive. But, when matched with the appropriate market environment, RSI can be a helpful tool for working with the range-bound market condition on multiple time-frames.
On the below hourly chart of USD/CAD, I’ve identified a number of both long and short signals that appeared while the pair was in the midst of a range-bound environment.
USD/CAD
Pit-falls of Trading with RSI
Inherently, the Relative Strength Index presents a flaw to traders.
RSI, by its nature, looks for reversals in price. By buying when RSI crosses above 30 or ‘over-sold,’ traders are buying a market that has already been going down; inherently a counter-trend trade. And if a trader is selling as RSI crosses below 70, the market has been going up enough to be ‘over-bought’ and the trader is initiating a sell position.
If the market is ranging, this can be a desirable trait in an indicator, as traders can often look to initiate entries in a range with RSI. However, if the market is ranging, the results can be unfavorable as price continues moving in the trending direction, leaving traders that had opened trades in the opposite direction in a compromised position. The picture below will illustrate this situation further on the right side of the chart:
GBP/USD Daily Chart
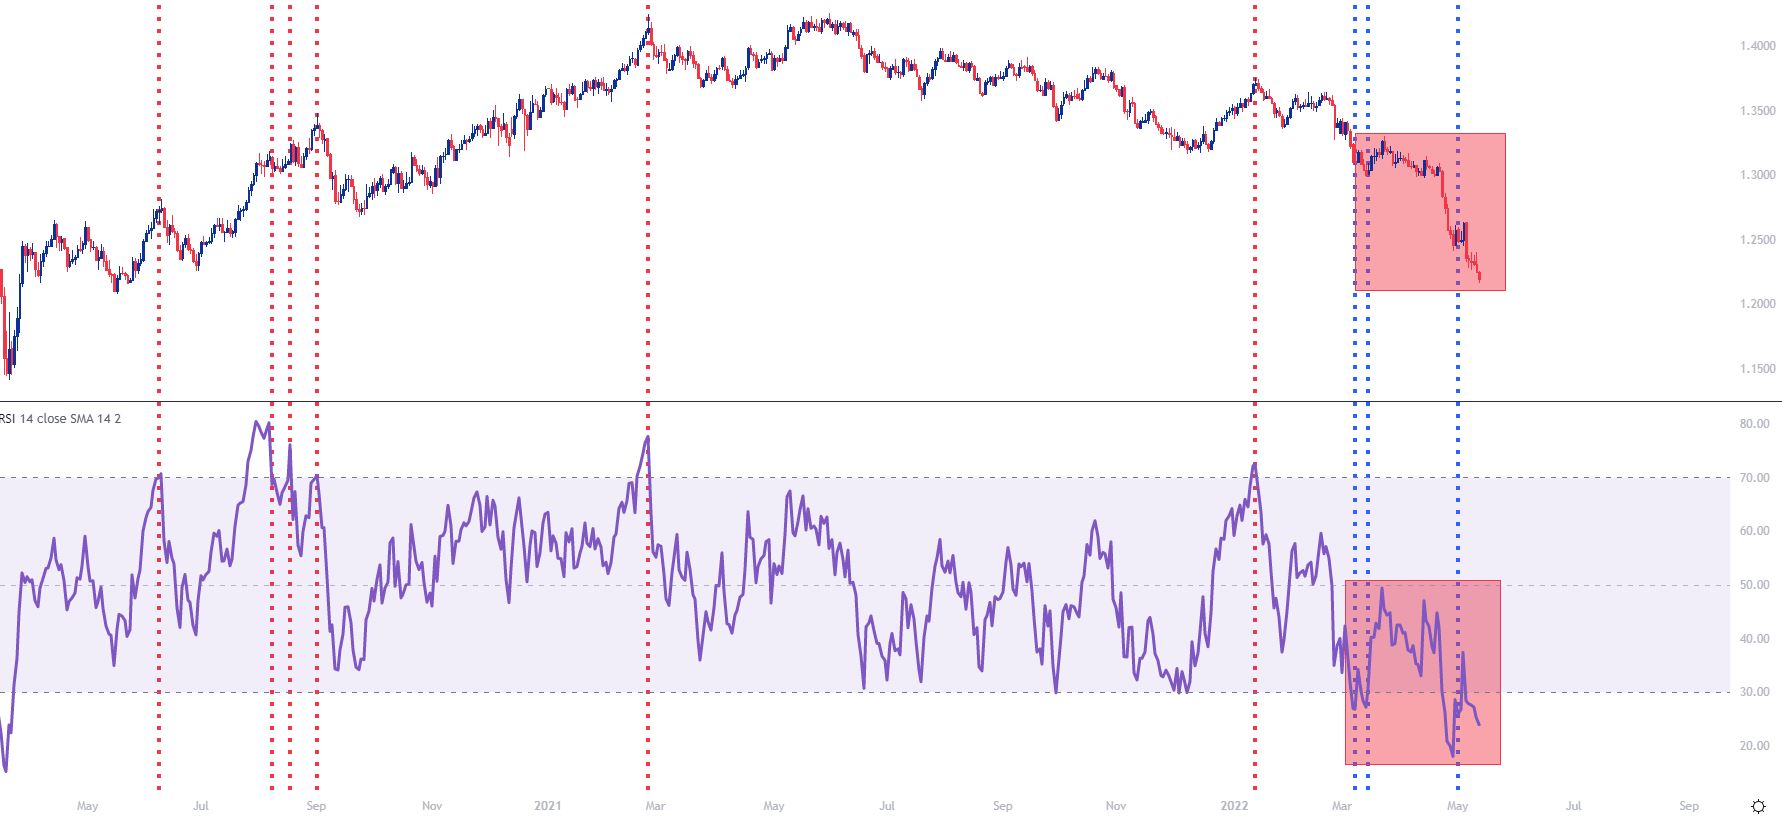
As you can see on the above graphic, there were four sell signals via RSI on the left side of the chart and a fifth towards the middle.
But, on the right side of the chart, there were three bullish signals in a hard down-trending market, none of which would’ve led into a bullish move in the pair.
 Chat now!
Add a Comment