

Quick Fundamental Outlook
Oil prices experienced a decline on Monday, with Brent crude approaching $80 per barrel. This trend occurred as the market anticipated the upcoming OPEC+ meeting, where an agreement to limit supplies into 2024 is expected.
Trading Derivatives carries a high level of risk to your capital and you should only trade with money you can afford to lose. Trading Derivatives may not be suitable for all investors, so please ensure that you fully understand the risks involved, and seek independent advice if necessary. A Product Disclosure Statement (PDS) can be obtained either from this website or on request from our offices and should be considered before entering into a transaction with us. Raw Spread accounts offer spreads from 0.0 pips with a commission charge of USD $3.50 per 100k traded. Standard account offer spreads from 1 pips with no additional commission charges. Spreads on CFD indices start at 0.4 points. The information on this site is not directed at residents in any country or jurisdiction where such distribution or use would be contrary to local law or regulation.
Brent crude futures dropped by 0.5% to $80.16 a barrel, and U.S. West Texas Intermediate (WTI) crude futures decreased by 0.7% to $75.05 a barrel. Despite this decrease, both contracts had registered a slight increase last week, driven by expectations that Saudi Arabia and Russia might extend their supply cuts into early 2024.
The OPEC+ group, after initial delays in reaching consensus on production targets, appears to be moving towards a compromise. This development in oil prices could impact U.S. oil and natural gas markets, potentially influencing energy costs and investment decisions in these sectors.
Natural Gas Price Forecast
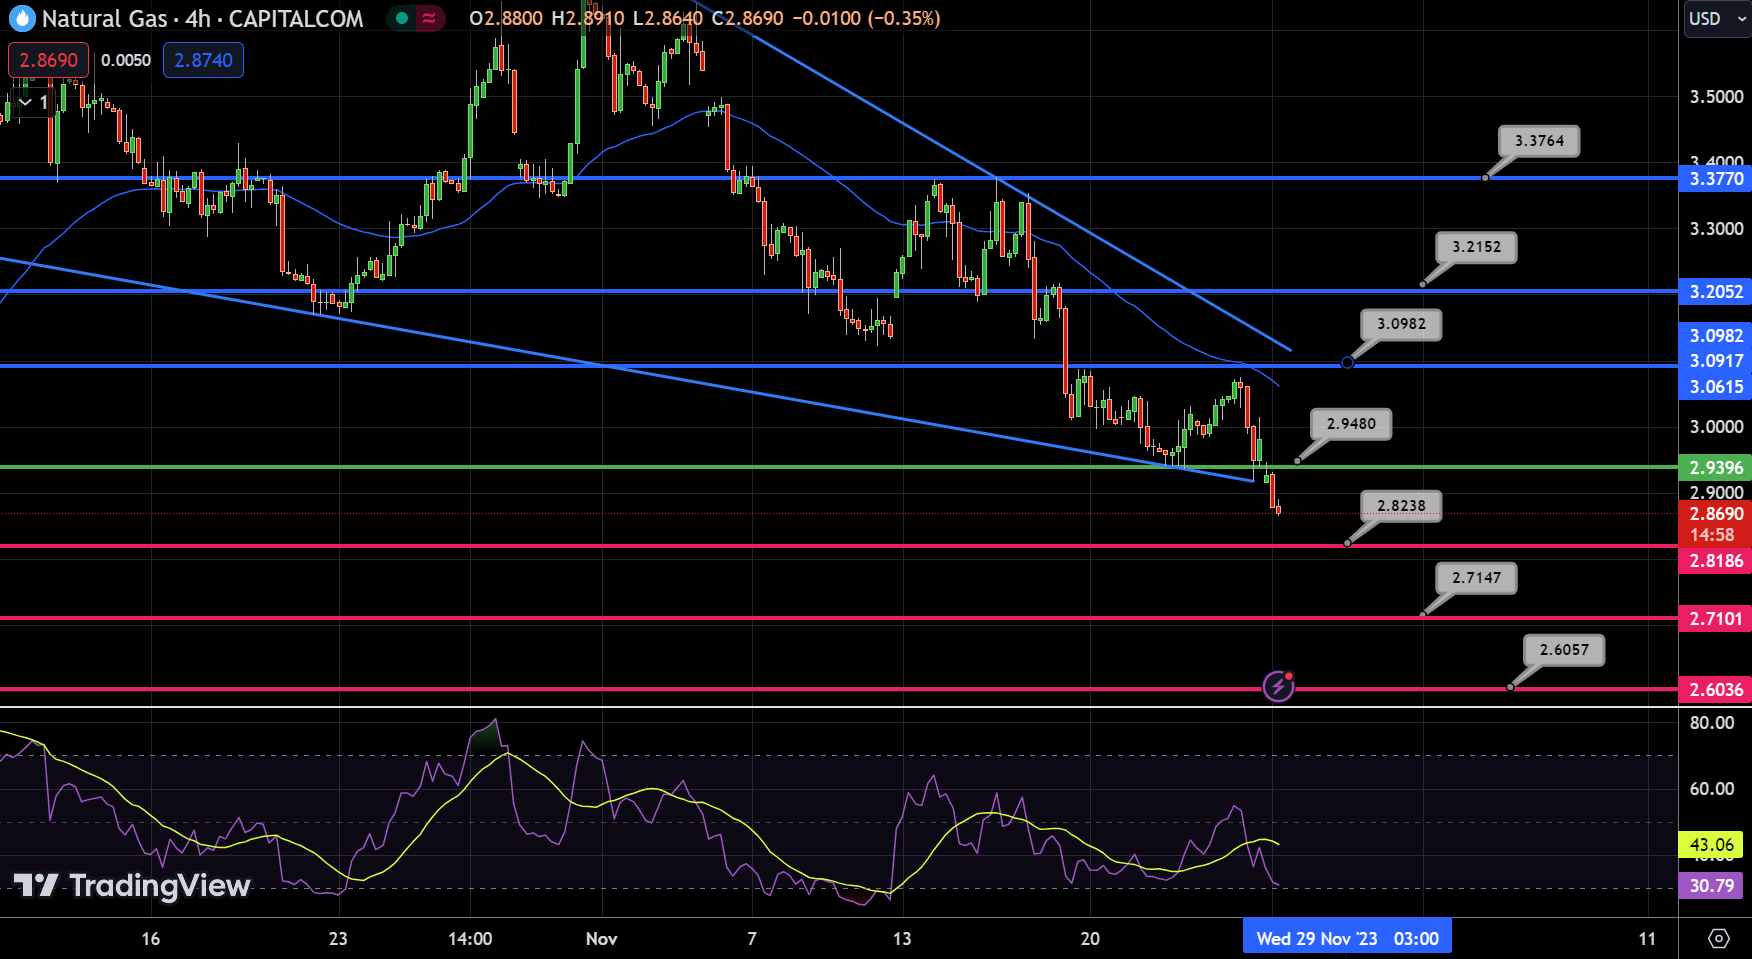
Resistance levels are set at $3.09, $3.21, and $3.37, each posing a challenge for any bullish reversal. Support levels are found at $2.82, $2.71, and $2.60, critical for halting further declines.
The technical indicators reveal a bearish market sentiment. The Relative Strength Index (RSI) is at 30, hovering near the oversold threshold, indicating that the market could be due for a rebound or stabilization.
The Moving Average Convergence Divergence (MACD) shows a value of -0.010, which is below the signal line at -0.030, suggesting the prevailing downward momentum.
Furthermore, the price of Natural Gas is currently below the 50-Day Exponential Moving Average (EMA) of $2.94, reinforcing the bearish outlook. Chart analysis shows a downward trendline breakout at $2.95, indicating potential bearish momentum unless the price can surpass this level.
In summary, the overall trend for Natural Gas is bearish below the $2.95 mark. The short-term expectation is that NG will test the immediate resistance levels, especially at $3.09.
WTI Oil Price Forecast
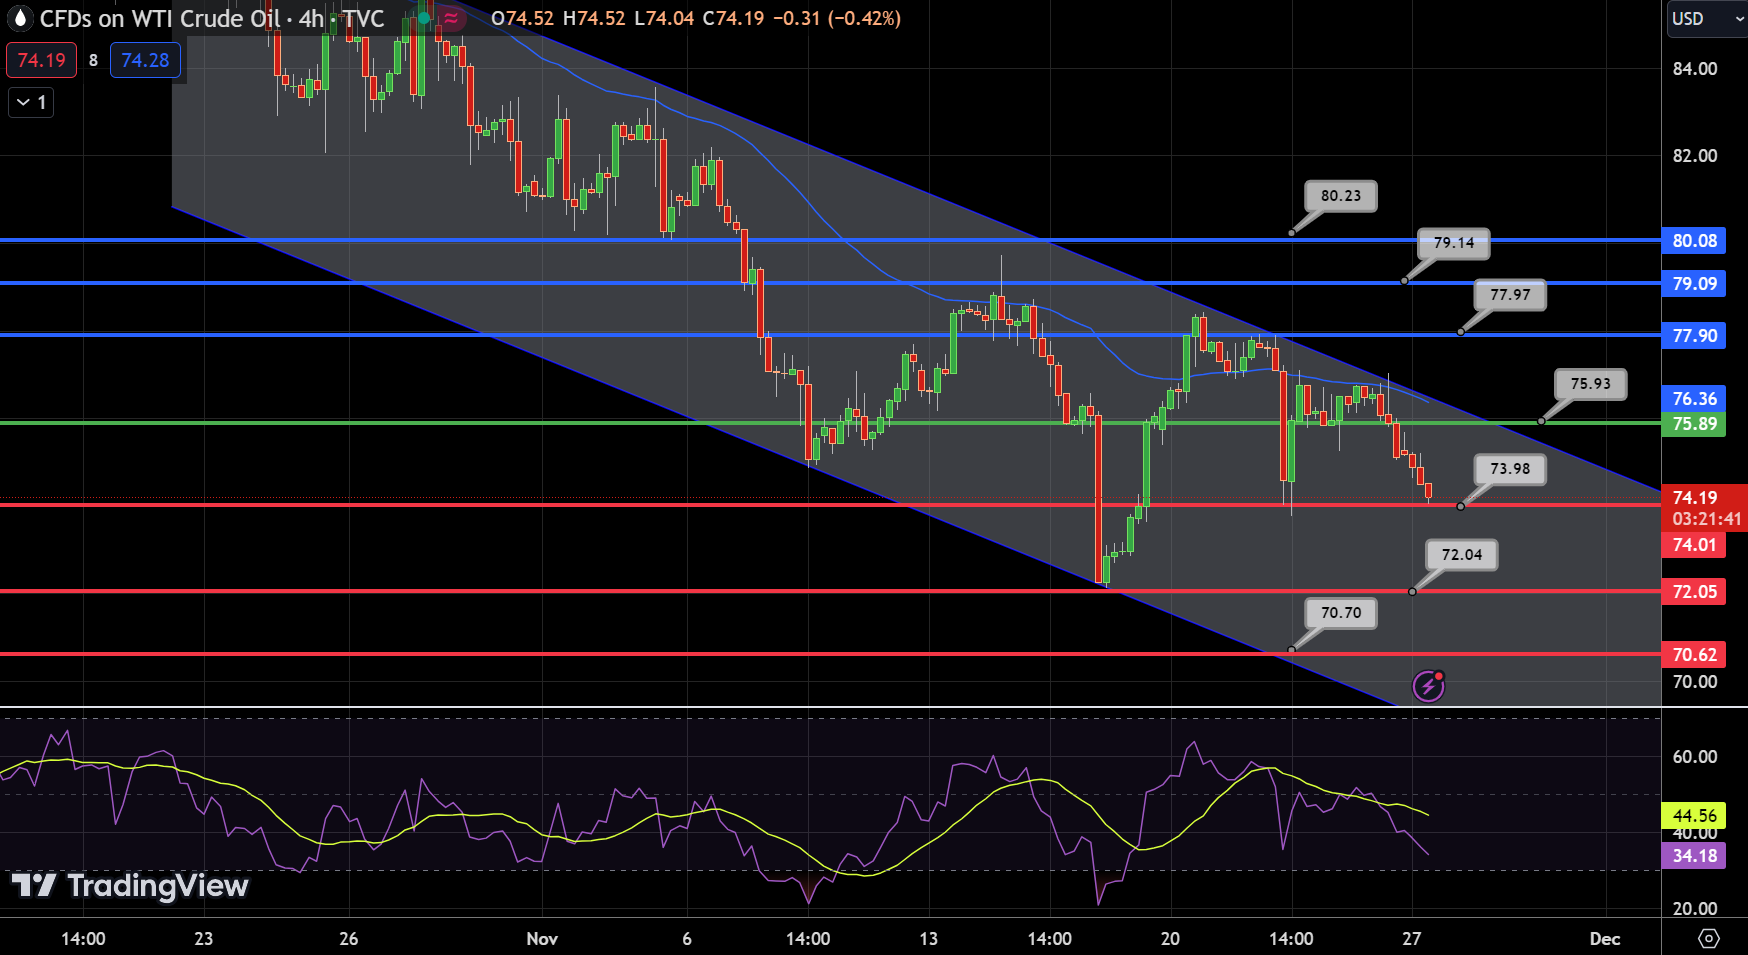
Technical resistances lie at $77.97, $79.14, and $80.23, challenging any upward momentum. Conversely, support levels are marked at $73.98, $72.04, and $70.70, providing potential floors for further drops.
The Relative Strength Index (RSI) is at 34, suggesting a bearish market trend without hitting the oversold territory. The Moving Average Convergence Divergence (MACD) presents a negative value of -0.230, diverging from its signal line at -0.500, indicating a downward momentum.
This is corroborated by the asset trading below the 50-Day Exponential Moving Average (EMA) of $75.17, further reinforcing the short-term bearish outlook.
Chart patterns reveal a downward trendline, suggesting a continuation of the bearish trend unless a significant reversal occurs. The overall sentiment for US Oil remains bearish below the crucial level of $75.95.
In summary, the short-term forecast for US Oil anticipates testing lower support levels, particularly at $73.98. The market appears to be in a cautious state, with potential for further declines unless a significant bullish stimulus emerges.
Brent Oil Price Forecast
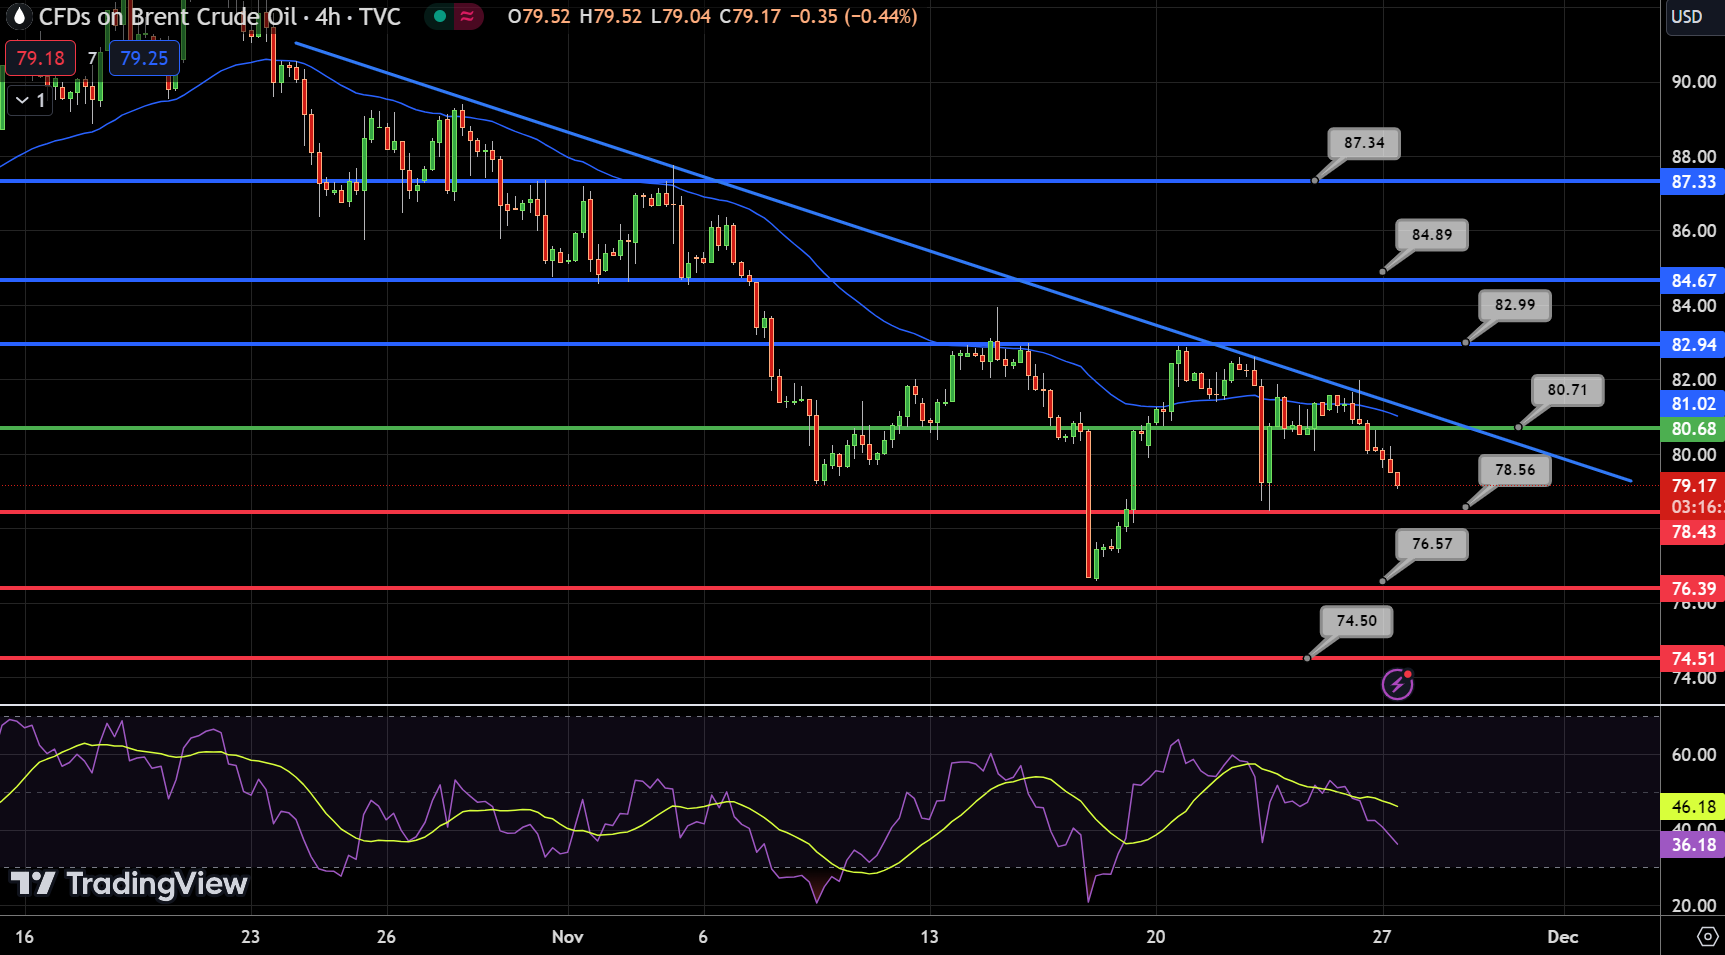
The immediate resistance levels are identified at $82.99, $84.89, and $87.34, presenting substantial hurdles to any upward price movement. On the flip side, support levels are observed at $78.56, $76.57, and $74.50, crucial for halting any further declines in price.
The Relative Strength Index (RSI) stands at 36, indicating a bearish market sentiment without yet reaching oversold conditions. The Moving Average Convergence Divergence (MACD) shows a negative trend with a value of -0.22, suggesting a bearish momentum as it remains below the signal line of -0.39. Additionally, the current price is below the 50-Day Exponential Moving Average (EMA) of $80.09, reinforcing the bearish trend.
Chart analysis reveals a downward trendline extending resistance at $80.70, implying a sustained bearish outlook unless the price can breach this resistance.
In conclusion, the overall trend for UK Oil is bearish below the $80.70 level. The short-term forecast anticipates a test of the immediate resistance levels, particularly at $82.99.
 Chat now!
Add a Comment