

Natural Gas Storage and Outlook
Natural gas futures remained stable as market participants anticipate the release of the government’s weekly storage data. Forecasts suggest an increase in storage, with NatGasWeather predicting a build of +84 Bcf, slightly more than the survey average of +79-82 Bcf, and notably above the 5-year average build of +66 Bcf. The U.S. Energy Information Administration (EIA) will report its figures at 14:30 GMT.
Market Dynamics and Speculation
Wednesday saw U.S. natural gas futures surge by approximately 1%, marking a week’s high. This uptrend can be attributed to the looming colder weather, increased heating demand, and bullish price speculations from the options market. The front-month gas futures for November on the NYMEX experienced a substantial increase, drawing closer to the significant $3 per mmBtu level. Market dynamics suggest a drive by certain firms to keep the November front-month over $3 per mmBtu as the options expire.
Trading Derivatives carries a high level of risk to your capital and you should only trade with money you can afford to lose. Trading Derivatives may not be suitable for all investors, so please ensure that you fully understand the risks involved, and seek independent advice if necessary. A Product Disclosure Statement (PDS) can be obtained either from this website or on request from our offices and should be considered before entering into a transaction with us. Raw Spread accounts offer spreads from 0.0 pips with a commission charge of USD $3.50 per 100k traded. Standard account offer spreads from 1 pips with no additional commission charges. Spreads on CFD indices start at 0.4 points. The information on this site is not directed at residents in any country or jurisdiction where such distribution or use would be contrary to local law or regulation.
Volatility and Spot Prices
Historic daily volatility witnessed peaks and troughs, reaching an all-time high in February 2022 and dropping to its lowest in September 2021. A contributing factor to the suppression of futures price gains has been the decreasing spot prices at the Henry Hub benchmark in Louisiana, which has predominantly been trading below front-month futures this year.
Supply, Demand, and Exports
October saw an elevation in the average gas output in the Lower 48 U.S. states. With winter approaching, it’s anticipated that the cooler season will drive demand. LSEG’s predictions show an increase in U.S. gas demand for the upcoming week. Exports to Mexico are expected to ascend once the New Fortress Energy’s Altamira plant begins operations in November.
Forecast
Considering the imminent cooler weather and rising demand, the short-term perspective for natural gas appears bullish. The U.S. is poised to emerge as the top global LNG supplier by 2023. The European and Asian markets mirror this optimistic outlook, with gas prices hovering around $16 per mmBtu in Europe and $18 per mmBtu in Asia. The international arena, especially supply disruptions linked to the Ukraine situation, is set to play a pivotal role in influencing U.S. exports.
Technical Analysis
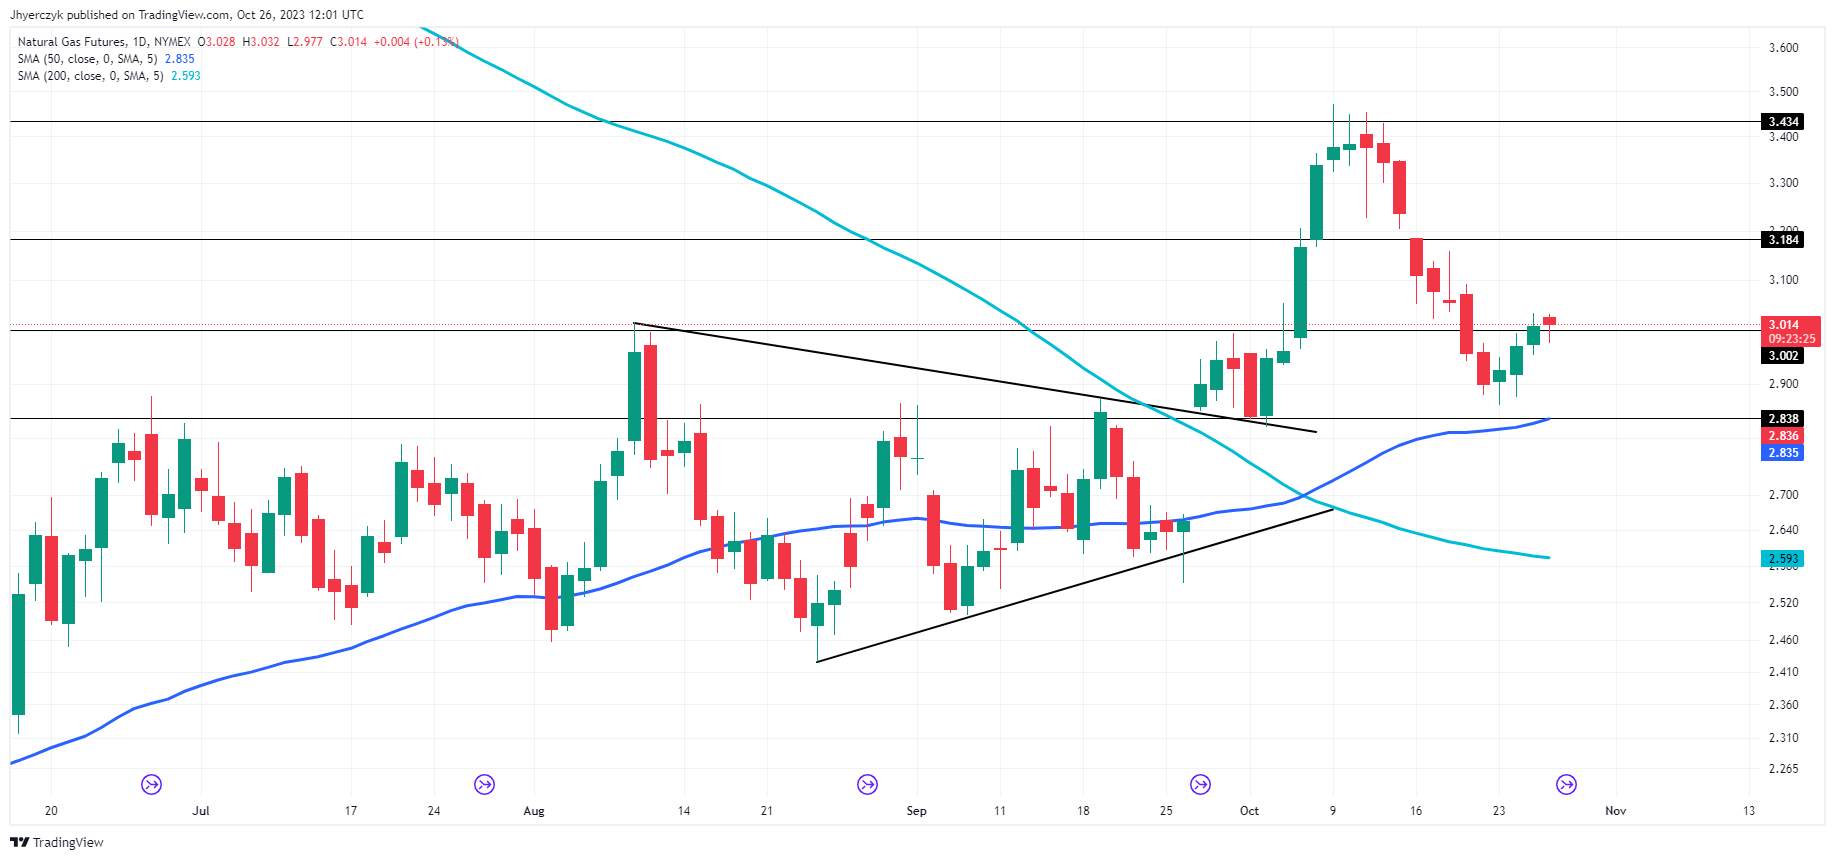
The asset’s position above these key moving averages is a positive sign for traders and suggests sustained upward strength. Furthermore, the price is closely hugging the minor support at 3.002, suggesting a potential pivot point.
With minor resistance at 3.184 and a stronger ceiling at 3.434, any upward movement can face these challenges. Conversely, the main support level at 2.838 acts as a crucial floor for prices in case of a reversal.
 Chat now!
Add a Comment