
Businesses and investors utilize risk management ratios, a collection of financial measurements, to evaluate and manage different kinds of risk, such as credit, market, and financial risk. The ratios evaluate a business’s overall stability, performance, and financial health to assess its capacity to fulfill commitments and expand in a sustainable manner. Risk management ratios fall into various categories, each of which focuses on a certain facet of a business’s financial situation.
Liquidity ratios
Liquidity ratios measure a company’s ability to cover its short-term financial obligations with its current, or most liquid, assets.
- Current Ratio: Compares a company’s current assets to its current liabilities. A ratio greater than 1 suggests good short-term financial health.
- Formula:
Current AssetsCurrent Liabilitiesthe fraction with numerator Current Assets and denominator Current Liabilities end-fraction
Current AssetsCurrent Liabilities
- Formula:
- Quick Ratio: Also known as the acid-test ratio, it is a stricter measure of liquidity. It excludes less liquid assets, such as inventory and prepaid expenses, from the calculation.
- Formula:
Current Assets – InventoryCurrent Liabilitiesthe fraction with numerator Current Assets – Inventory and denominator Current Liabilities end-fraction
Current Assets – InventoryCurrent Liabilities
- Formula:
- Cash Ratio: A more conservative measure of liquidity that assesses a company’s ability to cover short-term debt using only cash and cash equivalents.
- Formula:
Cash and Cash EquivalentsCurrent Liabilitiesthe fraction with numerator Cash and Cash Equivalents and denominator Current Liabilities end-fraction
Cash and Cash EquivalentsCurrent Liabilities
- Formula:

Leverage and solvency ratios
These ratios evaluate a company’s long-term financial structure and its ability to meet its long-term debt obligations.
- Debt-to-Equity (D/E) Ratio: Compares a company’s total debt to its total shareholder equity. A higher ratio indicates that a company relies heavily on debt for financing, which increases financial risk.
- Formula:
Total DebtTotal Equitythe fraction with numerator Total Debt and denominator Total Equity end-fraction
Total DebtTotal Equity
- Formula:
- Debt-to-Capital Ratio: Measures the proportion of a company’s total capital (debt and equity) that is financed by debt. A lower ratio is generally preferred.
- Formula:
Total DebtTotal Debt + Total Shareholders′ Equitythe fraction with numerator Total Debt and denominator Total Debt + Total Shareholders prime Equity end-fraction
Total DebtTotal Debt + Total Shareholders′ Equity
- Formula:
- Interest Coverage Ratio: Also called the “times interest earned ratio,” this shows how many times a company’s earnings before interest and taxes (EBIT) can cover its interest expenses. A low ratio can signal potential financial problems.
- Formula:
EBITInterest Expensesthe fraction with numerator EBIT and denominator Interest Expenses end-fraction
EBITInterest Expenses
- Formula:
Risk-adjusted return ratios
For investors, these ratios assess how much return is generated for each unit of risk taken, allowing for comparisons between different investments.
- Sharpe Ratio: Measures the performance of an investment by adjusting for its risk. It calculates the excess return per unit of standard deviation (total risk). A higher ratio is better.
- Formula:
Return of Portfolio – Risk-Free RateStandard Deviation of Portfolio′s Excess Returnthe fraction with numerator Return of Portfolio – Risk-Free Rate and denominator Standard Deviation of Portfolio prime s Excess Return end-fraction
Return of Portfolio – Risk-Free RateStandard Deviation of Portfolio′s Excess Return
- Formula:
- Sortino Ratio: Similar to the Sharpe ratio, but focuses only on downside risk, or negative volatility. It’s often preferred by investors who are less concerned with upside volatility.
- Formula:
Return of Portfolio – Risk-Free RateStandard Deviation of Negative Asset Returnsthe fraction with numerator Return of Portfolio – Risk-Free Rate and denominator Standard Deviation of Negative Asset Returns end-fraction
Return of Portfolio – Risk-Free RateStandard Deviation of Negative Asset Returns
- Formula:
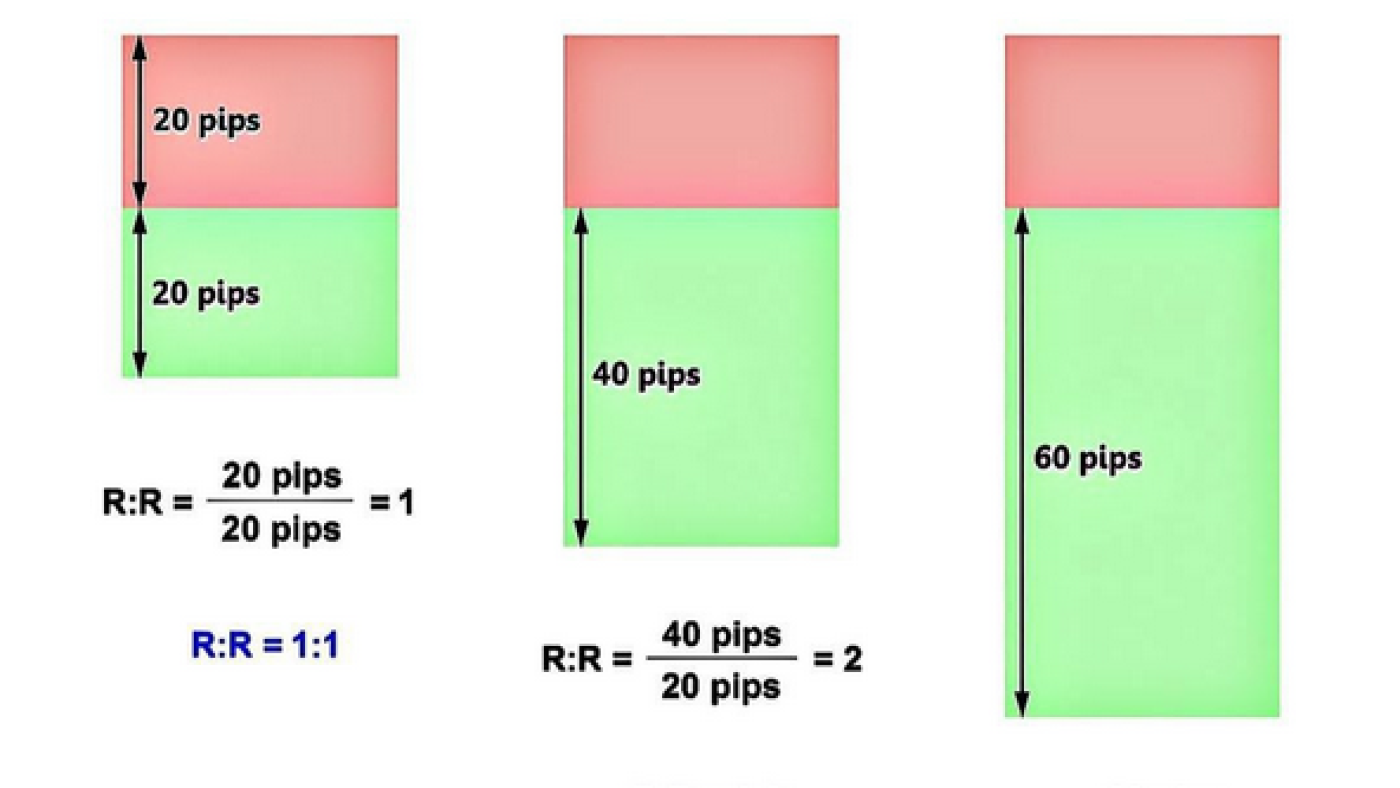
- Risk/Reward Ratio: Compares the potential profit of a trade to its potential loss. For example, a 1:3 ratio means the potential profit is three times the potential loss.
- Formula:
Potential LossPotential Gainthe fraction with numerator Potential Loss and denominator Potential Gain end-fraction
Potential LossPotential Gain Other important risk measures
- Formula:
Beyond traditional financial ratios, other metrics provide a more comprehensive view of risk.
- Beta: Measures a stock’s volatility in relation to the overall market. A beta of 1 indicates the stock’s price moves with the market, while a beta over 1 is more volatile.
- Standard Deviation: A statistical measure used to quantify the amount of variation or dispersion of an investment’s returns around its average return.
- Value at Risk (VaR): A statistical technique used to estimate the potential loss of a portfolio over a specific time period with a given level of confidence.
 Chat now!
Add a Comment