

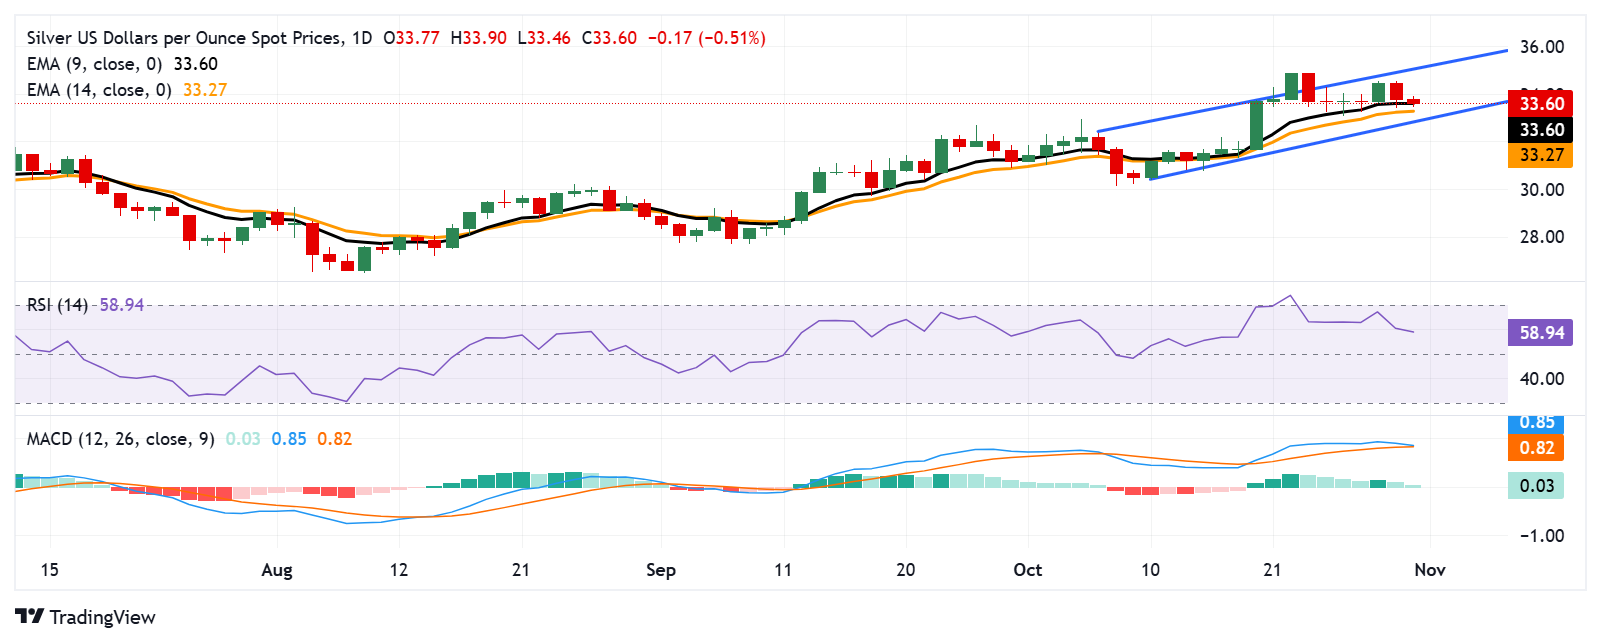
Silver price (XAG/USD) continues to decline, trading at around $33.60 during the European session on Thursday. Analysis of the daily chart indicates a bullish bias, as Silver price consolidates within an ascending channel.
Furthermore, the 14-day Relative Strength Index (RSI) remains above the 50 mark, supporting the prevailing bullish outlook. However, a decline below 50 could signal a shift toward bearish sentiment.
However, the Moving Average Convergence Divergence (MACD) line is positioned above the signal line, indicating a potential bearish signal. A bearish crossover could suggest a shift in momentum from bullish to bearish, signaling a possible sell opportunity. Nonetheless, since both lines remain above the centerline (zero line), this suggests that the overall trend remains bullish.
On the upside, the Silver price may target the psychological level of $35.00, followed by the upper boundary of the ascending channel at $35.10. A breakout above this level could propel the price of the grey metal toward the psychological level of $36.00.
Regarding support, Silver price is testing the nine-day Exponential Moving Average (EMA) at $33.60, with the 14-day EMA at $33.27 serving as the next support level. A drop below this latter level could increase selling pressure, potentially pushing XAG/USD down to the lower boundary of the ascending channel around the psychological level of $33.00.
XAG/USD: Daily Chart
 Chat now!
Add a Comment