

Overview
Silver (XAG/USD) is showing resilience by maintaining this week’s multi-month low, indicating potential oversold conditions or that negative Federal Reserve news might be fully priced in. In contrast, gold prices are undergoing a testing phase, hovering near a 5-month low as the U.S. dollar and Treasury yields surge, driven by positive economic data. This development reinforces expectations of the Federal Reserve’s continuous policy tightening.
Fed’s Inflation Concerns
Following the July meeting, policymakers remain committed to addressing inflation concerns, acknowledging the risks associated with aggressive rate hikes. Despite 11 rate hikes since March 2022, inflation worries persist, potentially leading to further monetary tightening.
Trading Derivatives carries a high level of risk to your capital and you should only trade with money you can afford to lose. Trading Derivatives may not be suitable for all investors, so please ensure that you fully understand the risks involved, and seek independent advice if necessary. A Product Disclosure Statement (PDS) can be obtained either from this website or on request from our offices and should be considered before entering into a transaction with us. Raw Spread accounts offer spreads from 0.0 pips with a commission charge of USD $3.50 per 100k traded. Standard account offer spreads from 1 pips with no additional commission charges. Spreads on CFD indices start at 0.4 points. The information on this site is not directed at residents in any country or jurisdiction where such distribution or use would be contrary to local law or regulation.
10-Year Treasury Hits 10-Month High
As benchmark 10-year U.S. Treasury yields reach a 10-month high and the dollar rises to mid-June levels, gold is affected, though silver appears relatively unaffected today. Fed meeting minutes signaled more rate hikes, hinting at potential yield spikes. Spot silver (XAG/USD) remains relatively stable, albeit cautiously.
Silver Still Vulneable if Support Zone Fails
Amid rising yields and dollar strength, spot silver could face a decline towards $22.00 per ounce after breaking crucial support levels. U.S. yield and dollar index levels will likely influence market sentiment, possibly marking a significant turning point. Analysts anticipate silver price volatility, particularly driven by U.S. rate-related commentary.
Long-Term Direction Hinges Upon Timing of Fed Rate Cuts
Silver’s potential upside hinges on anticipated rate cuts in 2024. Despite robust U.S. economic data defying recession predictions, silver’s safe-haven appeal wanes, reflecting reduced investor interest during economic uncertainty.
Short-Term Outlook: Set-up for Short-Covering Rally
In conclusion, while silver diverges from gold’s trajectory, it remains uncertain whether this signifies the beginning of a substantial short-covering rally. A significant rally isn’t expected given rising yields and a strengthening dollar, along with uncertainty surrounding the Fed’s upcoming rate decision in September.
The Federal Reserve’s cautious stance on inflation and ongoing rate hikes will shape the current silver and gold market landscape. Both metals face pressure from increasing yields, yet the possibility of rate cuts in 2024 could serve as a catalyst for price rebounds, making silver particularly attractive to long-term speculators.
Technical Analysis
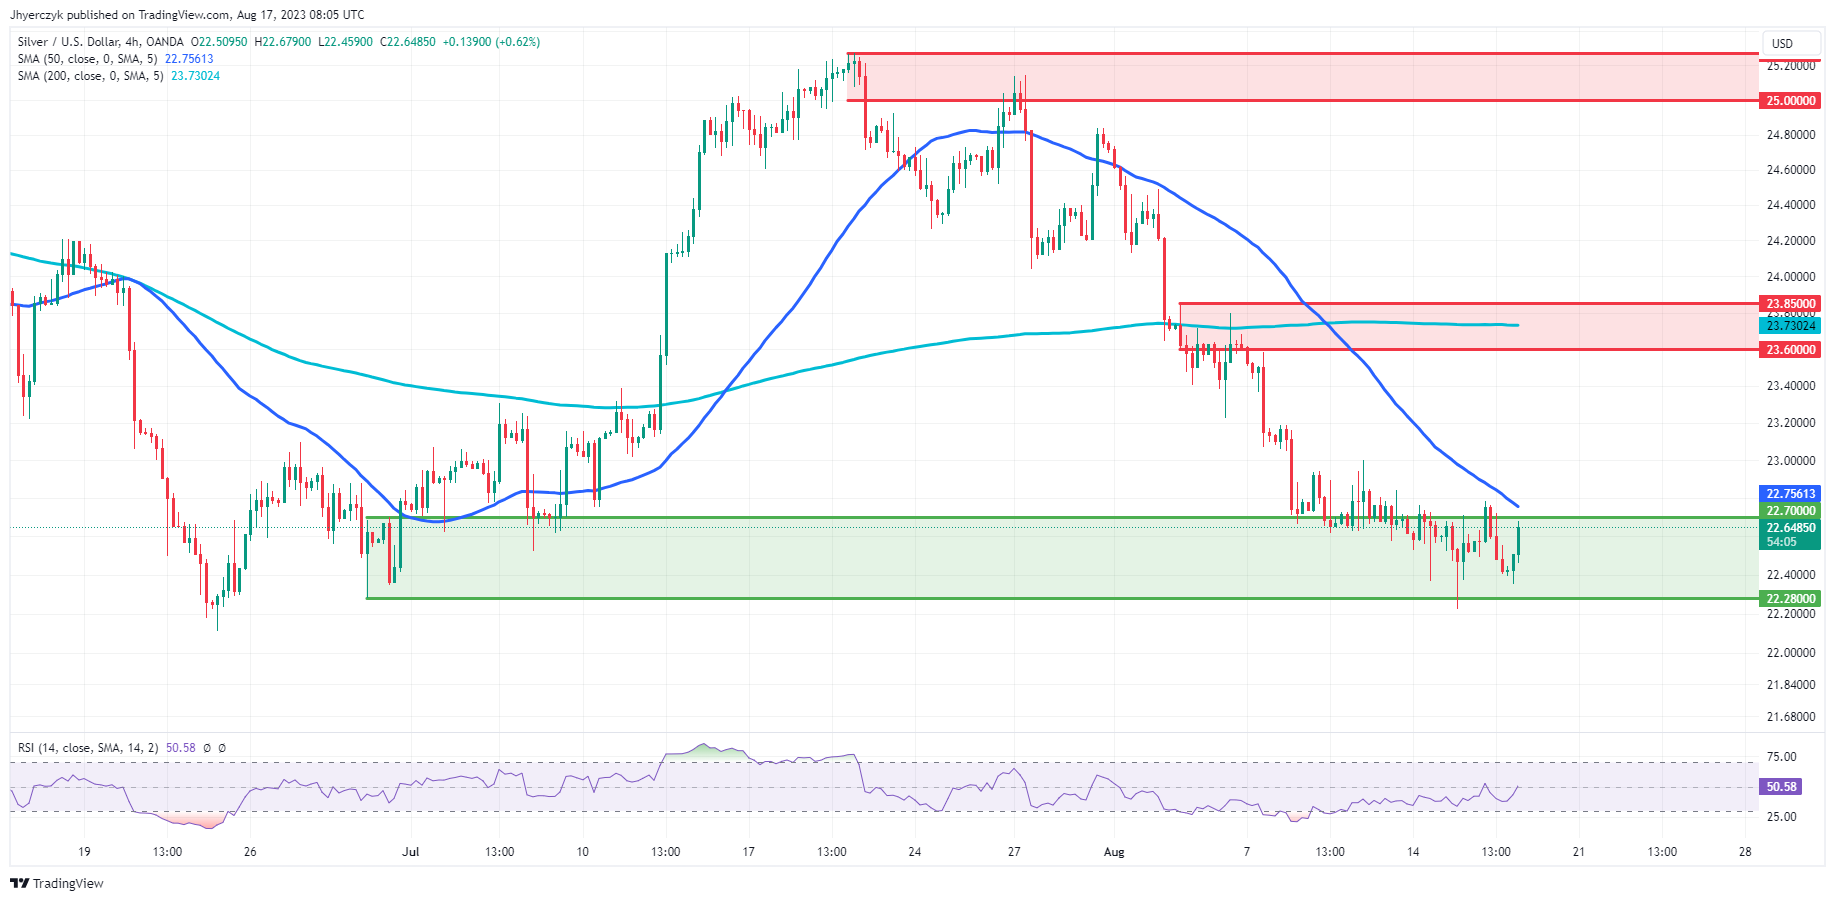
Silver’s current price aligns with the main support area of 22.70 to 22.28, suggesting a stabilizing effect. The main resistance area of 23.60 to 23.85 indicates potential hurdles for price advancement. Given the proximity to both moving averages and the neutral RSI, the market sentiment appears cautious. Overall, considering the support and resistance levels, the market sentiment remains neutral.
All eyes are on the 50-4H moving average at 22.76. This is a potential trigger point for an acceleration to the upside on the 4-hour chart.
 Chat now!
Add a Comment