
What is Multi-Timeframe Analysis?
To quickly understand how the multi-timeframe strategy works, let’s look at the most popular option, the intraday trading strategy on 30M, 15M and 5M timeframes.

To determine the entry point into the market, you need to consider several charts and timeframes, and assess the market conditions from top to bottom. That is, from the largest time frame to the smallest.
Identifying trends and market entries will not take more than a few minutes. If the current trend is in the same direction on all three time frames, this is a good opportunity to open a trade. The most effective trades will be when the trend reverses, especially if all three charts confirm it.
Rule 1 – Determine Main Trend
First of all, identify the primary trend (developing over 2-3 days) on the highest of the time frames we are considering. Remember that only the long-term time frame shows the macro trend. Trading against the macrotrend is dangerous and often leads to losses.

Chart shows two main trends, downward and sideways. The downtrend is global and has been developing for a long time. Let’s study the sideways trend. The good thing about it is that it is easy to determine its borders (support and resistance lines). Traders should start trading from these lines.
So, the main trend is flat. The price is located at its upper border. In this situation, the price can either break out the resistance line and go up, breaking the trend, or reverse and continue the trend. It is the reversal that is most interesting, since it supports the current trend, which means such a trade is the safest.
Rule 2 – Determine Current Market Bias
Next, you need to determine the current trend. The next timeframe signals to us the medium-term bias. If the global one indicates a trend of 2-3 days, then the current one shows changes within the day.

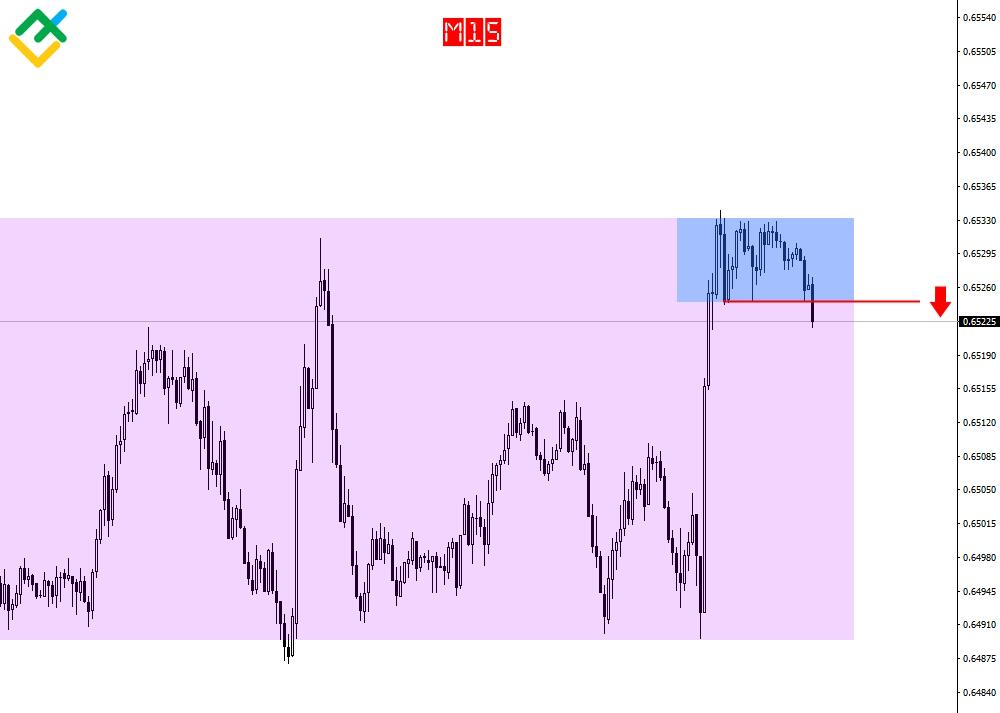
The current trend on the lower time frame confirms the direction of the intraday movement. The chart shows a confirmation of a possible reversal at the resistance line. The price is attempting to exit the local sideways channel and has already crossed the lows of the daily trend. 30M and 15M timeframes are not very different from each other, and, as a rule, the color of the candles on them will be the same.
When trading on three timeframes, traders use a candlestick chart, which helps them quickly determine the trend by comparing the color of the last candles on different timeframes.
On M30 and M15, the last candles are black, which means the trend direction is the same. Thus, the M15 fully confirms the reversal trend from the larger time frame.
Rule 3 – Determine Entry and Exit
Once the current trend is confirmed, switch to short-term charts to identify good entry and exit points for the trade. A signal to enter the market will be the same colors of the last candles on all three timeframes, as well as a trend reversal. In our case, this is a breakout of the local channel support line.

It is better to enter a trade on the smallest time frame, since high time frames do not provide the necessary price accuracy. After receiving all confirmations, you can open a sell trade.
Determine the exact entry and exit points based on risk management rules. A sell trade can be opened immediately after the signal is confirmed, and it is better to exit the trade at the take profit level. In this situation, it is logical to set it around the support line of the global channel on the M30 timeframe. It is better to set the stop loss level above the resistance line of the global channel.
Trading 3 Timeframes in Forex Market
There are a lot of different strategies in modern technical analysis, and sometimes traders forget that the simplest ones are the most effective. Trading on three time frames is a powerful trading strategy that allows traders to make profits with minimal time investment.

Trading on three timeframes is divided into:
- Long-term. The average trade duration exceeds a week or even a month.
- Medium term. The trade duration ranges from several days to one week.
- Short term. Traders open trades within shorter timeframes, without moving on to the next day.
The most popular time frame is the daily chart, as it allows traders to make trading decisions without haste. The higher the timeframe, the easier it is to focus on trading management. The more time you have, the greater the trade’s security. Also, all dominant trends are clearly visible on the daily chart.
When trading three time frames, use the three rules below:
- Don’t trade against the global trend.
- Enter trades only if all the last candles on three timeframes are the same color.
- Do not open trades if there is high volatility in the market.
Best Timeframe Combinations
Now that you know how to use three timeframes in trading, let’s consider the combinations of timeframes that most traders commonly use.

- The most popular is the combination of M30, M15 and M5. Statistically, this combination allows traders to maintain a good balance between the number of trades and profitability.
- The second most popular is long-term trading on D1, 4-hour and H1 timeframes. This combination allows traders to ideally follow the rules of money management, but involves fewer trades over the period due to the duration exceeding a week.
- Trading on H1, M30 and M15 is well-balanced in terms of trade duration and money management. This combination allows traders to open trades ranging from several hours to one day and effectively utilize risk management techniques such as trailing stops.
Use different combinations to find the perfect one for you. Sometimes, traders even use M1 in search of the best entry points. However, you cannot use too large gaps between timeframes in trading. There is a sufficient gap between M1 and D1 for the strategy to not work. I don’t recommend setting a gap of more than five candles between timeframes.
Indicators for Trading with Multiple Timeframes

Choosing the best timeframe combination is only part of future success. The main thing is to determine the exact entry and exit points. Above, we considered an example with an entry based on the theory of resistance and support. But the most popular method is indicator analysis. According to this method, traders can use technical indicators, from basic moving averages to complex oscillators such as RSI, CCI, and Stochastic.
The figure above shows trading on M30, M15, M5 time frames using the basic setup of three exponential moving averages (EMA). The principle of operation of such a strategy is described below:
- Apply three Moving Average indicators with basic parameters and periods of 21,13 and 8 on three time frames. Mark the slowest in blue, the average in red, and the fastest in green.
- Blue will be the signal one. After it is broken out by the other two, a trade will be opened.
- Wait for two fast EMAs to cross the signal one on all three timeframes.
- Crossing from top to bottom is a sell signal, and from bottom to top is a buy signal. In our case, this is a sell signal.
- After receiving the signal, open a sell trade.
- When there is a reverse cross on the M5 timeframe, close the trade.
 Chat now!
Add a Comment