

Dollar’s Subdued Reaction to Strong ISM Services PMI
During the Asian market hours, the US dollar index traded slightly bearish, experiencing a bearish retracement to $104.280, a decrease of 0.17%. This occurred despite the release of the solid ISM Services PMI, which exceeded expectations with a robust figure of 53.4, surpassing both the anticipated 52.0 and the previous 50.6. The strong PMI suggests that the service sector continues to exhibit enduring strength.
Events Recap & Review
The European economic data presented a mixed bag, with German Trade Balance exceeding expectations at 22.2B against the forecasted 19.0B, showcasing a stronger trade surplus.
Service sector PMIs across major European economies varied, with Spain and Italy reporting figures above expectations, suggesting resilience in services.
Conversely, France’s service sector struggled, as indicated by its final PMI at 45.4. The Eurozone’s investor confidence and PPI m/m data also highlighted ongoing economic challenges, with deflationary pressures evident in the PPI figures.
Events Ahead
US Dollar Index (DXY)
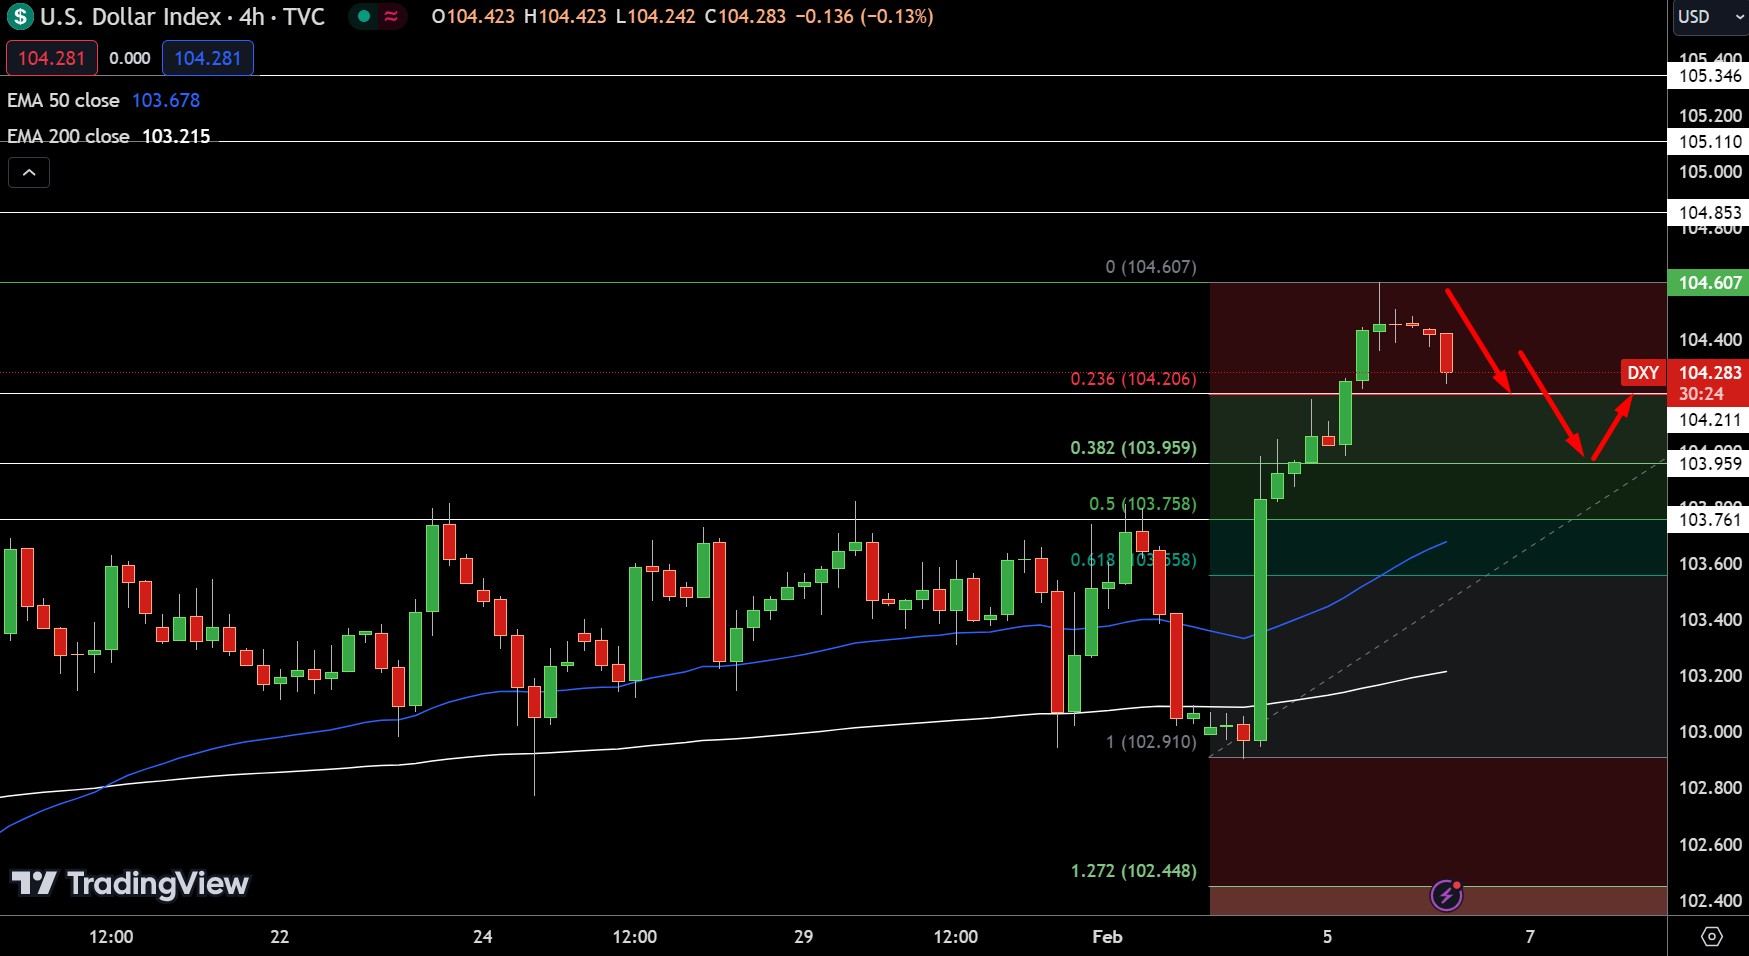
Conversely, immediate support is positioned at 104.211, marking a 23.6% Fibonacci retracement. Further support is seen at 103.959 (38.2% Fibonacci retracement) and 103.761 (50% Fibonacci retracement), crucial for holding the index from further declines.
The technical landscape is further defined by the 50-day Exponential Moving Average (EMA) at 103.678 and the 200-day EMA at 103.215, both underscoring a bearish sentiment below the pivot point.
Given these dynamics, the Dollar Index’s trend leans bearish below $104.607, highlighting a cautious outlook for the currency in the short term.
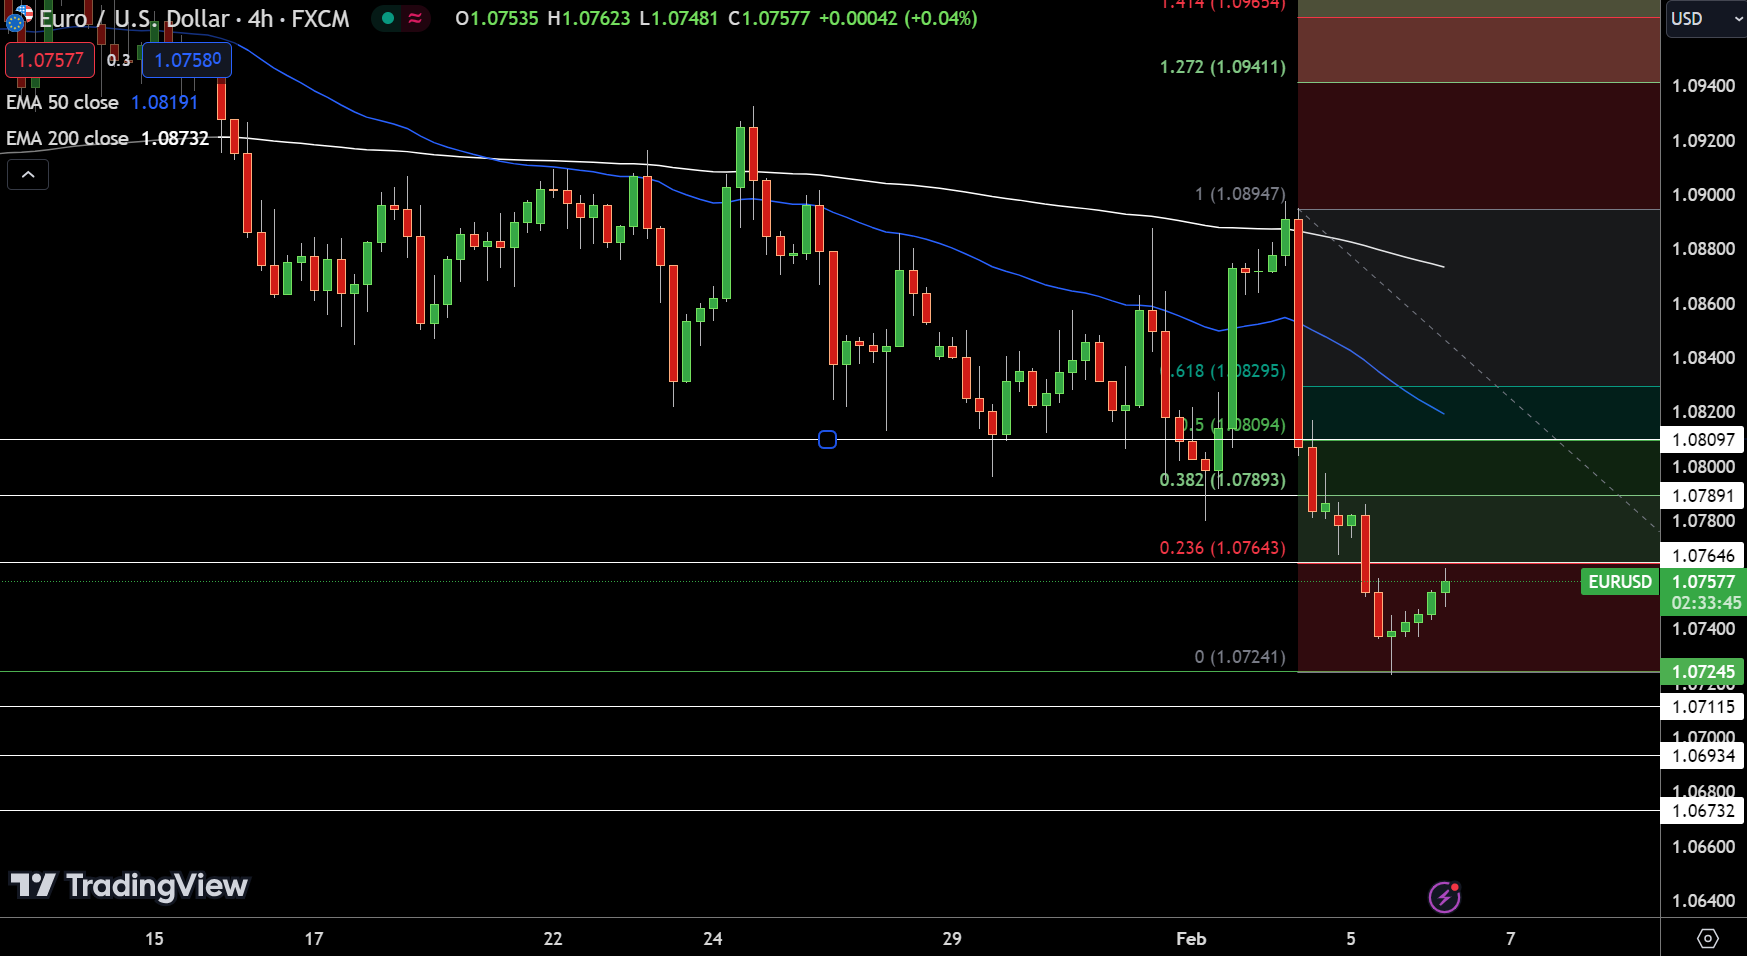
Notably, resistance levels are set at 1.07646 (23.6% Fibonacci retracement), 1.07891 (38.2% Fibonacci retracement), and 1.08097 (50% Fibonacci retracement), outlining potential barriers to upward movement. On the downside, support is identified at 1.07115, followed by 1.06934 and 1.06732, marking key levels where buying interest could emerge.
 Chat now!
Add a Comment