

US Dollar Outlook: Retail Sales and Industrial Data Ahead
The US Dollar faces key economic events this week, with Core Retail Sales expected to grow by 0.2% and Industrial Production to rise 0.2%. The Empire State Manufacturing Index already surprised at 11.5, well above forecasts.
Additionally, Capacity Utilization and the FOMC Member Logan’s speech are expected to provide insight into the economic outlook.
Experts trade the markets with IC Markets
Traders will closely watch for any changes in sentiment that could impact the Dollar’s movement, especially with the upcoming Federal Reserve decisions. Keep an eye on these crucial data points for potential market shifts.
US Dollar Index (DXY) – Technical Analysis
The Dollar Index (DXY) is trading at 100.697, down 0.04%, hovering just below its pivot point of $100.787. Immediate resistance is at $101.138, with higher levels at $101.522 and $101.842.
On the downside, key support is found at $100.508, followed by $100.288 and $100.075.
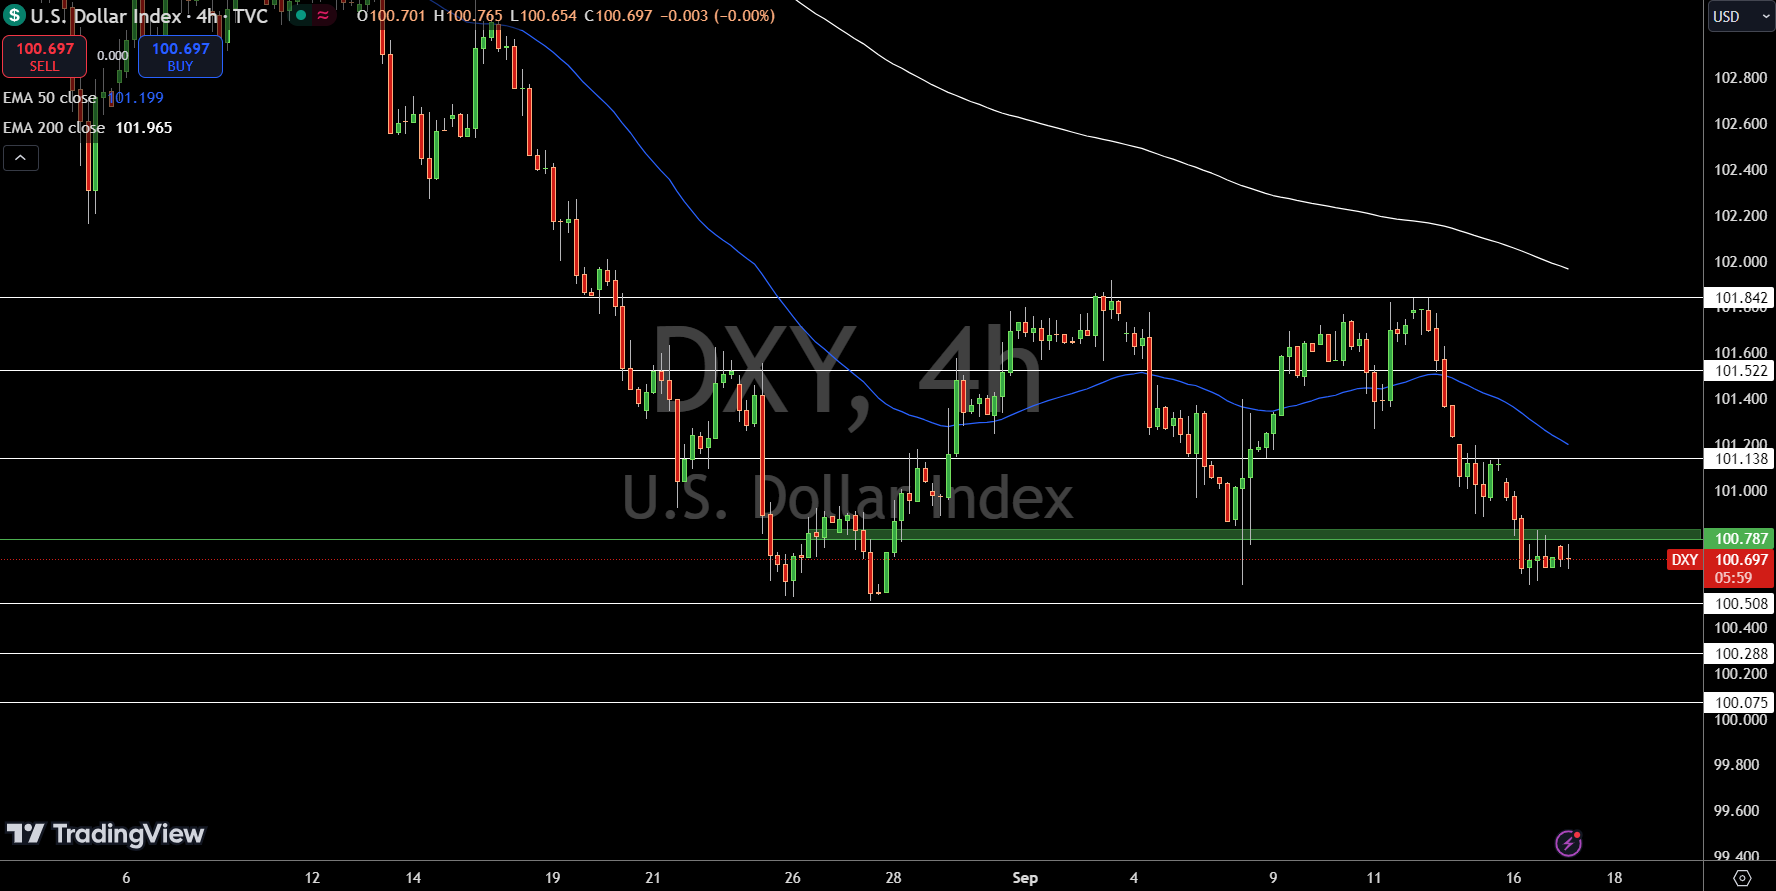
If the DXY breaks below $100.787, further declines are likely, with potential to test support levels. However, a break above this pivot could trigger a move higher, possibly targeting $101.138.
GBP Outlook: Inflation Data and 30-Year Bond Auction Key
The British Pound is set for a pivotal week with the 30-year Bond Auction and CPI y/y data in focus. The Consumer Price Index (CPI) is expected to remain steady at 2.2%, highlighting ongoing inflation pressures.
The outcome of the Bond Auction, with a current yield of 4.64%, will also influence market sentiment toward UK debt.
GBP/USD Technical Forecast
The GBP/USD is trading at $1.32077, down 0.11%, consolidating above the pivot point at $1.3183. Immediate resistance is seen at $1.3227, followed by further levels at $1.3267 and $1.3311.
On the downside, immediate support lies at $1.3137, with further support at $1.3102 and $1.3060.
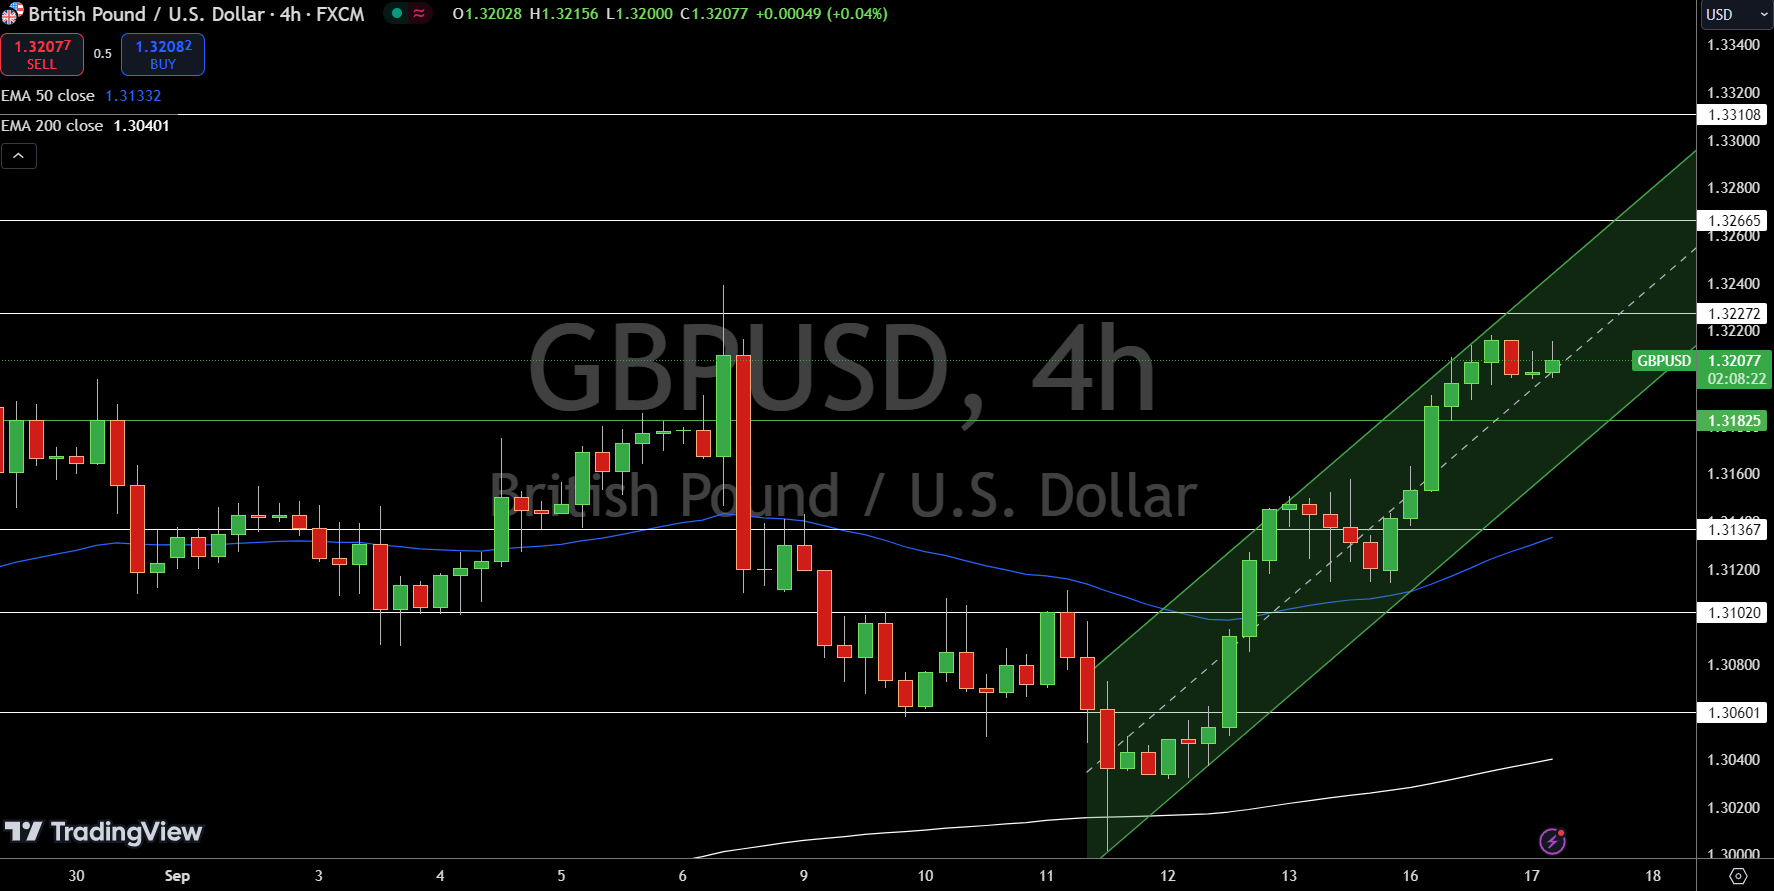
The pair remains bullish as long as it stays above the 50-day EMA at $1.3133. A break below the pivot could trigger sharper declines, with the 200-day EMA at $1.3040 acting as a crucial support level.
For now, watch for a move above $1.3227 to confirm continued bullish momentum. A break below $1.3183 could shift sentiment to the downside.
Euro Outlook: Trade Balance in Focus
The Euro faces significant data this week, with the German ZEW Economic Sentiment expected at 17.1, slightly lower than the prior 19.2. Additionally, Eurozone Trade Balance is reported at €15.5B, slightly below expectations but better than last month’s €14.9B.
Traders will closely watch for any surprises in the German Buba Monthly Report, which could provide more insight into the region’s economic outlook.
These key indicators will likely influence the Euro’s short-term direction, especially given the mixed sentiment across the Eurozone economy.
EUR/USD Technical Forecast
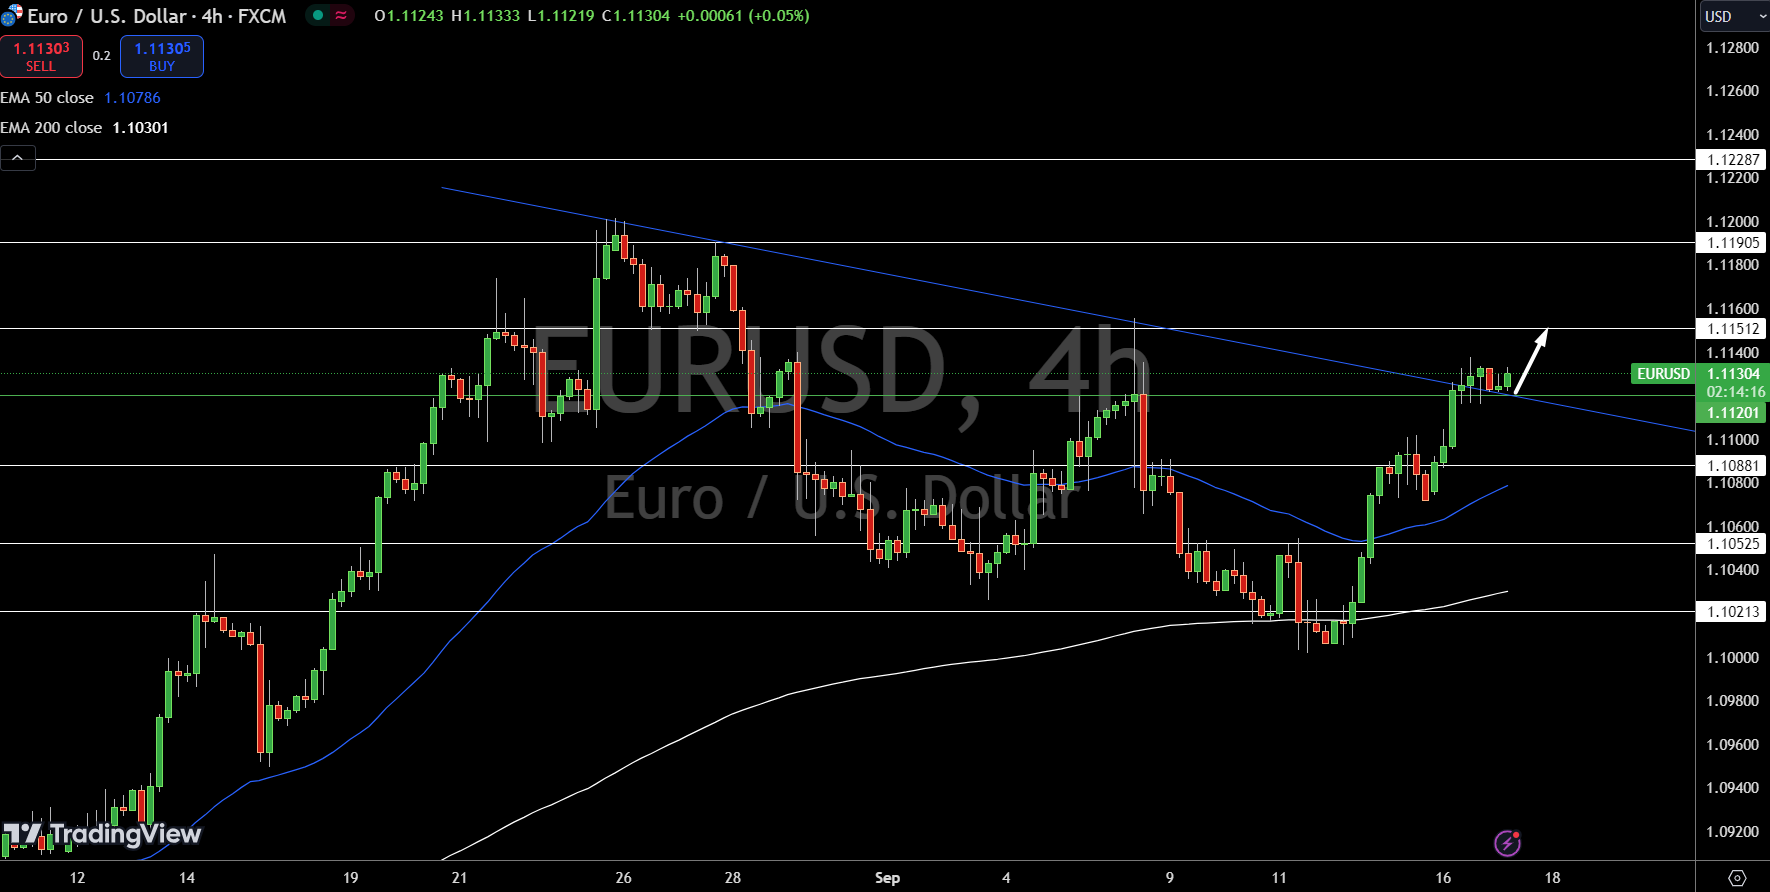
The EUR/USD is trading at $1.11304, down 0.08%, consolidating just above its pivot point of $1.11201. Immediate resistance sits at $1.11512, with further hurdles at $1.11905 and $1.12287. On the downside, support levels are found at $1.10881 and $1.10525.
The pair is holding above its 50-day EMA at $1.10786 and 200-day EMA at $1.10301, signaling bullish momentum for now.
 Chat now!
Add a Comment