

Tuesday Overview of USD/JPY Movements
On Tuesday, the USD/JPY gained 0.14%. Partially reversing a 0.49% loss from Monday, the USD/JPY ended the day at 148.709. The USD/JPY fell to a low of 148.161 before reaching a high of 149.097.
Bank of Japan Tankan Survey and the Middle East in Focus
The Reuters Tankan Index survey garnered investor interest this morning. In October, the Reuters Tankan Index held steady at 4 vs. a forecast of 2.
Trading Derivatives carries a high level of risk to your capital and you should only trade with money you can afford to lose. Trading Derivatives may not be suitable for all investors, so please ensure that you fully understand the risks involved, and seek independent advice if necessary. A Product Disclosure Statement (PDS) can be obtained either from this website or on request from our offices and should be considered before entering into a transaction with us. Raw Spread accounts offer spreads from 0.0 pips with a commission charge of USD $3.50 per 100k traded. Standard account offer spreads from 1 pips with no additional commission charges. Spreads on CFD indices start at 0.4 points. The information on this site is not directed at residents in any country or jurisdiction where such distribution or use would be contrary to local law or regulation.
The Reuters Tankan survey canvasses 200 manufacturers and 200 non-manufacturers, offering the Bank of Japan (BoJ) pre-quarterly Tankan survey signals. Weak numbers may force the BoJ to maintain negative rates.
While the survey-based figures will draw interest, geopolitical tensions in the Middle East remain a focal point. An escalation in the Middle East conflict will likely fuel demand for the Japanese Yen.
However, BoJ board member commentary also warrants consideration. Monetary policy intentions in the wake of the IMF forecasts will influence the appetite for the Yen.
US Producer Prices, the Fed Minutes, and Fed Speakers in the Spotlight
US inflation is in the spotlight again this week. A larger-than-expected increase in producer prices could reignite bets on a Fed rate hike. Economists forecast core producer prices to increase 2.3% year-over-year in September, up from 2.2% in August.
Producer prices filter through to consumer prices. The tight US labor market continues to fuel consumption and demand-driven inflationary pressures. High demand pushes producer prices higher, forcing the Fed to take a more aggressive interest rate trajectory to curb demand.
Higher interest rates raise borrowing rates and force firms to cut costs. In uncertain labor market conditions, wage growth slows, causing consumers to curb spending on non-essential items, easing demand-driven inflationary pressures.
Beyond the numbers, FOMC member speeches and the FOMC meeting minutes also need consideration. FOMC members Raphael Bostic and Christopher Waller are on the economic calendar to speak.
Short-term Forecast
The USD/JPY sits in the hands of central bank commentary, US inflation numbers, and news updates from the Middle East. A spike in US producer prices would reflect a pickup in demand, which may force the Fed to rethink plans to pause interest rate hikes.
USD/JPY Price Action
Daily Chart
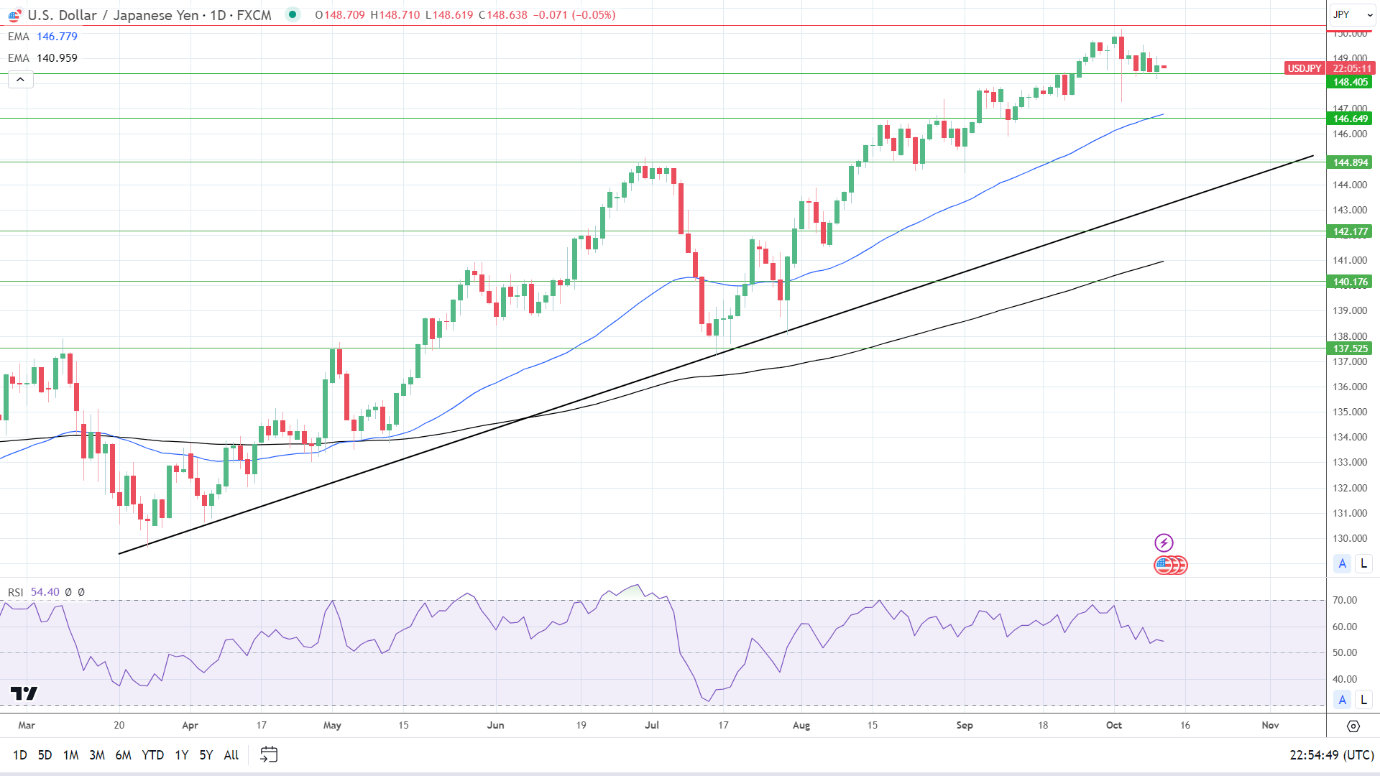
The USD/JPY sat above the 50-day and 200-day EMAs, affirming bullish price signals. A break below the 148.405 support level would support a move toward the 50-day EMA and 146.649 support level.
An escalation in the Middle East conflict and dovish Fed commentary would drive demand for the Yen.
However, hotter-than-expected US producer prices and the easing threat of a prolonged Middle East conflict would drive buyer demand for the USD/JPY.
A USD/JPY return to 149 would give the bulls a run at the 150.293 resistance level.
The 14-day RSI at 54.40 supports a USD/JPY move to the 150.293 resistance level before entering overbought territory.
4-Hourly Chart
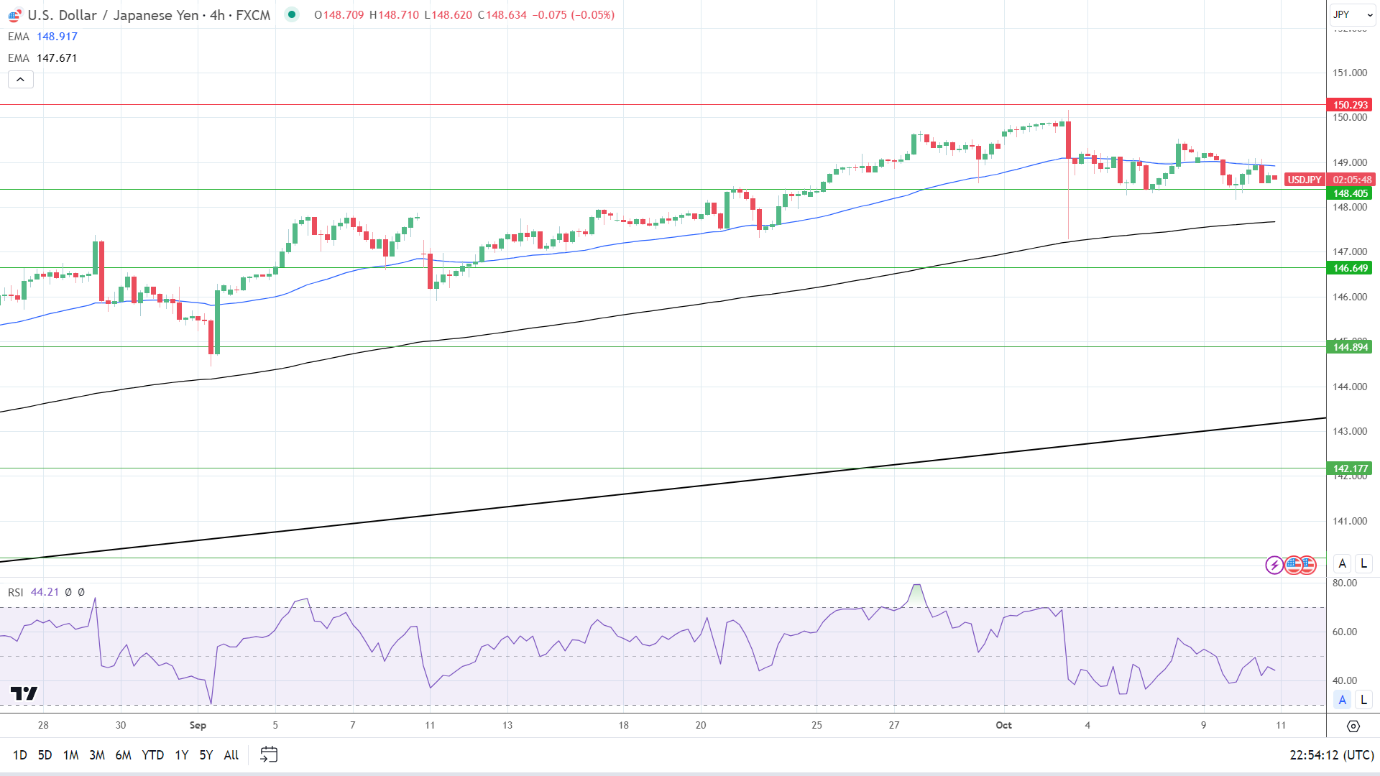
The USD/JPY remains below the 50-day EMA while sitting above the 200-day EMA, sending bearish near-term but bullish longer-term price signals. A break below the 148.405 support level would would bring the 200-day EMA into play.
However, a move through the 50-day EMA would support a move to the 150.293 resistance level.
The 44.21 14-4 Hourly RSI indicates a USD/JPY decline to the 200-day EMA before entering oversold territory.
 Chat now!
Add a Comment