

BTC Ends Four-Day Losing Streak as SEC Breaks ETF Silence
Bitcoin (BTC) rallied 6.49% on Wednesday, ending the session at $37,923. On Wednesday, the SEC delayed the decision on the Hashdex request to change to a BTC futures and spot ETF.
Bloomberg Intelligence ETF Analyst James Seyffart shared the SEC update, saying,
Trading Derivatives carries a high level of risk to your capital and you should only trade with money you can afford to lose. Trading Derivatives may not be suitable for all investors, so please ensure that you fully understand the risks involved, and seek independent advice if necessary. A Product Disclosure Statement (PDS) can be obtained either from this website or on request from our offices and should be considered before entering into a transaction with us. Raw Spread accounts offer spreads from 0.0 pips with a commission charge of USD $3.50 per 100k traded. Standard account offer spreads from 1 pips with no additional commission charges. Spreads on CFD indices start at 0.4 points. The information on this site is not directed at residents in any country or jurisdiction where such distribution or use would be contrary to local law or regulation.
This week, the ETF community discussed the unlikelihood of the SEC approving BTC-spot ETFs in waves. The ETF community expects the SEC to approve the current batch of applications in January 2024. A batch approval would mean the broader market cannot accuse the SEC of playing kingmaker.
Technical Analysis
Bitcoin Analysis
BTC remained above the 50-day and 200-day EMAs, sending bullish price signals.
A BTC break above the $37,600 resistance level would support a move toward the $39,000 resistance level.
While the ETF community expects the SEC to batch-approve the ETFs, BTC-spot ETF-related news will remain the focal point.
Failure to break above the $37,600 resistance level would leave the $36,400 support level in play. Adverse ETF-related news or SEC activity could test buyer demand.
The 14-Daily RSI reading of 68.38 suggests a BTC return to $38,000 before entering overbought territory.
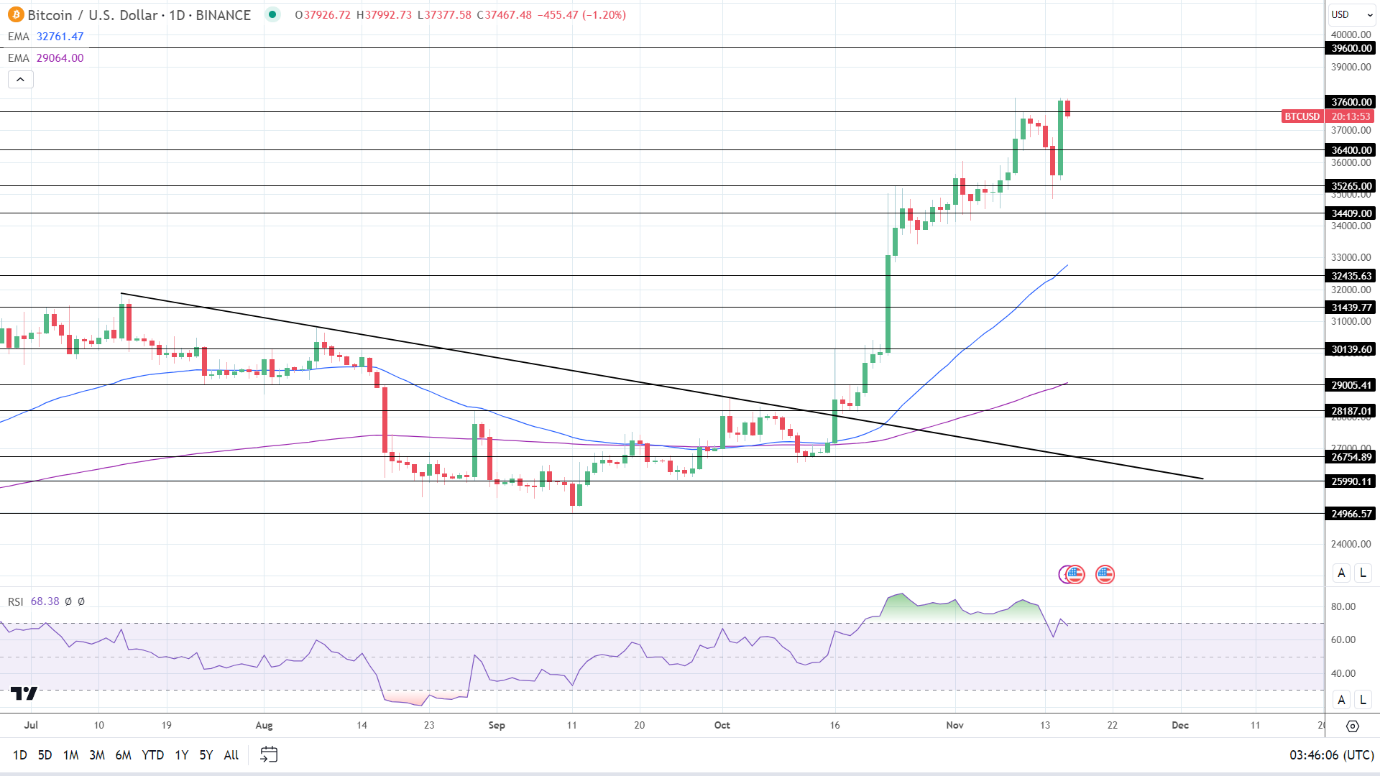
BTCUSD 161123 Daily Chart
Ethereum Analysis
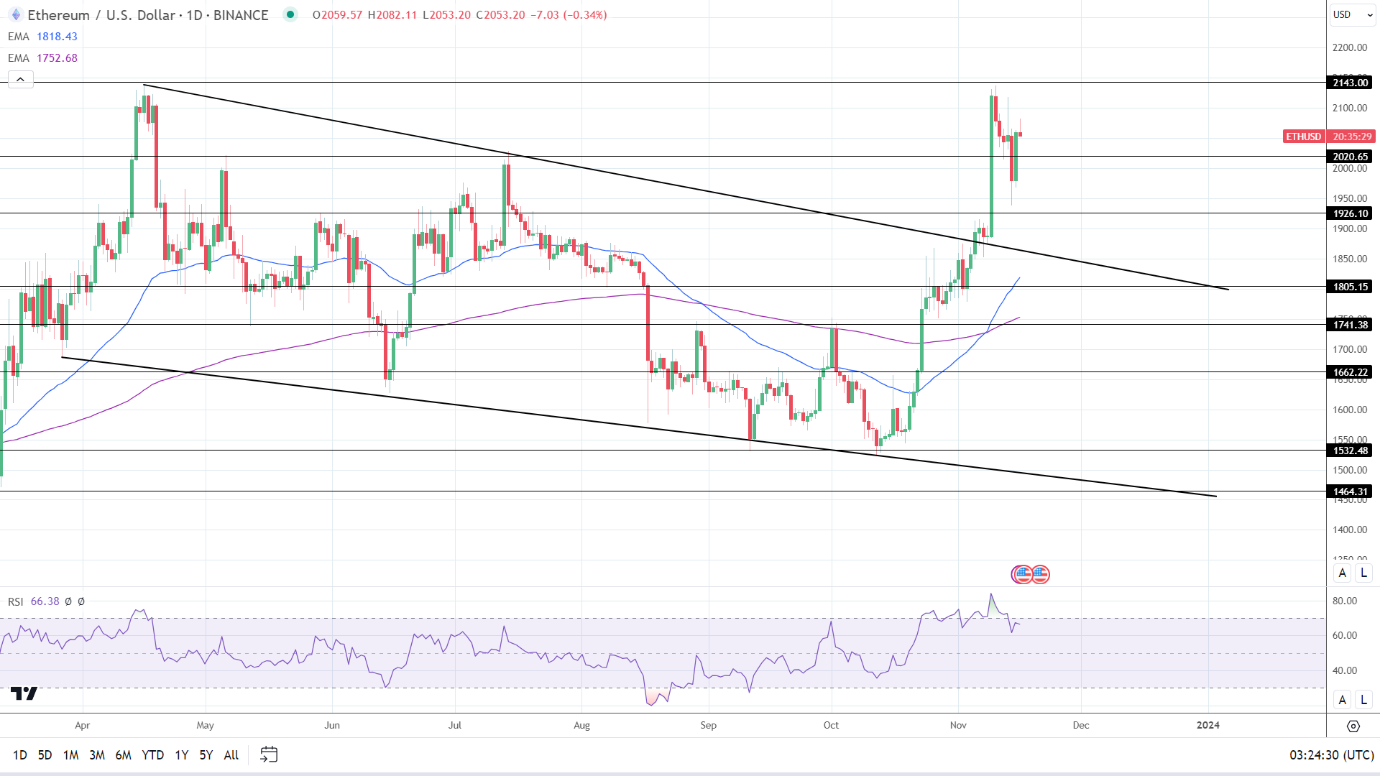
ETH held above the 50-day and 200-day EMAs, sending bullish price signals.
An ETH move to $2,100 would support a break above the $2,021 resistance level to target the $2,143 resistance level.
However, a fall through the $2,021 support level would bring the $1,926 support level into play.
The 14-period Daily RSI at 66.38 indicates an ETH return to $2,100 before entering overbought territory.
 Chat now!
Add a Comment