
Post FOMC Rebound on the Cards for GBP/USD?
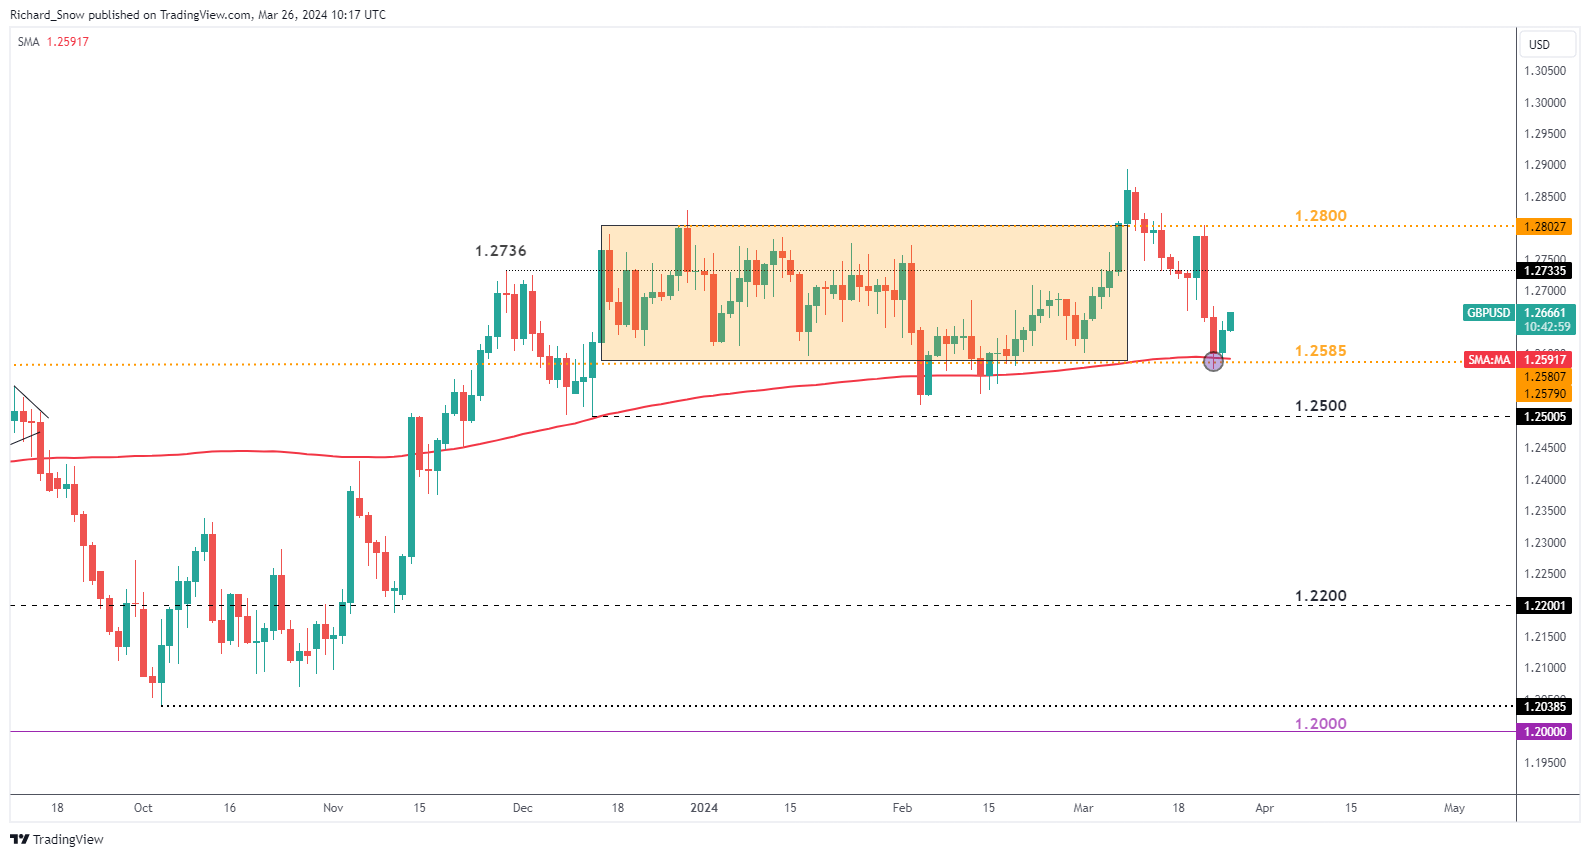
The daily GBP/USD chart reveals an attempt to lift off the stern zone of support found at the 200-day simple moving average and the 1.2585 level that help up prices for large parts of early 2024 when prices exhibited a range-bound preference.
Since spiking above the prior range, not for the first time either, GBP/USD heads back into familiar territory as the pair looks to recover from the sharp decline. 1.2736 is the next level of resistance should bulls take over from here. Sterling stands to benefit from a slightly weaker dollar at the start of the holiday-shortened week which also happens to be very quiet from a scheduled risk point of view with just PCE data scheduled for release on Good Friday.
GBP/USD Daily Chart
We typically take a contrarian view to crowd sentiment, and the fact traders are net-long suggests GBP/USD prices may continue to fall.
Read the detailed GBP/USD sentiment report to find out why recent changes in positioning has clouded the outlook for the pair from a contrarian view point.
Positioning is less net-long than yesterday but more net-long from last week. The combination of current sentiment and recent changes gives us a further mixed GBP/USD trading bias.
 Chat now!
Add a Comment