The Importance of Liquidity in Forex Trading

What is liquidity and why is it important?

Liquidity in the forex market is by definition, the ability of a currency pair to be traded (bought/sold) on demand. When you’re trading major currency pairs, you’re trading a market that is exceedingly liquid. However, you are trading based on the available liquidity of financial institutions which get you in or out of the trade (currency pair) of your choosing.

liquidity in forex

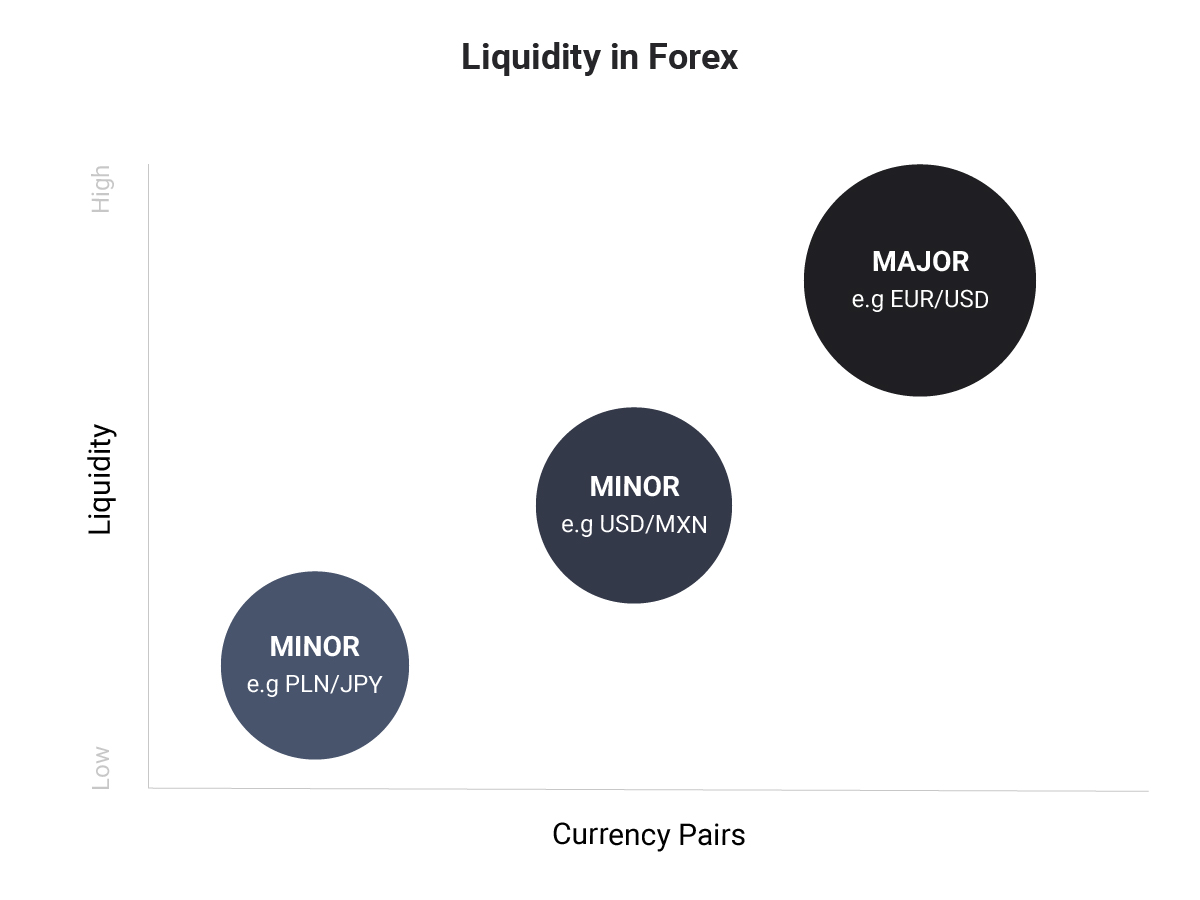
Not all currency pairs are liquid. In fact, currencies tend to have varying levels of liquidity depending on whether they are major, minor and exotic pairs (including emerging market currencies). Forex liquidity dries up as trader’s move from major pairs to minor pairs and finally to the exotic pairs.

High Liquidity:

High liquidity in forex refers to a currency pair that can be bought/sold in significant sizes without large variances in its exchange rate (price level) – e.g. Major currency pairs such as EUR/USD.

Other major currency (highly liquid) pairs to be aware of:

Low Liquidity:

Low liquidity in forex refers to a currency pair that cannot be bought/sold in significant sizes without large variances in its exchange rate price level – e.g. Exotic currency pairs such as PLN/JPY.

Forex liquidity vs liquidity: 3 Signs to look out for

From a trader’s point of view, an illiquid market will have chaotic moves or gaps because the level of buying or selling volume at any one moment can vary greatly. A highly liquid market is also known as a deep market or a smooth market and price action is also smooth. Most traders need and should require a liquid market because it is very hard to manage risk if you’re on the wrong side of a big move in an illiquid market.

Here are three signs to look out for which are:

1. GAPS WHEN TRADING FOREX

Gaps in forex vary compared to other markets. However, price gaps can occur in forex if an interest rate announcement or other high impact news announcement comes out against expectations.

Gaps can occur at the week’s opening on Sunday afternoon in the US. If there is a news announcement over the weekend, then overall gaps in forex are usually less than a 0.50% of a currency’s value.

The charts below depict the difference in the liquidity between the equity market and the forex market, as highlighted by gapping.

Equity markets are prone to gaps: FTSE 100 Index

Chart to show illiquid market and gaps

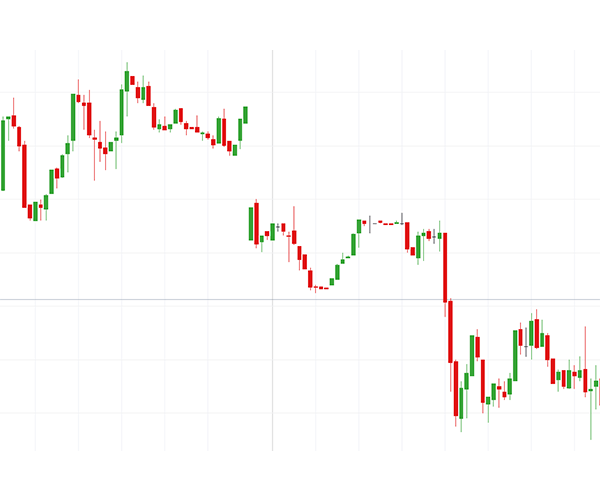
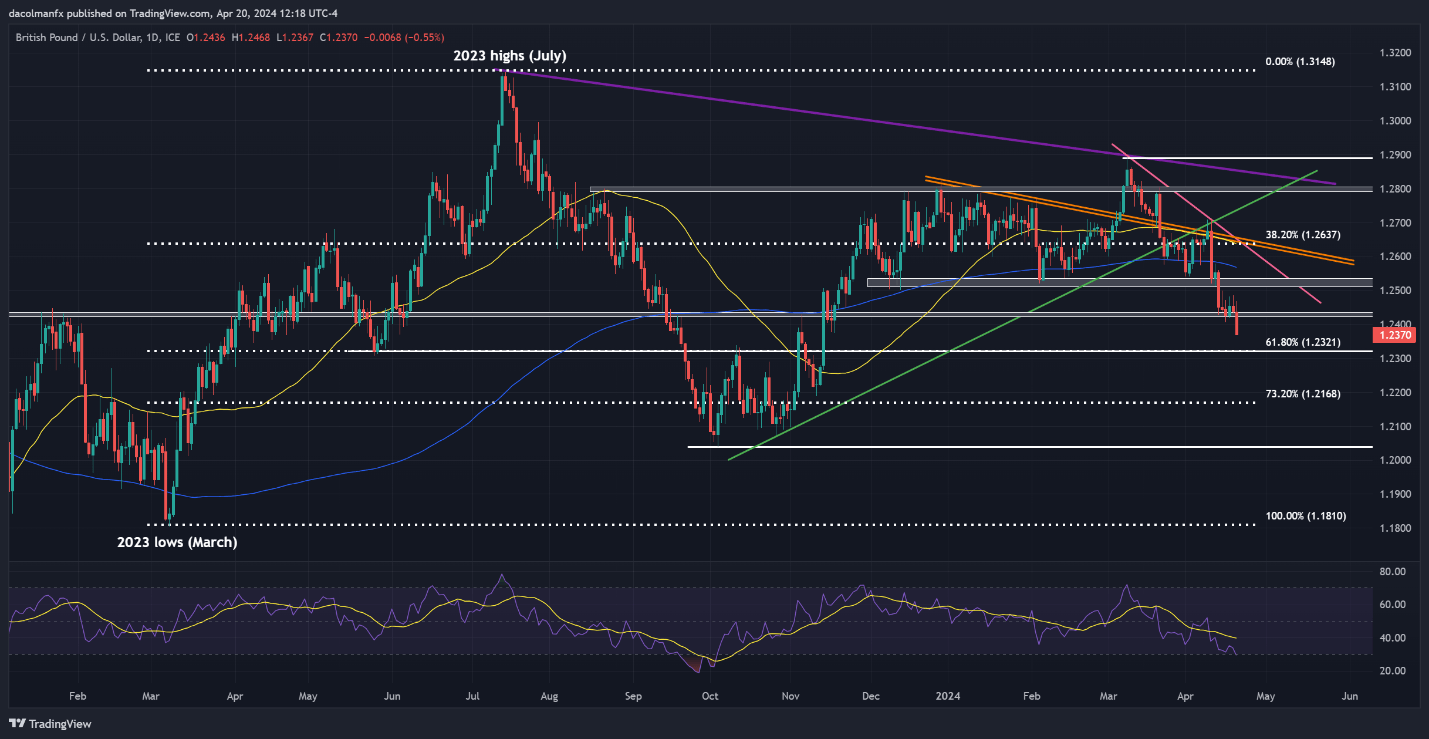
Forex market exhibits little/no gapping:

Chart to show a more liquid forex market

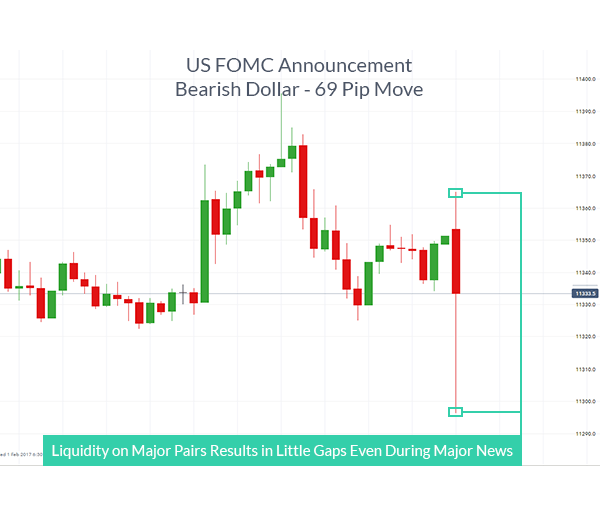
A market that trades 24 hours a day like the forex market is consideredmore liquid or simply tends to have less gaps due to the continuous naturein the equities market. This allows traders to enter and exit the market at their discretion. A market that only trades for a fraction of the day like the US Equity market or Futures Exchange would be condensed into a thinner market because price can jump at the open if overnight news comes out against the crowd’s expectations.

2. THE FOREX LIQUIDITY INDICATOR

Brokers often offer a “volume” option on the chart whereby a trader can gauge the liquidity of the market. This forex liquidity indicator is interpreted by analysing the bars on the volume chart.

Each volume bar represents the volume traded during the specific time period, thus giving the trader a suitable approximation of liquidity. It is important to remember that most brokers only reflect their own liquidity data and not the overall forex market liquidity. However, using a broker’s liquidity as a gauge can represent the retail market fittingly depending on the size of the broker.

3. DIFFERENT TIMES OF DAY OFFER VARYING AMOUNTS OF LIQUIDITY

Short term traders or scalpers should be aware of how liquidity in forex varies through the trading day. There are less active hours like the Asian Session that is often range bound meaning support and resistance levels are more likely to hold from a speculation point of view. The major moving market sessions such as the London session and US session are more prone to breakouts and larger percentile moves on the day.

The time of day that you’re likely to see the biggest moves are the US Morning Session because it overlaps with the European / London Session which alone accounts for roughly +50% of total daily global volume. The US session alone accounts for around 20% and in the US Afternoon, you will often see a sharp drop off in aggressive moves except for when the Federal Open Market Committee (FOMC) comes out with a surprise announcement which is but a few times a year.

Liquidity Risk vs Reward

The relationship between risk and reward in financial markets is almost always proportionate, so understanding the risks involved in a trade must be taken into consideration.

A primary example of liquidity risk in the forex market is the Swiss Franc crisis in 2015. The Swiss central bank announced they would no longer be preserving the Swiss Franc peg against the Euro causing the interbank market to become broken due to an inability to price the market. This led to brokers being unable to offer liquidity on CHF. As interbank pricing (the backbone of forex pricing) returned, EUR/CHF prices were far from the previous range. This led to retail client account balances for those trading CHF to be largely affected. While these “Black Swan” events are rare, they are not impossible.

Retail forex traders need to manage these liquidity risks by either lowering their leverage or making use of guaranteed stops whereby the broker is obligated to honour your stop price level.

Weighing up the options between liquidity risk and reward should not be overlooked and should be included as a part of a trader’s analysis routine.

US Dollar Forecast: Markets Await US GDP & Core PCE – EUR/USD, USD/JPY, GBP/USD

US DOLLAR INDEX WEEKLY PERFORMANCE

A graph on a screen  Description automatically generated

Upcoming macro releases could further bolster the greenback’s strength. On the U.S. economic calendar, there are two key reports that could ignite market volatility and shape investor sentiment in the days ahead: first-quarter gross domestic product on Thursday and March core PCE deflator – the Fed’s preferred measure of inflation on Friday.

With last month’s red-hot retail sales, CPI, and PPI readings, there’s a good chance these reports could top consensus estimates. That said, forecasts suggest Q1 GDP grew at an annualize rate of 2.1%, marking a slight deceleration from the robust 3.4% increase seen in the preceding quarter, yet still surpassing potential output, which by definition is inflationary.

Wondering about the U.S. dollar’s technical and fundamental outlook? Gain clarity with our latest forecast. Download a free copy now!

In terms of core PCE, this metric is seen increasing 0.3% on a seasonally adjusted basis, bringing the 12-month reading to 2.6% from 2.8% previously, a small but positive step in the right direction and a sign that underlying price pressures remain extremely sticky.

UPCOMING US DATA

image2.png

In the event of an upside surprise in both data points, investors are likely to coalesce around the view that the economy is still running at full steam and that inflation will be harder to control. This scenario should prompt traders to push the Fed’s first rate cut further out and price in a shallower easing cycle. Higher interest rates for longer should keep yields biased upwards, reinforcing the U.S. dollar’s bullish impetus.

All in all, the U.S. dollar’s prospects appear positive for now. The evolving macroeconomic picture clearly favors a scenario where the Federal Reserve will err on the side of caution, delaying its easing cycle to counter stubborn inflation, while counterparts like the ECB and BoE move closer to pivoting to a looser stance. This dynamic supports the dollar’s potential for continued gains.

For an extensive analysis of the euro’s medium-term prospects, download our complimentary Q2 forecast

EUR/USD FORECAST – TECHNICAL ANALYSIS

After enduring notable losses last week, EUR/USD steadied and mounted a modest comeback over the past few days, rebounding off the psychological 1.0600 level and pushing past the 1.0650 mark. If the pair continues to recover in the coming days, resistance is expected at 1.0695 and 1.0725 thereafter. On further strength, all eyes will be on 1.0820.

Conversely, should sellers reassert themselves and take charge of the market, technical support becomes apparent at 1.0600. Bulls must vigorously defend this technical floor; any failure to do so could exacerbate bearish momentum in the near term, paving the way for a deeper decline towards the 2023 lows near 1.0450.

EUR/USD PRICE ACTION CHART

A screenshot of a graph  Description automatically generated

For a complete overview of the Japanese yen’s outlook over the next couple of months, make sure to download our Q2 forecast!

SD/JPY FORECAST – TECHNICAL ANALYSIS

Earlier in the week, USD/JPY surged to multi-decade highs around 154.80 before retracing slightly from those lofty levels as the weekend approached. If the downward reversal gains traction in the upcoming trading sessions, support looms at 153.20 and 152.00 thereafter, with 150.80 possibly becoming a focal point if these price thresholds are breached.

On the flip side, if USD/JPY resumes its climb, resistance is likely to materialize near 154.80, followed by 156.00, the upper boundary of a short-term rising channel in place since December of last year. While the pair maintains a bullish outlook, it’s essential to proceed with caution given the overbought market conditions and the increasing probability of FX intervention by the Japanese government.

USD/JPY PRICE ACTION CHART

A screen shot of a graph  Description automatically generated

Interested in learning how retail positioning can offer clues about GBP/USD’s near-term trajectory? Our sentiment guide has valuable insights about this topic. Download it now!

GBP/USD FORECAST – TECHNICAL ANALYSIS

GBP/USD sold off this week, slipping below a technical floor at 1.2430 and hitting its lowest point since November. With bearish momentum prevailing, there’s potential for accelerated losses in the short term, possibly prompting a revisit of 1.2320 – a major Fibonacci support level. Prices may bottom out in this area before reversing higher; but in the case of a breakdown, a move towards 1.2168 could unfold.

Alternatively, if sentiment shifts back in favor of buyers and cable rebounds off its current position, resistance zones can be identified at 1.2430 and 1.2525 subsequently. Upside clearance of these levels could boost upward impetus, creating the right conditions for a rally towards the 200-day simple moving average at 1.2570.

GBP/USD PRICE ACTION CHART

image5.png

The Market News Today: Stocks, Gold, Crude Stir as Israel Strikes Iran

Israel Retaliates with Missile Strikes Against Iran

Following Iran’s attack last week involving over 300 drones and missiles, Israel, early Friday, launched missiles in retaliation. The prior Iranian offensive, aimed at numerous locations within Israel, was largely neutralized by defensive efforts from Israel and its allies, including the U.S. This strike is part of ongoing hostilities since Hamas’ incursion into Israel last October, leading to severe Israeli military responses. Israeli leadership continues strategic planning in response to these escalating tensions.

Stock Futures Decline Amid Renewed Israel-Iran Conflict

US stock futures declined early Friday, influenced by escalating tensions between Israel and Iran. This geopolitical unrest has heightened market volatility, leading to significant drops across major indices including the Dow Jones, S&P 500, and Nasdaq. Additionally, Netflix shares fell sharply despite strong earnings, reflecting investor unease. The broader market struggles, facing its worst week in months, largely due to fading hopes for an upcoming Federal Reserve rate cut amidst persistent inflation concerns. This marks a continued downtrend with increasing investor caution.

Experts trade the markets with IC Markets

Trading Derivatives carries a high level of risk to your capital and you should only trade with money you can afford to lose. Trading Derivatives may not be suitable for all investors, so please ensure that you fully understand the risks involved, and seek independent advice if necessary. A Product Disclosure Statement (PDS) can be obtained either from this website or on request from our offices and should be considered before entering into a transaction with us. Raw Spread accounts offer spread

Earnings Outlook Positive for Major US Companies – PG, AXP, SLB

Procter & Gamble (PG), American Express (AXP), and Schlumberger (SLB) are set to report their quarterly earnings before the market opens on April 19, 2024. Procter & Gamble anticipates a modest earnings increase, reflecting a 3.65% growth. American Express projects a substantial 23.75% rise in earnings, rebounding from a previous shortfall. Schlumberger expects a 17.46% earnings increase, continuing its trend of surpassing expectations. All three companies forecast higher growth rates compared to their industry averages, signaling strong competitive performance.

Oil Prices Rise Slightly After Initial 3% Surge on Middle East Tensions

Oil prices saw a modest increase following an initial surge after Israel’s military strike on Iran, which heightened concerns of a broader conflict in the Middle East. Brent crude briefly surpassed $90 but later stabilized at $88.62 a barrel, while West Texas Intermediate climbed to $84.10 per barrel. The geopolitical tensions also boosted safe haven assets, with gold reaching a new all-time high and the yen strengthening. The situation remains tense as both nations assess the aftermath of the military actions.

Treasury Yields Drop as Investors Seek Safe Havens

U.S. Treasury yields fell on Friday, driven by investor movements toward safe-haven assets amid escalating geopolitical tensions following Israel’s strike on Iran and mixed economic signals. Federal Reserve officials, including New York Fed President John Williams, emphasized a cautious approach to interest rate cuts, citing economic strength. This conservative stance, reinforced by robust Philadelphia Fed manufacturing data, contrasts with the growing demand for safer investments as global uncertainties increase.

UK Retail Sales Stalled in March Amid Mixed Signals from the BoE

UK Retail Sales Report – March 2024

The UK economy was in the spotlight, with UK retail sales in focus.

UK retail sales unexpectedly stalled in March after increasing by 0.1% in February. Economists forecast retail sales to rise by 0.3%.

Experts Trade GBP/USD with IC Markets

Trading Derivatives carries a high level of risk to your capital and you should only trade with money you can afford to lose. Trading Derivatives may not be suitable for all investors, so please ensure that you fully understand the risks involved, and seek independent advice if necessary. A Product Disclosure Statement (PDS) can be obtained either from this website or on request from our offices and should be considered before entering into a transaction with us. Raw Spread accounts offer spread

Retail sales volumes increased by 1.9% in the three months leading up to March compared to the previous three months. Retail sales were up 0.8% year-on-year in March but remained 1.2% below pre-pandemic levels (February 2020).

Bank of England Monetary Policy Implications

Retail sales figures for March aligned with comments from Bank of England Governor Andrew Bailey.

The retail sales report came after the UK inflation numbers for March. Despite the hotter-than-expected inflation numbers, Bank of England Governor Andrew Bailey announced the UK remains on track to tame inflation.

However, sentiment across the Monetary Policy Committee is mixed. MPC member Sarah Greene spoke on Thursday, saying that UK services inflation and wage growth remained too high to justify an interest rate cut.

GBP/USD Reaction to the UK Retail Sales Numbers

Before the UK retail sales figures, the GBP/USD rose to a high of $1.24392 before falling to a low of $1.23883.

However, in response to the retail sales report, the GBP/USD fell to a low of $1.24033 before rising to a high of $1.24210.

On Friday, the GBP/USD was down 0.14% to $1.24192.

GBP/USD reacts to UK retail sales figures.
Up Next: FOMC Member SpeechesOn Friday, FOMC member speeches will draw investor interest amid falling bets on multiple 2024 Fed rate cuts. FOMC member Austan Goolsbee is on the calendar to speak. Views on inflation, the US economy, and the timeline for an interest rate cut need consideration.

Gold Price Update: Israeli Attack Lifts Safe Haven Appeal, Weighs on Risk Assets

Gold Spiked Higher, Falling Narrowly Short of the All-Time High

Gold prices spiked higher in the early hours of Friday morning after reports emerged of the Israeli strike on Iran. The back and forth between the two nations risks sparking a broader conflict between the two and prompted a short-lived flight to safety.

Uncertainty surrounding the conflict in the Middle East has helped push gold prices higher and higher, nearly testing the all-time high around $2431.

On the daily chart, gold continues to trade within overbought territory but the degree of overheating has been cooling down – suggesting a slow down in bullish momentum within the broader uptrend.

The 1.618 Fibonacci extension of the 2020-2022 move reemerges as support at $2360, with a pocket of higher lows providing an area of further interest around the $2320 level. A strong US dollar and rising Treasury yields have done little to deter the rampant rise in the precious metal as central bank buying continues to add to the tailwind.

Gold (XAU/USD) Daily Chart

image1.png

Gold market trading involves a thorough understanding of the fundamental factors that determine gold prices like demand and supply, as well as the effect of geopolitical tensions and war. Find out how to trade the safe haven metal by reading our comprehensive guide:

While US stock markets were closed, the FX market was on hand to reveal the immediate response as soon as news broke of an Israeli attack on Iran. Traditional safe-haven currencies like the Swiss franc, Japanese yen and US dollar registered gains, while the more risk-aligned (high beta) Australian dollar witnessed the sharpest decline.

AUD has plummeted in recent days due to its historical correlation with the S&P 500, which is on track for a third straight weekly decline. In addition, Chinese economic prospects remain underwhelming, adding further to the headwinds for AUD.

Immediate Flight to Safety Exhibited in the FX market Overnight

image2.png

Gold Volatility Index in Focus

The 20-day implied gold volatility (GVZ) index provides a forward-looking measure of gold market volatility, hence its usefulness to investors and traders. Recent volatility has dipped and the focus will be on whether the two nations consider the recent flareup finished or is Iran intends to respond once again.

30-Day Implied Gold Volatility (GVZ)

image3.png


The Next Bitcoin Halving Event – What Does it Mean?

Bitcoin Halving Events Historically Lead to Bullish Market Behaviour.

The first Bitcoin halving occurred in November 2012, reducing the mining reward from 50 BTC to 25 BTC. Following the halving, Bitcoin experienced a significant surge in value, going from around$13 to over $1,100 in the next year.

The second halving took place in July 2016, when the reward dropped from 25 BTC to 12.5 BTC. After the halving. Bitcoin reached a high of around $20,000 by December 2017.

The third halving, in May 2020, reduced the block reward to 6.25 BTC. Bitcoin surpassed its previous all-time high and traded at just over $69,000 in November 2021.

Historical Bitcoin Halving Price Action

With two months to go before the next halving event, Bitcoin is pushing higher, helped in part by the recent launch of 11 spot Bitcoin ETFs. The strong demand for these ETFs has not only underpinned the spot price of Bitcoin but is also driving the price higher as the halving event nears. Bitcoin has regained the $50k level and may look at testing the all-time-high around $69k after the halving event reduces mining rewards by 50%.

Bitcoin Weekly Price Chart

image1.png

Currency Carry Trade: What is it and How Does It Work?

What is a currency carry trade and how does it work?

An FX carry trade involves borrowing a currency in a country that has a low interest rate (low yield) to fund the purchase of a currency in a country that has a high interest rate (high yield). Holding this position overnight will result in an interest payment being made to the trader based on the “positive carry” of the trade.

The lower yielding currency is referred to as the “funding currency” while the currency with the higher yield is referred to as the “target currency”.

Currency carry trade infographic

Rollover

“Rollover” is the process whereby brokers extend the settlement date of open forex positions held past the daily cut-off time. The broker either debits or credits the account, based on the direction of the trade (long or short) and whether the interest rate differential is positive or negative. Since interest is quoted as an annual figure, these adjustments will be the daily adjusted rate.

Interest rates

Interest rates are set by a country’s central bank in accordance with the mandate of that country’s monetary policy – this will differ from country to country. A trader then earns interest on a position when they are long the currency in the pair with the higher interest rate. For example, if the Australian dollar offers 4% and the Japanese Yen has interest rates set at 0%, traders could look to buy (long) AUD/JPY to take advantage of the 4% net interest rate differential.

There are two main components to the FX carry trade:

1) Changes in interest rates

The main component of the carry trade is centered around the interest rate differential between the two traded currencies. Even if the exchange rate between the two currencies remains unchanged, the trader will profit from the overnight interest payment. However, over time, central banks deem it necessary to alter interest rates and this poses a potential risk to the carry trade strategy.

2) Exchange rate appreciation/depreciation

The other component of the carry trade strategy focuses on the exchange rate of the two currencies. A trader looks for the target currency to appreciate (increase in value) when long. When this happens the payoff to the trader includes the daily interest payment and any unrealised profit from the currency. However, the profit the trader sees, as a result of the target currency appreciating, will only be realised when the trader closes the trade.

It is possible for a trader to lose money when the target currency depreciates against the funding currency so that the capital depreciation wipes out the positive interest payments.

Currency carry trade example

Continuing with the example used above, if the Australian Official Cash Rate is currently at 4% and the Japanese Yen yields 0%, a trader may decide to take a long trade on AUD/JPY if the pair is likely to rise.

FX carry trade example using AUD/JPY

Traders looking to capitalise on the interest rate differential will essentially be borrowing Yen at the much lower rate and receiving the higher interest rate associated with the Australian dollar. In reality, retail traders will receive less than 4% as forex brokers usually apply a spread.

For a detailed example of how to calculate the approximate overnight interest charge/gain, read our article on understanding foreign exchange rollover.

The risks involved with carry trades

A currency carry trade, like most trading strategies, carries a degree of risk and therefore, requires the adoption of sound risk management. Risk management has become even more important since the 2008/09 global financial crisis which resulted in lower interest rates for developed nations, forcing carry traders to look to riskier, high yielding emerging markets currencies until interest rates normalize.

  • Exchange rate risk: Should the target currency weaken against the funding currency, traders that are long the pair will see the trade move against them but will still receive the daily interest.
  • Interest rate risk: If the country of the target currency reduces interest rates and the country behind the funding currency increases interest rates, this will reduce the positive net interest rate and is likely to reduce the profitability of the FX carry trade.

FX Carry trade strategy

Filtering FX carry trades in the direction of the trend is one such strategy employed by top traders. This is because the carry trade is a long term trade, and therefore, it’s useful to analyse markets that exhibit strong trends.

In an attempt to get into higher probability trades, traders should first look to confirm the uptrend which, in the below chart, is confirmed after the higher high and higher low.

Trend bias in positive carry trade strategy

The figure depicts higher highs and higher lows whereby a break of the horizontal line (drawn at the first higher high) confirms the uptrend. Thereafter, traders can make use of multiple time frame analysis and indicators to spot ideal entry points to enter a long trade.

Conclusion

Currency carry trades present traders with two avenues to profit (exchange rate and interest rate differential) but it is essential to manage risk as losses are can arise when the pair moves against traders or the interest rate differential narrows.

For higher probability trades, traders should look for entry points in the direction of an uptrend and should protect downside risk by utilizing prudent risk management techniques.

Forex Candlesticks: A Complete Guide for Forex Traders

Forex candlesticks explained

There are three specific points that create a candlestick, the open, the close, and the wicks. The candle will turn green/blue (the color depends on the chart settings) if the close price is above the open. The candle will turn red if the close price is below the open.

If you have the chart on a daily setting each candle represents one day, with the open price being the first price traded for the day and the close price being the last price traded for the day.

  • Open price: The open price depicts the first traded price during the formation of a new candle.
  • High price: The top of the upper wick. If there is no upper wick, then the high price is the open price of a bearish candle or the closing price of a bullish candle.
  • Low price: The bottom of the lower wick. If there is no lower wick, then the low price is the open price of a bullish candle or the closing price of a bearish candle.
  • Close price: The close price is the last price traded during the formation of the candle.

The image below shows a blue candle with a close price above the open and a red candle with the close below the open.

A blue and red candlestick showing open and close wicks

Why forex traders tend to use candlestick charts rather than traditional charts

Candlestick charts are the most popular charts among forex traders because they are more visual. Candlestick charts highlight the open and the close of different time periods more distinctly than other charts, like the bar chart or line chart.

Candlestick charts have certain advantages:

  • Forex price movements are perceived more easily on candlestick charts compared to others.
  • It is easier to recognize price patterns and price action on candlestick charts.
  • Candlestick charts offer more information in terms of price (open, close, high and low) than line charts.

However, there are some disadvantages of candlestick charts:

  • Candles that close green or red may mislead amateur forex traders into thinking that the market will keep moving in the direction of the previous closing candle.
  • Candlestick charts may clutter a page because they are not a simple as line charts or bar charts.

How to trade forex using candlestick charts

Candlestick formations and price patterns are used by traders as entry and exit points in the market. Forex candlesticks individually form candle formations, like the hanging man, hammer, shooting star, and more. Forex candlestick charts also form various price patterns like triangles, wedges, and head and shoulders patterns.

While these patterns and candle formations are prevalent throughout forex charts they also work with other markets, like equities (stocks) and cryptocurrencies.

Trading forex using candle formations:

The hanging man:

The hanging man candle, is a candlestick formation that reveals a sharp increase in selling pressure at the height of an uptrend. It is characterized by a long lower wick, a short upper wick, a small body and a close below the open.

It is a bearish signal that the market is going to continue in a downward trend. Learning to recognize the hanging man candle and other candle formations is a good way to learn some of the entry and exit signals that are prominent when using candlestick charts.

The chart below shows the GBP/USD on a weekly timeframe. This means that each candle depicts the open price, closing price, high and low of a single week. The hanging man candle below (circled) is a bearish signal. Traders use bearish signals like this to enter short trades, a bet on the GBP depreciating relative to the USD.

If a trader uses the hanging man to execute a short trade, he/she should then place a stop loss and a take profit with a positive risk-reward ratio.

Hanging man chart pattern showing stop

The Shooting Star

A shooting star candle formation, like the hang man, is a bearish reversal candle that consists of a wick that is at least half of the candle length. The long wick shows that the sellers are outweighing the buyers. A shooting star would be an example of a short entry into the market, or a long exit.

Traders could take advantage of the shooting star candle by executing a short trade after the shooting star candle has closed. Traders could then place a stop loss above the shooting star candle and target a previous support level or a price that ensures a positive risk-reward ratio. A positive risk-reward ratio has been shown to be a trait of successful traders.

Chart showing shooting star candlestick pattern

The Hammer

The hammer candle formation is essentially the shootings stars opposite. It is a bullish reversal candle that signals that the bulls are starting to outweigh the bears. It is characterized by its long wick and small body. A hammer would be used by traders as a long entry into the market or a short exit.

The image below is an example of how a forex trader would use the hammer candle formation to enter a long trade, while placing a stop-loss below the hammer candle and a take profit at a high enough level to ensure a positive risk-reward ratio.

Chart showing hammer formation with stop loss

Take your forex trading to the next level

Supplement your understanding of forex candlesticks with one of our free forex trading guides. Our experts have also put together a range of trading forecasts which cover major currencies, oil, gold and even equities.

Crude Oil News Today: Prices Tumble Amid Geopolitical Calm, Weak Demand

Multiple Factors Weigh

Crude oil prices have faced a complex array of influences this week, with geopolitical tensions and fluctuating demand painting a mixed picture for the market. As Brent and West Texas Intermediate (WTI) prices fluctuate, a myriad of factors come into play, impacting both short-term valuations and longer-term market expectations.

Experts Trade WTI Crude Oil with IC Markets

Trading Derivatives carries a high level of risk to your capital and you should only trade with money you can afford to lose. Trading Derivatives may not be suitable for all investors, so please ensure that you fully understand the risks involved, and seek independent advice if necessary. A Product Disclosure Statement (PDS) can be obtained either from this website or on request from our offices and should be considered before entering into a transaction with us. Raw Spread accounts offer spread

Geopolitical Tensions and Market Reactions

The recent reinstatement of U.S. sanctions on Venezuela’s oil industry was overshadowed by other global events that exerted a heavier influence on oil prices. Notably, the market’s reaction to potential conflict escalations between Israel and Iran has been surprisingly subdued.

Despite Israel’s Prime Minister Benjamin Netanyahu’s firm stance on retaliating against Iran for recent aggressions, oil prices have not spiked as might be expected given Iran’s significant role in OPEC. This suggests that investors might be anticipating a controlled avoidance of escalated conflict, thereby limiting a surge in risk premium.

Adding to the bearish sentiment, the Energy Information Administration (EIA) reported an unexpected rise in U.S. crude inventories, with stocks reaching their highest level since June 2023. This increase, coupled with lower refinery utilization, has contributed to downward pressure on oil prices.

Moreover, global oil demand has been weaker than expected. JP Morgan’s recent update highlighted that demand has been running 200,000 barrels per day (bpd) below their forecast since April, with an annual increase much lower than anticipated.

Short-Term Forecast

In the immediate term, the oil market is likely to remain bearish. The combination of rising U.S. stockpiles, subdued global demand, and investor sentiment leaning towards the avoidance of Middle Eastern conflict suggests that oil prices may continue to struggle to find higher ground.

Furthermore, as U.S. gasoline and distillate inventories show diverging trends, the focus will increasingly shift to consumer demand patterns, especially with the upcoming U.S. summer driving season. However, any sudden geopolitical shifts or significant changes in inventory levels could swiftly alter this outlook. For now, traders should brace for potential volatility, with a leaning towards a bearish market scenario in the near term.

Technical Analysis

Daily Light Crude Oil FuturesThe short-term trend is down. Based on the current downside momentum, Light Crude Oil Futures appear headed into a test of the 50-day moving average at $79.90. Look for a techical bounce on the first test of this level. If it fails then the selling pressure is likely to extend into the 200-day moving average at $77.96.

A trade through $79.90 will change the intermediate trend to down. A move through $77.96 will indicate a change in the long-term trend.

Recapturing $82.68 could trigger the start of a short-covering rally, but not necessarily a resumption of the uptrend.

Gold (XAU/USD) Price Holds Steady Amid Pause in Middle East Tensions

Israel is still likely to respond to Saturday’s drone and missile attack by Iran, despite the latest diplomatic efforts by other countries to try and calm the situation in the Middle East. After talks with the UK and Germany yesterday, Israel’s Prime Minister Benjamin Netanyahu thanked both for their advice but warned of retaliatory action ahead.

“They have all sorts of suggestions and advice. I appreciate that. But I want to make it clear – we will make our own decisions, and the state of Israel will do everything necessary to defend itself.”

According to a report in The Daily Telegraph, Israel is unlikely to carry out retaliatory action before the end of Passover (April 30).

With a potential lull in Middle East tensions now seen until the end of the month, gold will need a new driver to keep it at its current elevated levels. The US dollar backed off from its recent multi-month highs overnight, helping the precious metal consolidate. The US dollar has rallied hard since early March, and this move accelerated last Wednesday after data showed that US inflation is refusing to move towards the central bank’s target. Technical support from all three simple moving averages on the daily chart is set to keep the US dollar higher for longer.

US Dollar Index – April 18th, 2024

image1.png

The price of gold remains within touching distance of its recent all-time high at $2,431.8/oz. and if the situation in the Middle East escalates, this high is likely to be breached. Gold is moving out of heavily overbought territory, while the recent multi-month ATR is starting to turn lower. The precious metal may see a period of consolidation over the coming days before the situation in the Middle East dictates the next move.

Gold Daily Price Chart – April 18th, 2024

image2.png

Chart

Retail trader data shows 50.75% of traders are net-long with the ratio of traders long to short at 1.03 to 1.The number of trader’s net long is 2.08% lower than yesterday and 2.19% lower than last week, while the number of trader’s net short is 3.89% lower than yesterday and 8.03% lower than last week.

We typically take a contrarian view to crowd sentiment, and the fact traders are net-long suggests Gold prices may continue to fall. Traders are further net-long than yesterday and last week, and the combination of current sentiment and recent changes gives us a stronger Gold-bearish contrarian trading bias.