gold_246-768x419

Gold and Silver Outlook: Prices May Rise as Retail Traders Increase Short Bets

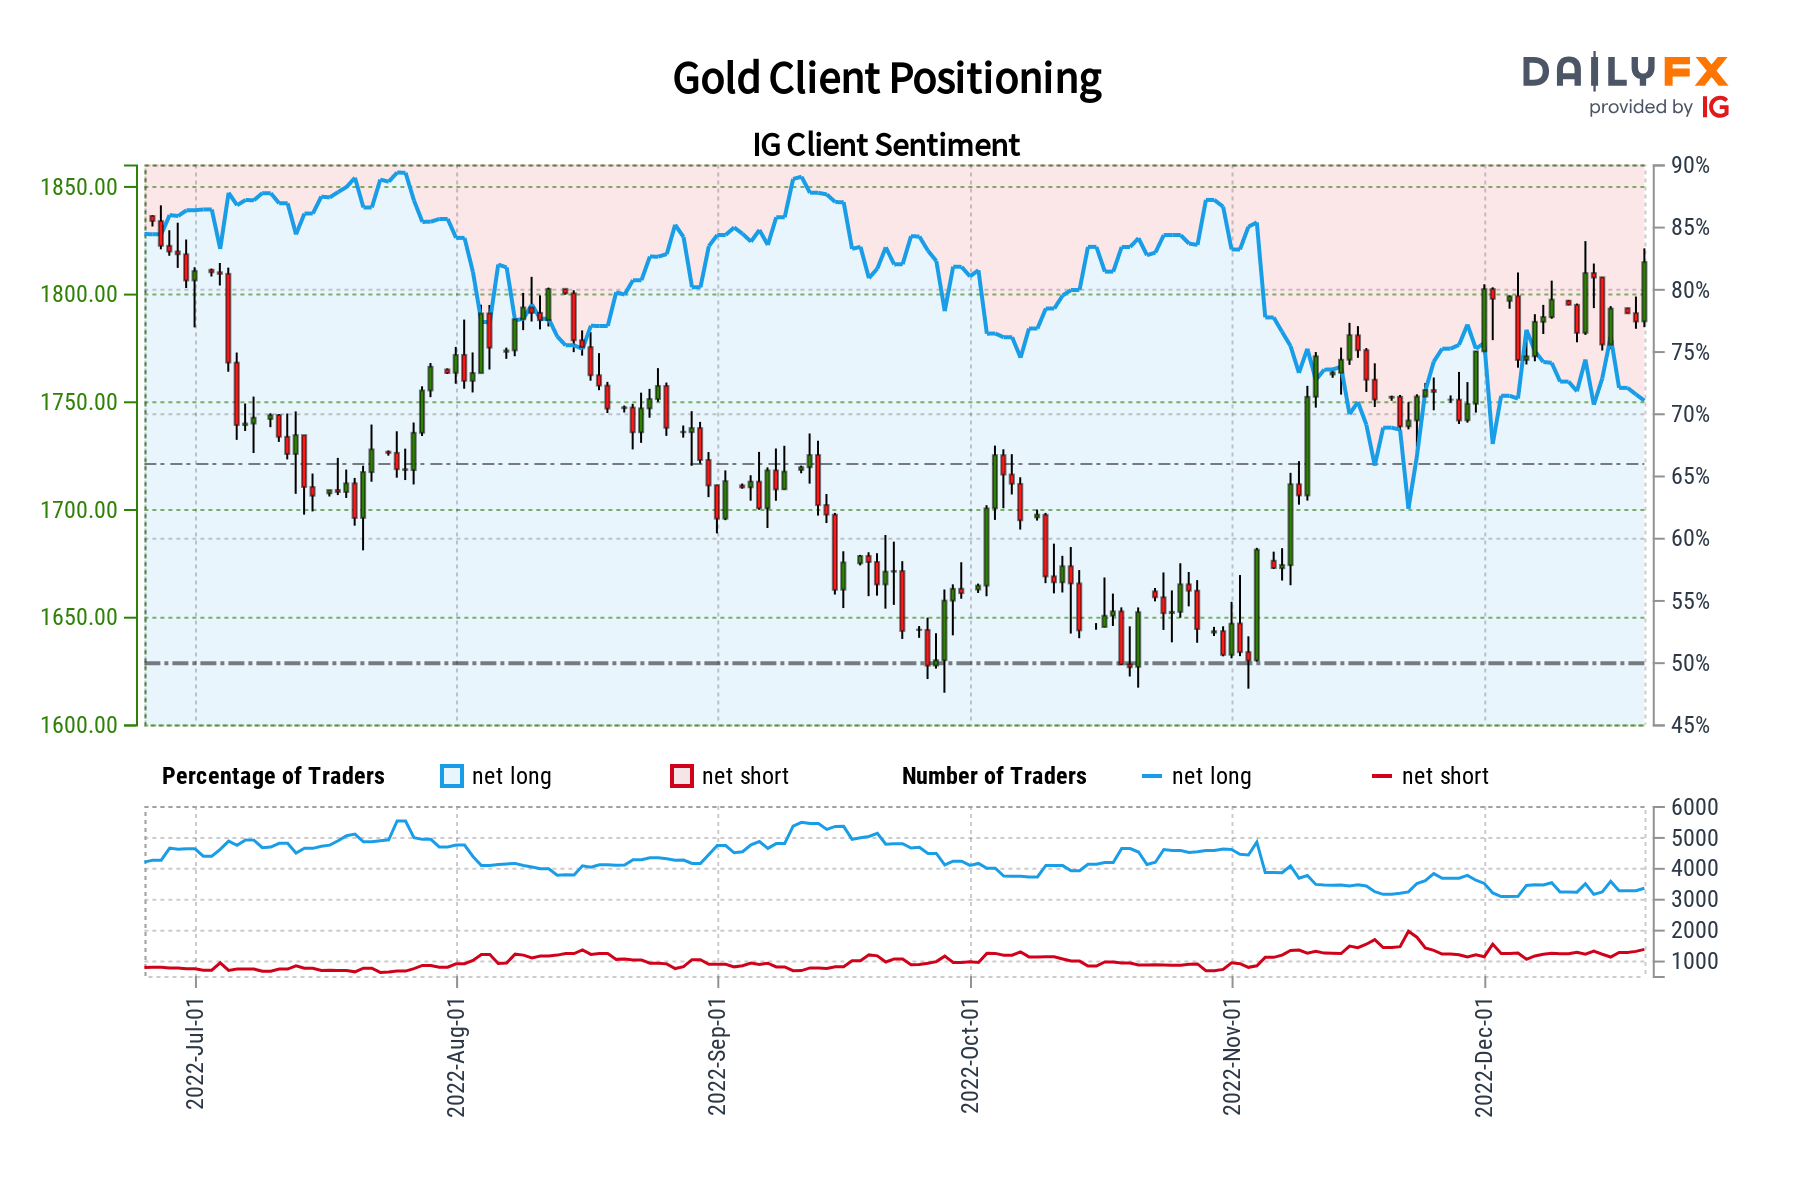
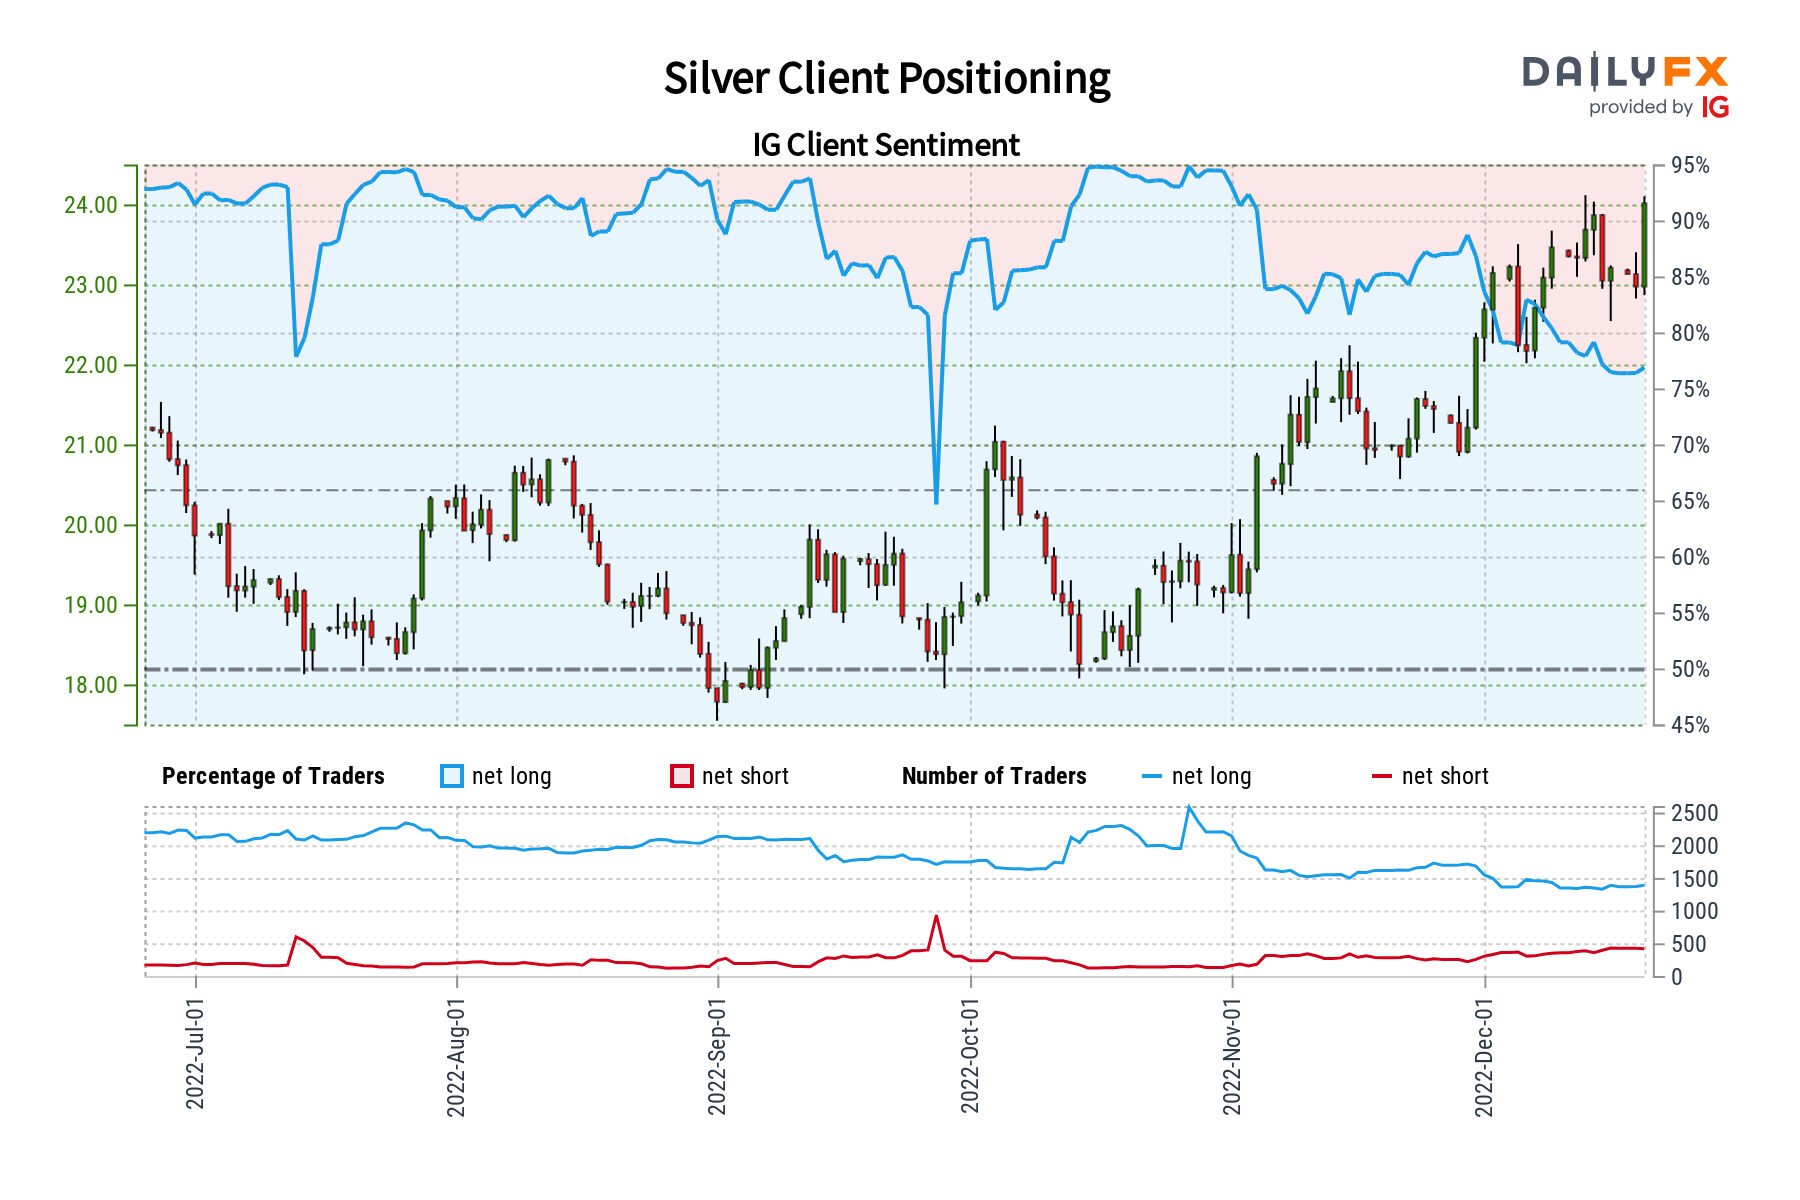
Gold and silver prices have been aiming cautiously higher in recent weeks. Meanwhile, using IG Client Sentiment (IGCS), we can see that simultaneously retail traders have been gradually increasing their downside exposure in the precious metals. IGCS tends to function as a contrarian indicator. With that in mind, could further upside be in store for XAU/USD and XAG/USD?

Gold Sentiment Outlook – Bullish

The IGCS gauge shows that about 66% of retail traders are net-long gold. Since most of them are still biased to the upside, this hints that prices may fall. However, downside exposure has increased by almost 15% and 24% compared to yesterday and last week, respectively. With that in mind, despite overall positioning, recent changes in exposure hint that gold may continue higher.

XAU/USD Daily Chart

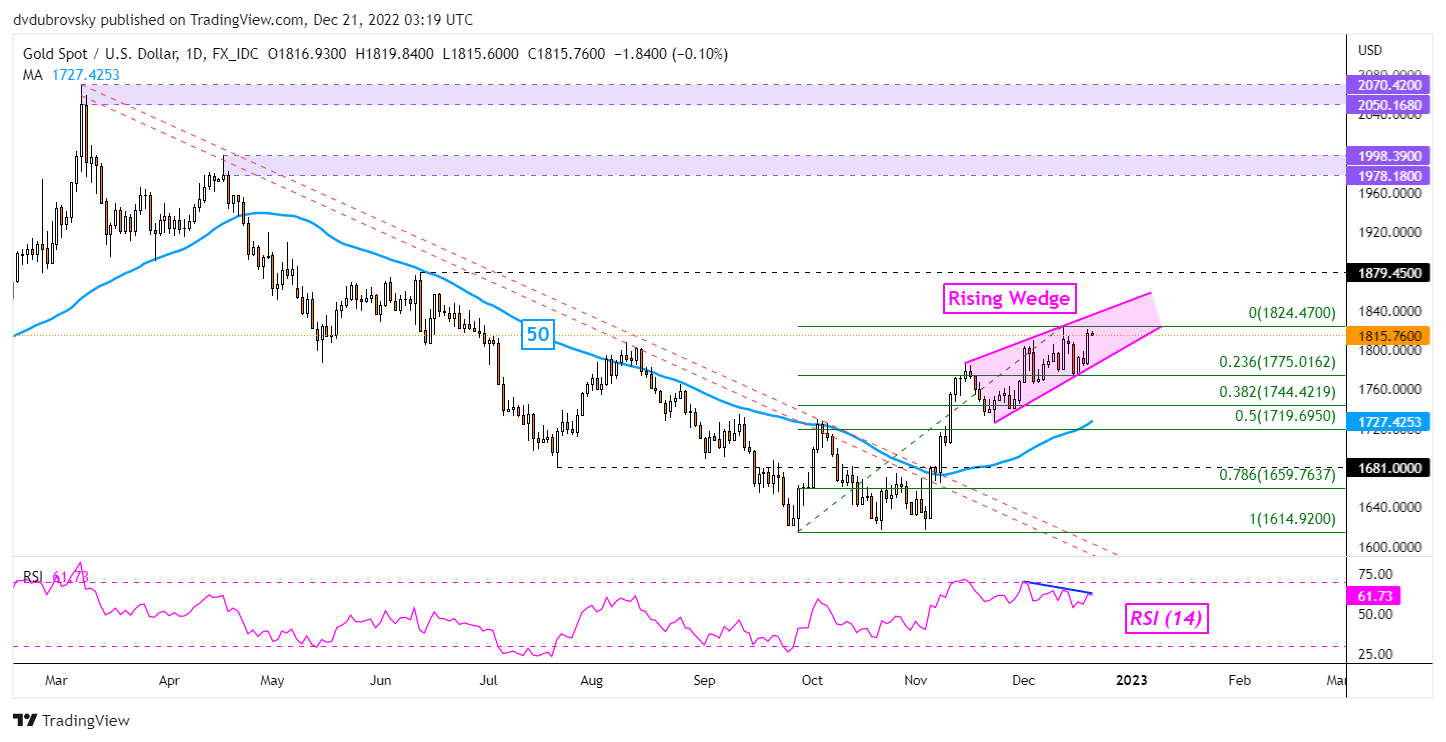
On the daily chart, XAU/USD continues aiming higher within a bearish Rising Wedge chart pattern. While gold remains in the formation, the technical bias may remain tilted upward. However, a breakout under the wedge could increase the risk of a reversal. That would place the focus on the 50-day Simple Moving Average (SMA). Otherwise, extending gains beyond 1824 exposes the June high at 1879.

Chart Created in Trading View

Silver Sentiment Outlook – Bullish

The IGCS gauge shows that about 65% of retail traders are net-long silver. Since the majority of investors maintain upside exposure, this hints that prices may fall. However, downside exposure has increased by 64% and 97% compared to yesterday and last week, respectively. With that in mind, despite overall positioning, recent changes in exposure hint that silver may continue higher instead. Recommended by Daniel Dubrovsky Improve your trading with IG Client Sentiment Data Get My Guide

XAG/USD Daily Chart

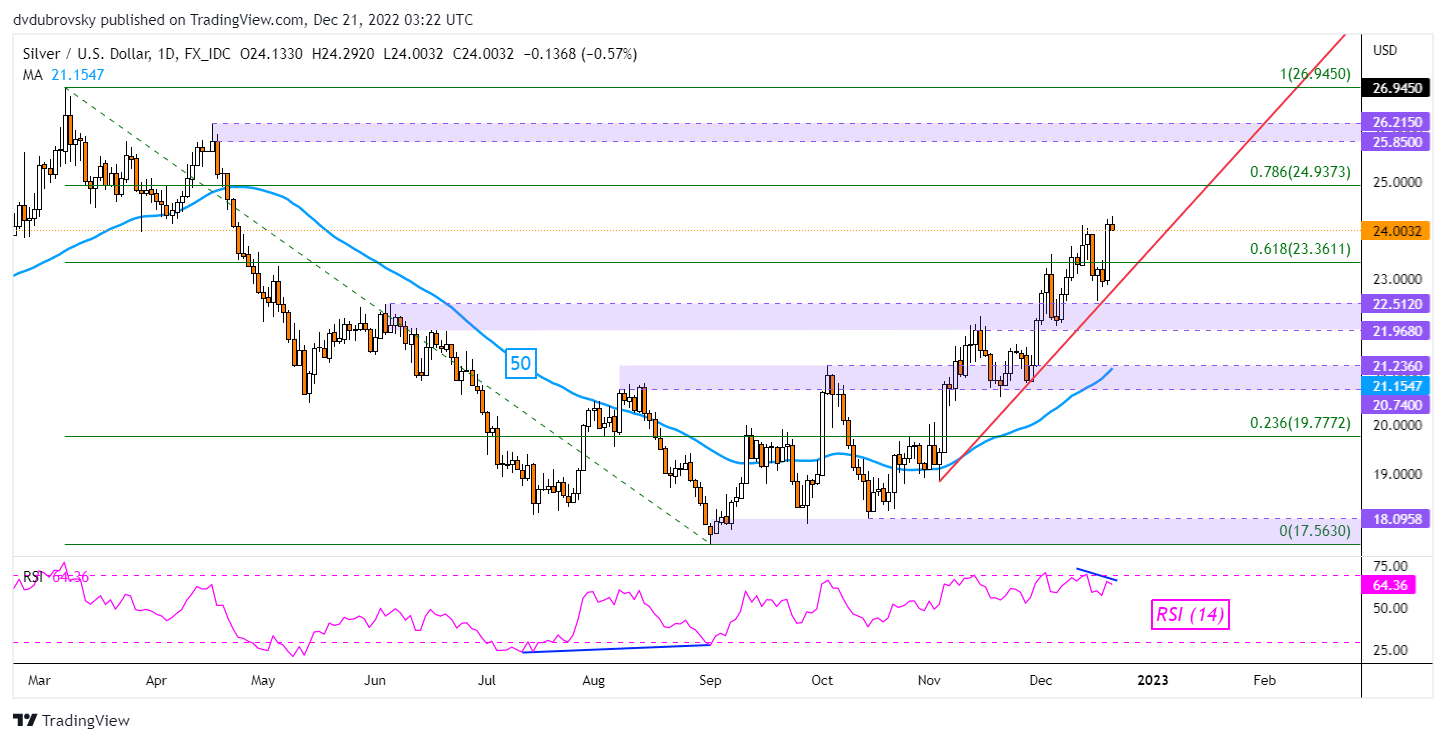
Silver recently closed at its highest since the middle of April. However, negative RSI divergence does show that upside momentum is fading. That can at times precede a turn lower. If that is the case, XAG/USD remains above the rising trendline from late October. The latter may hold as support, reinstating the upside focus. Key resistance seems to be the 78.6% Fibonacci retracement level at 24.937.

china-768x576

US Dollar Languishes in the Aftermath of US CPI and Ahead of the Fed. New Lows for USD?

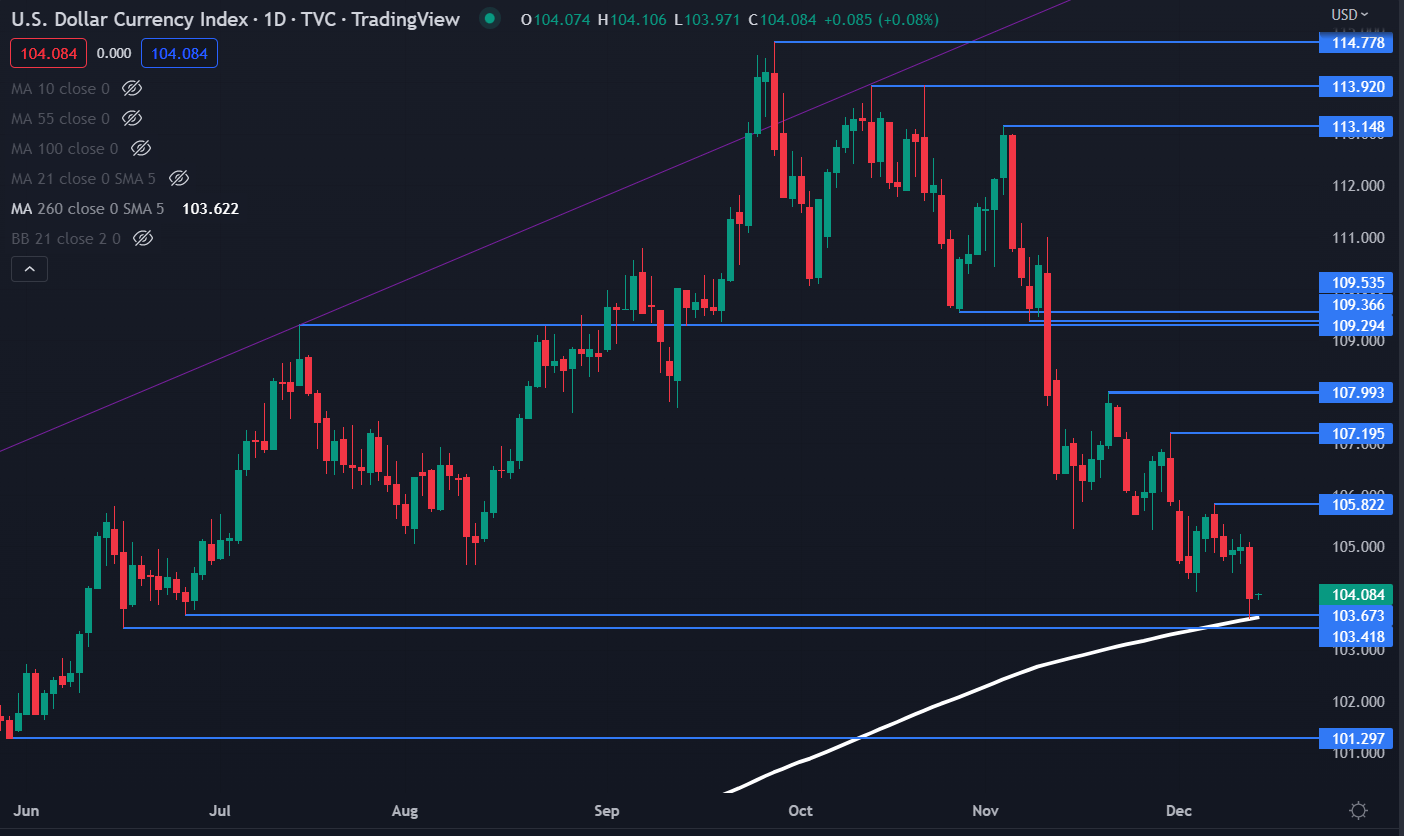
The US Dollar clawed back some of the overnight losses in the Asian session. The prospect of a less hawkish Federal Reserve has been spurred on by yesterday’s data and sent the DXY (USD) index to a six-month low.

Headline US CPI was 7.1% year-on-year to the end of November rather than the 7.3% forecast. It remains well above the Federal Reserve’s inflation target of around 2%.

An easing of price pressures has led to speculation of the Fed stepping back from its tough tightening stance going into 2023. Treasury yields tumbled on the news with the benchmark 2-year note trading below 4.15% after trading at 4.44% earlier in the session.

A 50 basis point (bp) lift is widely anticipated by the Fed later today. The focus of the Federal Open Market Committee (FOMC) meeting will be on the language from Fed Chair Jerome Powell in the post-announcement press conference.

Aside from the Fed, the European Central Bank (ECB) and the Bank of England (BoE) will also be deciding on rates on Thursday. UK CPI today could impact the BoE’s deliberations.

APAC equities are mostly flat or slightly firmer after a solid lead from Wall Street in the aftermath of a relatively benign CPI print.

China delayed an economic forum meeting in Beijing due to increasing Covid-19 infections in the city. It highlights some of the hurdles that lie ahead for a re-opening of China.

Crude oil is slightly softer so far today with the WTI futures contract near US$ 75 bbl while the Brent contract is a touch above US$ 80 bbl. Gold has held onto overnight gains, trading near US$ 1,810.

Japan’s Tankan survey was mildly soft but Japanese core machines orders beat expectations coming in at 5.4% month-on-month for October. The Japanese Yen is one of the few currencies to make ground against the US Dollar today.

Alongside UK CPI and the Fed rate decision, several inflation gauges across Europe will be released. China will see a plethora of data on Thursday.

The full economic calendar can be viewed here.

DXY (USD) INDEX TECHNICAL ANALYSIS

The DXY index sunk overnight but was unable to move below the June lows and the 260-day simple moving average (SMA) in the 103.42 – 103.67 zone. That area might continue to provide support.

On the topside, resistance could be offered at the previous peaks of 105.82, 107.20 and 107.99.

image1.png

demo-attachment-477-Businessman-at-the-desk-in-his-office-resting.

GBP Breaking News: UK Inflation Declines Beating Estimates, GBP/USD Dips

The CPI and Forex: How CPI Data Affects Currency Prices

UK inflation declined in November beating estimates and following last month’s record high print. The core rate of inflation dropped to of 6.3% while consumer prices dropped to 0.4% on a month-to-month basis, well below the 2% recorded in October.

Graphical user interface, text, application, email  Description automatically generated

Customize and filter live economic data via our DailyFX economic calendar

Individual Sectors

Breaking the inflation print down sector by sector, the largest contributors to the decline came from cost of transport (7.2% vs 8.9%), particularly motor fuels (17.2% vs 22.2%) and second-hand cars (-5.8% vs -2.7%). Prices also slowed in clothing and footwear (7.5% vs 8.5%), recreation and culture (5.3% vs 5.9%) and communication (2.6% vs 3.2%). On the flip side annual inflation for restaurants and hotels are at their highest since December 1991 having increased to 10.2% (vs 9.6%), mainly pushed by alcohol served in restaurants, cafes and pubs, making the biggest upward contribution. Food inflation meanwhile, edged higher to 16.5% from 16.4%, hitting the strongest since 1977, led by cost of bread and cereals. Rentals for housing increased 4.5%, slightly above the 4.3% in October.

Following positive GDP data on Monday, UK Chancellor Jeremy Hunt warned that the economy could get worse before it gets better. While yesterday’s employment data came in largely positive it did indicate a slowdown in hiring as businesses brace for a tough start to 2023. Wage growth (YoY) hit a high which added further challenges for the BoE as it looks to balance recessionary concerns with the rising cost of living. The Bank of England released its Financial Stability Report Yesterday warning that 2023 will prove challenging for UK households due to a combination of falling real incomes, increases in mortgage costs and higher unemployment.

The Bank of England (BoE) meet tomorrow with market consensus for a 50bps hike, as the BoE attempt to manage the risk of runaway inflation against the cost-of-living crisis. Today’s inflation beat will alleviate some of the pressure on the BoE and a 50bps hike should be a mere formality. The comments and guidance provided by Governor Bailey may provide clues as to the way forward which could see a spike in volatility.

GBPUSD 15M Chart

Initial reaction was a 15pip spike lower for GBPUSD. Cable enjoyed a stellar day yesterday breaking a three-day trading range as the US dollar suffered. A new high has been printed around 1.24400 and looking at the recent rally we could be in for some retracement. This will no doubt depend on the tone adopted by the US Federal Reserve later today with a hawkish statement likely to push the pair lower. Alternatively, any dovish comments could see the pound push on, and GBP/USD test the 1.25000 level which coincides with the 61.8% fib level (2022 high to low).

IG CLIENT SENTIMENT DATA: MIXED

IGCS shows retail traders are currently SHORT on GBP/USD, with 59% of traders currently holding short positions. At DailyFX we typically take a contrarian view to crowd sentiment, and the fact that traders are short suggests that prices could GBP/USD may continue rise.

imf-768x576

GBP Breaking News: Pound Undeterred by UK GDP Beat Due to Strike Action

GBP/USD FUNDAMENTAL BACKDROP

The British pound was muted in its reaction to the UK GDP beat this morning however, once the European session commences, there could be a more positive response. UK GDP statistics outperformed on almost all metrics (see economic calendar below) and has managed to push above the February 2020 pre-COVID level.

GBP/USD ECONOMIC CALENDAR

image1.png

Source: DailyFX Economic Calendar

The primary contributor towards GDP for the month of October was the services sector (blue) and after a dismal month in September, the support has been most welcome. Considering the UK is principally a services economy, the release adds some positivity towards the broader UK economy.

image2.png

From a production standpoint, the ONS report stated that “electricity, gas, steam and air conditioning supply was the largest negative contributor”, highlighting the declining energy crises facing the UK and Europe. Should Russia look to cut supply of gas and oil further post-G7 and their decision to implement a cap on Russian oil, this situation could compound and negatively impact future GDP number and consequently the pound.

Looking ahead, the soft GBP reaction could be attributed to concerns around strike action in both private and public sectors of the UK of which PM Rishi Sunak’s government is looking to utilize military personnel to fill the gaps.

TECHNICAL ANALYSIS

GBP/USD DAILY CHART

image3.png

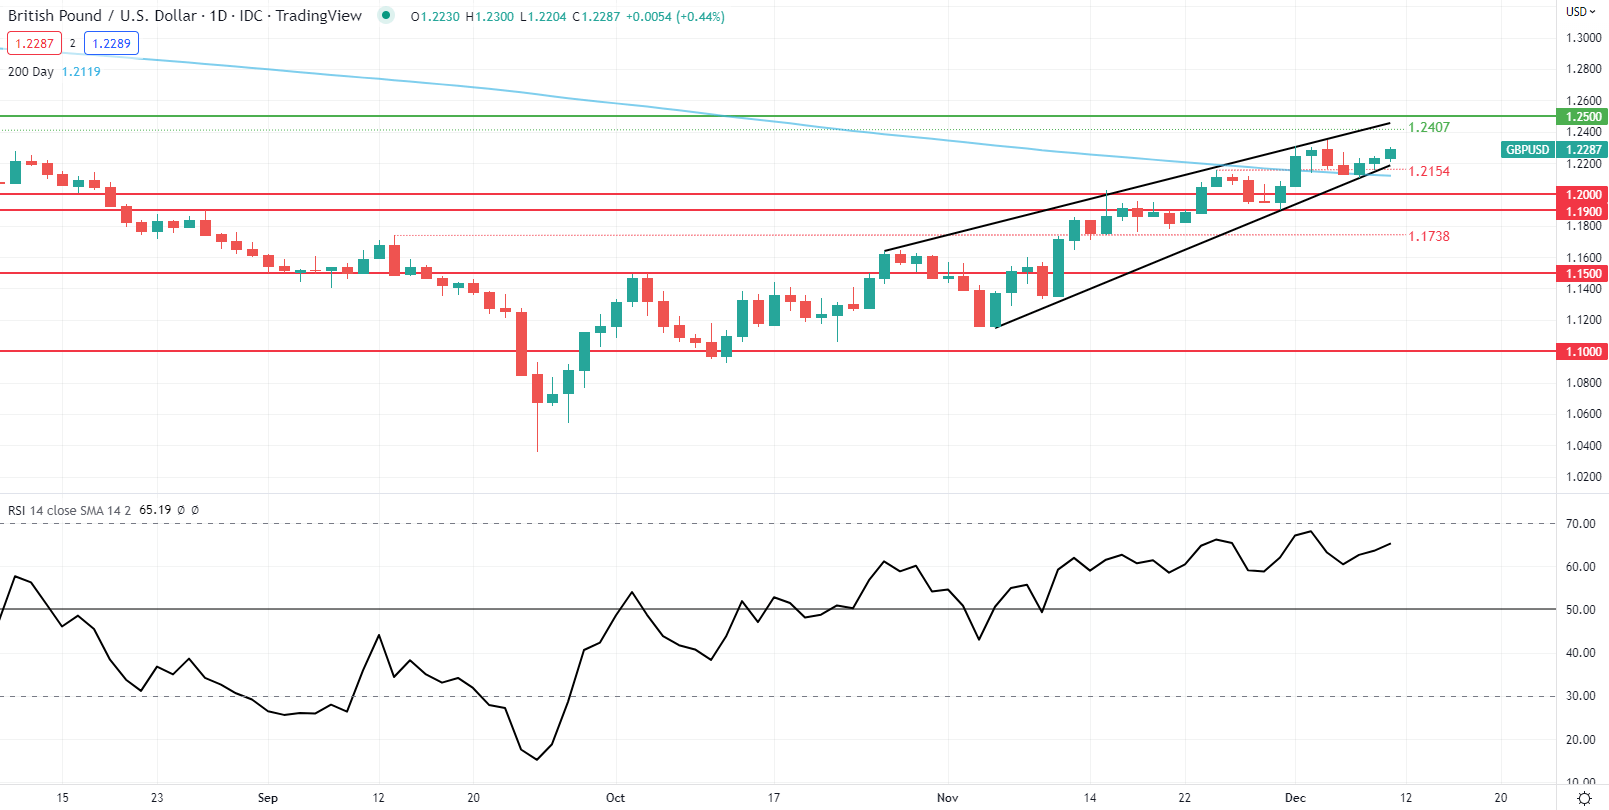
Cable looks to be testing rising wedge support (black) with a daily candle close bringing into focus the 1.2154 swing low and 200-day SMA (blue). Key economic data is critical this week and will likely be the catalyst for a downside or upside break depending on the outcomes.

Key resistance levels:

  • 1.2500
  • 1.2407

Key support levels:

  • Wedge support
  • 1.2154
  • 200-day SMA
  • 1.2000
china-768x576

Euro Dips as the US Dollar Firms Post PPI and Ahead of CPI. Will EUR/USD Break Higher?

The Euro is weaker today as the US Dollar gains ahead of a crucial week of central bank meetings and data.

The Federal Reserve, the European Central Bank (ECB) and the Bank of England (BoE) lead the line-up. All three banks are priced by the market to lift rates by 50 basis points (bps).

Risk assets in general have come under pressure on Monday despite more signalling from China that they could be shifting away from their highly restrictive Covid-19 policy. A top health official has said that the death rate of the omicron variant is roughly the same as the flu.

APAC equities are a sea of red and the growth-linked Australian Dollar is the worst-performing currency through the Asian session.

US PPI on Friday was hotter than forecast at 7.4% year-on-year to the end of November. US CPI on Tuesday is now in focus.

Crude oil is steady so far despite news that a significant North American pipeline remains shut. The Keystone Pipeline connects Canadian oil fields with the US Gulf Coast.

The WTI futures contract is near US$ 71.60 bbl while the Brent contract is a touch above US$ 76.50 bbl at the time of going to print. Gold has eased below US$ 1,800 while Treasury yields beyond 2-years slipped a couple of bps.

Elsewhere, US officials have asked Japan to curb chip exports to China, adding to last week’s request to the Netherlands for the same action.

It is a busy day for UK data with the trade balance, industrial and manufacturing production figures being the highlight.The full economic calendar can be viewed here.

EUR/USD TECHNICAL ANALYSIS

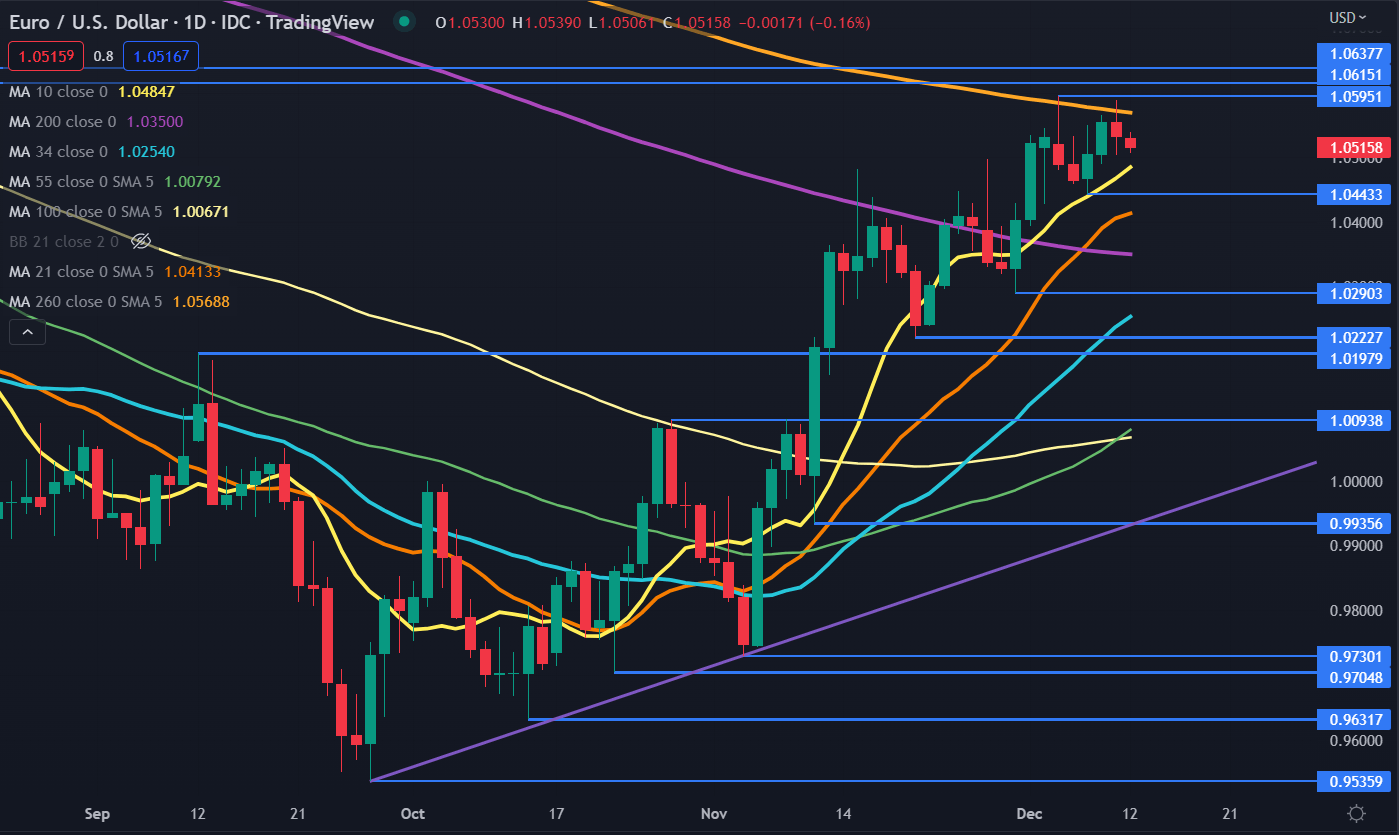
EUR/USD has been rallying since making a twenty-year low at 0.9536 in October. It traded as high as 1.0595 but it has been unable to overcome a breakpoint and previous peak at 1.0615 and 1.0638 respectively. These levels may continue to offer resistance.

The 260-day simple moving average (SMA) was also in that region and could also provide resistance, currently at 1.0569.

On the downside, support might be at the prior lows and breakpoints of 1.0443, 1.0290, 1.0223 and 1.0198.

image1.png

eurusd-price-forecast-euro-to-us-dollar-price-prediction-768x419

US Dollar Technical Outlook: USD/SGD, USD/PHP, USD/THB, USD/IDR. Will Support Hold?

Singapore Dollar Technical Outlook – Neutral

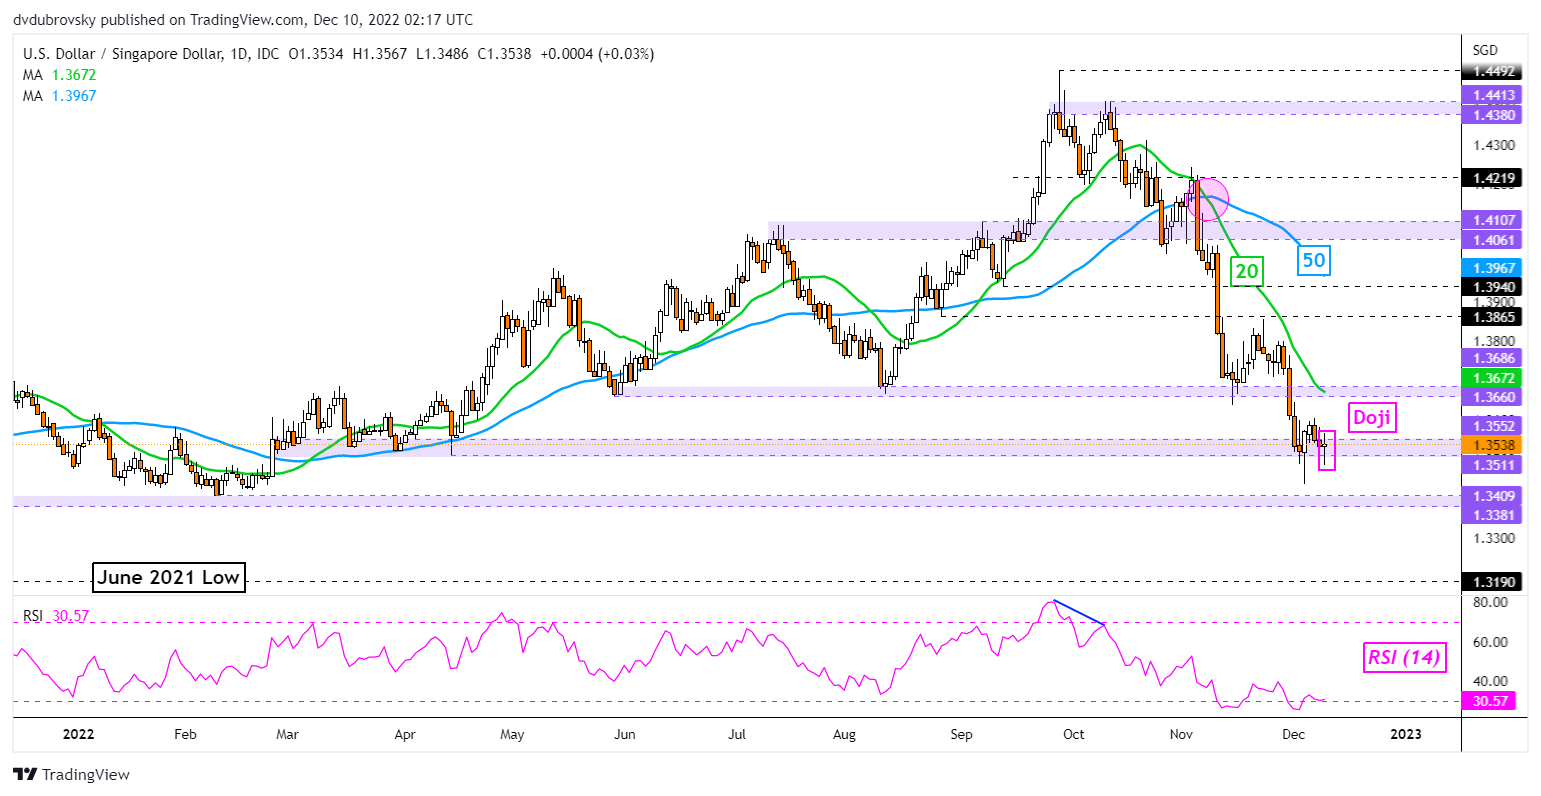
The Singapore Dollar ended flat against the US Dollar this past week, with USD/SGD unable to drop under the key 1.3511 – 1.3552 support zone from March. Prices left behind a Doji candlestick pattern, which is a sign of indecision. Still, the 20- and 50-day Simple Moving Averages (SMAs) remain titled lower, offering a downside technical bias. Clearing the former may open the door to a bullish reversal. Otherwise, extending losses exposes the 1.3381 – 1.3409 zone below.

USD/SGD Daily Chart

USD/SGD Daily Chart

Chart Created in TradingView

Philippine Peso Technical Outlook – Slightly Bullish

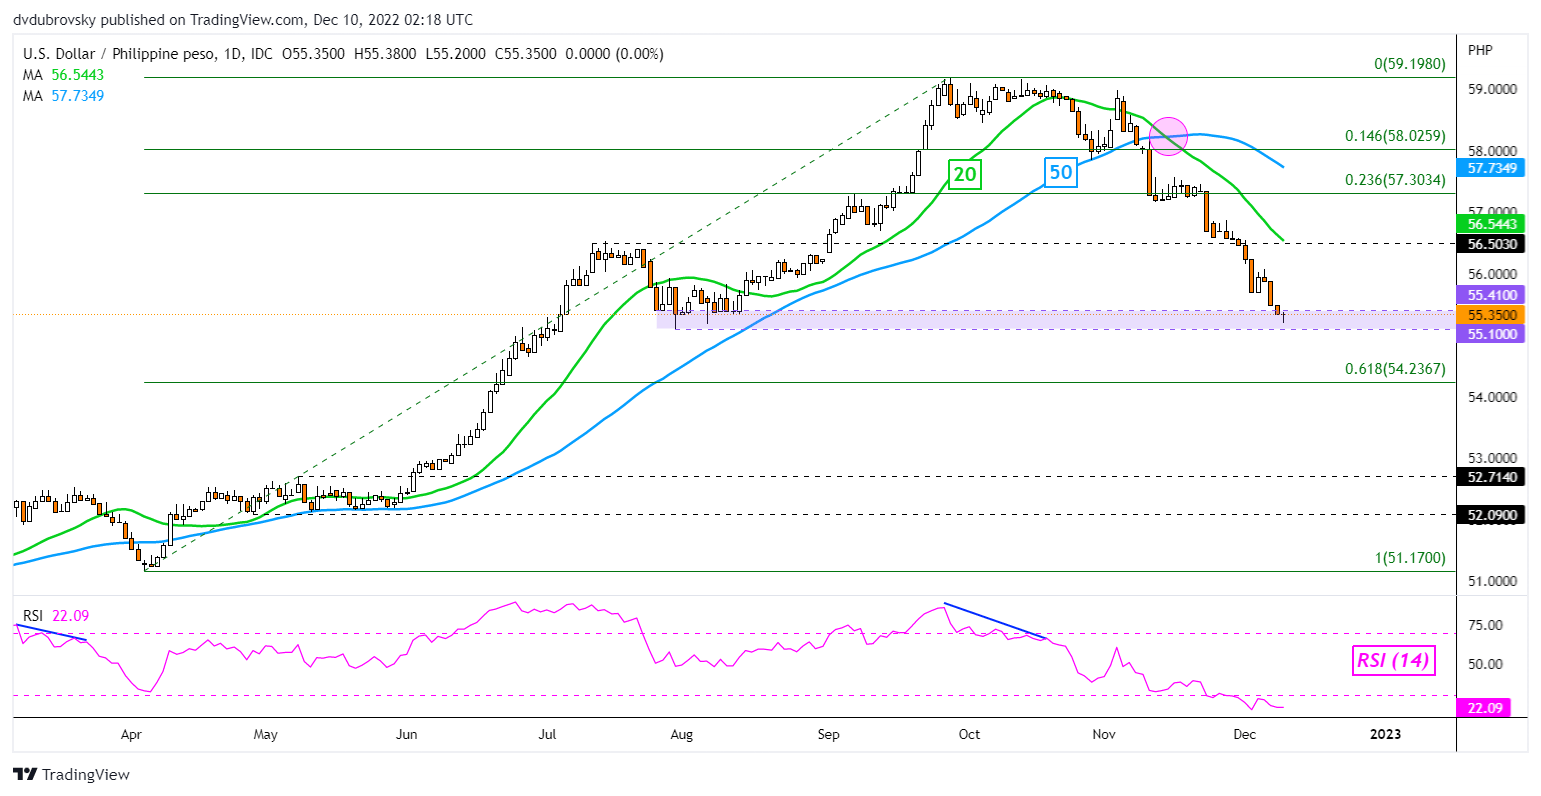
The Philippine Peso extended gains against the US Dollar this past week. While this is a clear bullish sign for the currency, USD/PHP is now testing the critical 55.10 – 55.41 support zone. The latter has its beginnings in August. If it holds, we may see prices pivot higher toward the 20-day SMA, which can reinstate the downside bias. Extending losses expose the 61.8% Fibonacci retracement level at 54.236.

The Fundamentals of Breakout Trading

Recommended by Daniel Dubrovsky

The Fundamentals of Breakout Trading

Get My Guide

USD/PHP Daily Chart

USD/PHP Daily Chart

Chart Created in TradingView

Thai Baht Technical Outlook – Neutral

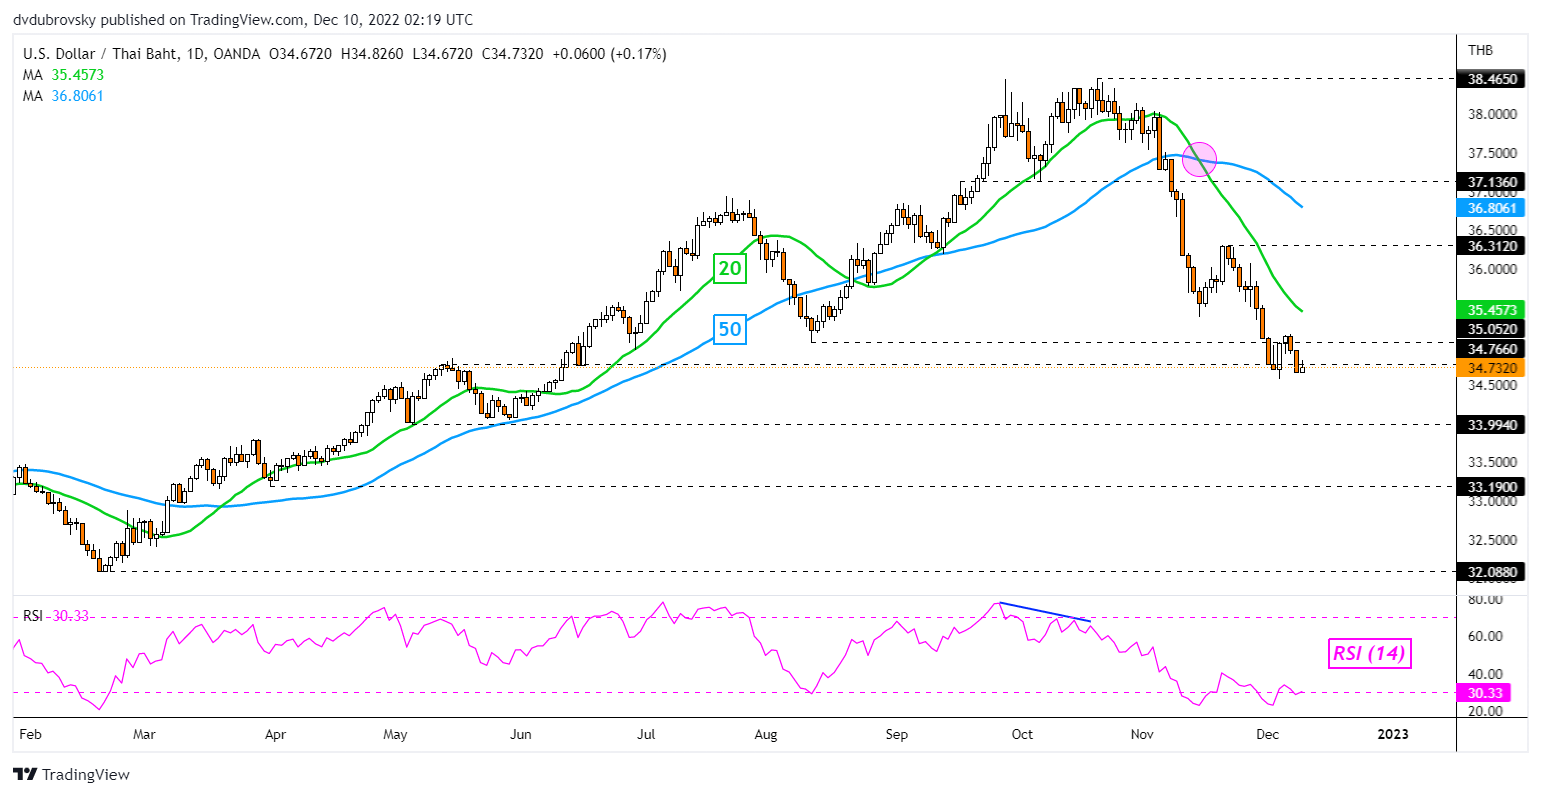
The Thai Baht was little changed against the US Dollar this past week. This leaves USD/THB facing the familiar 34.76 inflection point, which held as support. Confirming a downside breakout exposes the May low at 33.994 and downtrend resumption. On the other hand, keep a close eye on the 20-day SMA, which is maintaining the downside focus. The latter could hold as key resistance in the week ahead.

USD/THB Daily Chart

Thai Baht Technical Outlook – Neutral

Chart Created in TradingView

Indonesian Rupiah Technical Outlook – Neutral

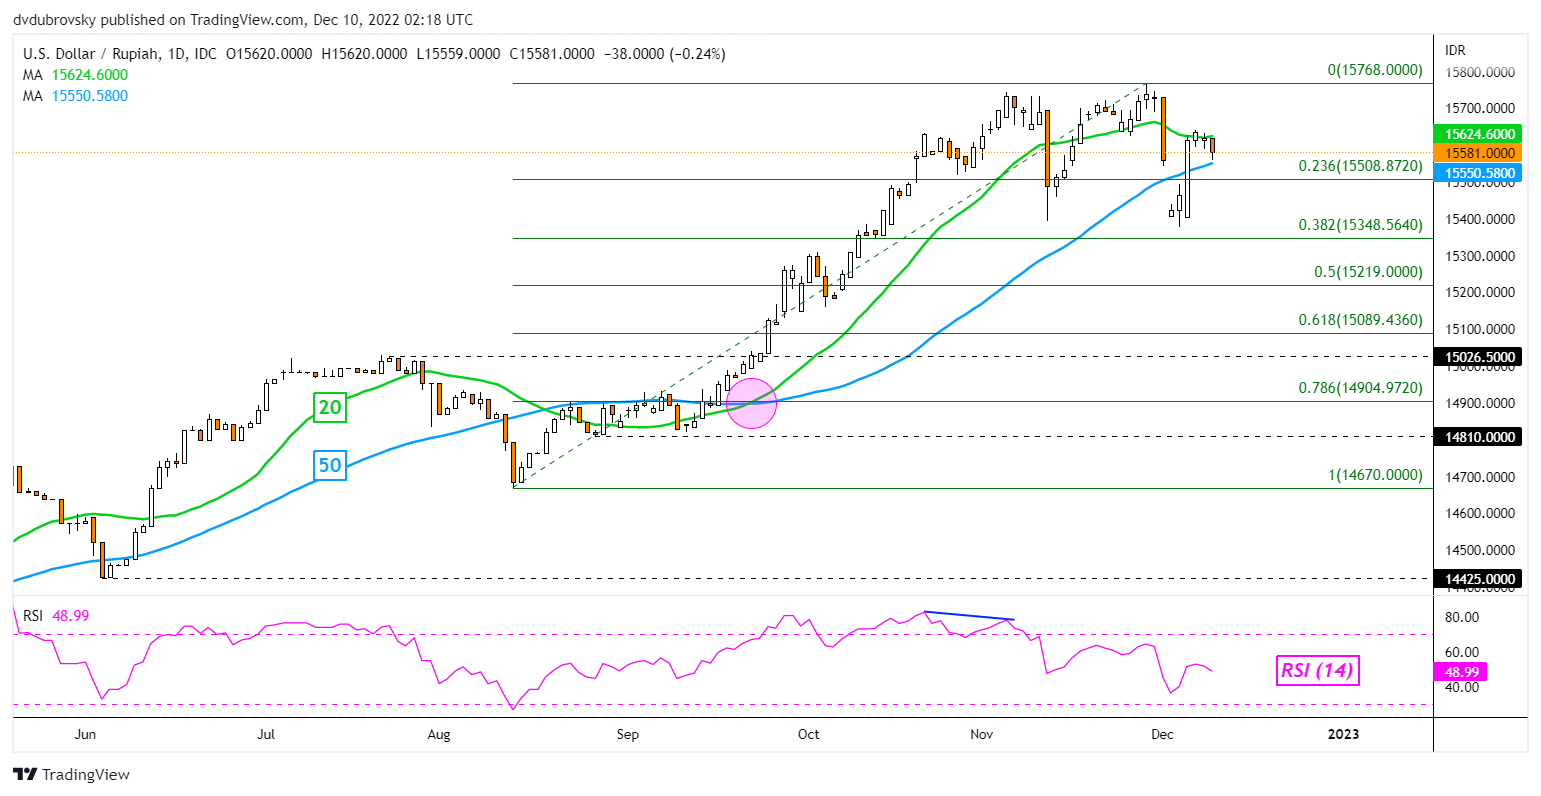
The US Dollar finished slightly higher against the Indonesian Rupiah last week, leaving USD/IDR above the 23.6% Fibonacci extension at 15508. The pair also was unable to hold a breakout under the 50-day SMA. This is leaving a neutral position for the exchange rate in the week ahead. Breaking above the 20-day SMA exposes the November high at 15768. Clearing support on the other hand exposes the 38.2% Fibonacci retracement level at 15348.

USD/IDR Daily Chart

USD/IDR Daily Chart

Chart Created in TradingView

litefinance-blog-audusd-05-04-22-768x419

GBP Weekly Outlook: Resilient Pound Prepares for Data Heavy Week

GBP/USD FUNDAMENTAL FORECAST: BEARISH

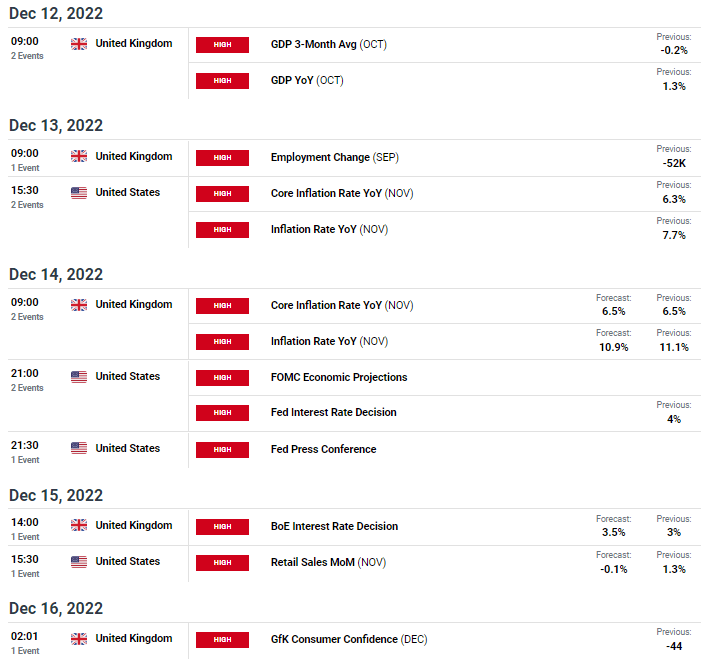
The British pound heads into a central bank fueled week relatively stout after the USD failed to capitalize on better than expected economic data (PPI and Michigan consumer sentiment) last Friday. This comes after robust labor data (NFP) and strong ISM services PMI data. It seems as if markets are holding off on this data in preparation for the plethora of data points scheduled next week – see economic calendar below. While there is much in the way of UK centric data, the U.S. core inflation read and Federal Reserve interest rate decision will likely be the focal point for global markets. The Fed has been divided by the aforementioned positive data and contrasting softer inflation without the guidance from Fed officials during this FOMC blackout period.

GBP/USD ECONOMIC CALENDAR

image1.png

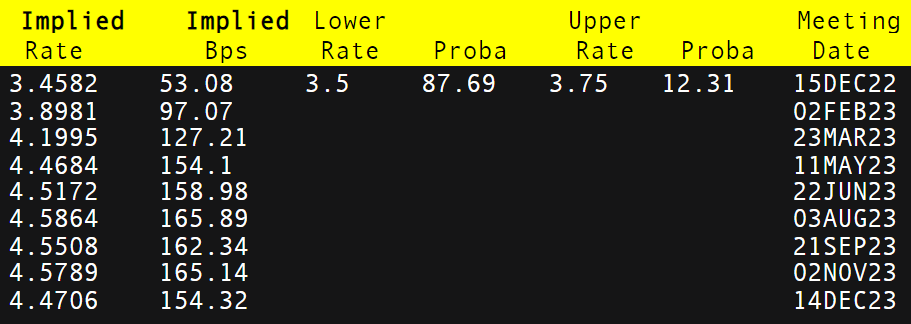
From a UK perspective, housing prices have been exhibiting a decline due to tightening monetary policy and with fiscal policy in line with the Bank of England (BoE), next week’s rate decision is likely to remain at the 50bps mark. Currently, money markets are in agreement with this conjecture with an almost 88% probability (refer to table below). The same is true for the Fed which leaves little in the way of a surprising announcement by either central bank. The Fed press conference will be take center stage with markets awaiting Fed Chair Jerome Powell’s statement. His prior statement mentioned moderating future rate hikes and was naturally taken in a dovish manner. The U.S. core inflation read could change this rhetoric should it beat estimates, highlighting inflationary pressures in the region and the need for tight monetary policies.

BANK OF ENGLAND INTEREST RATE PROBABILITIES

image2.png

ECHNICAL ANALYSIS

GBP/USD DAILY CHART

image3.png

gold_246-768x419

XAU/USD Price Forecast: Gold Prices Dimmed by Silver’s Shine

Gold Trades Cautiously While Silver Bulls March On

Gold and silver have been trading higher over recent weeks as the US Dollar surrenders a portion of its recent gains.

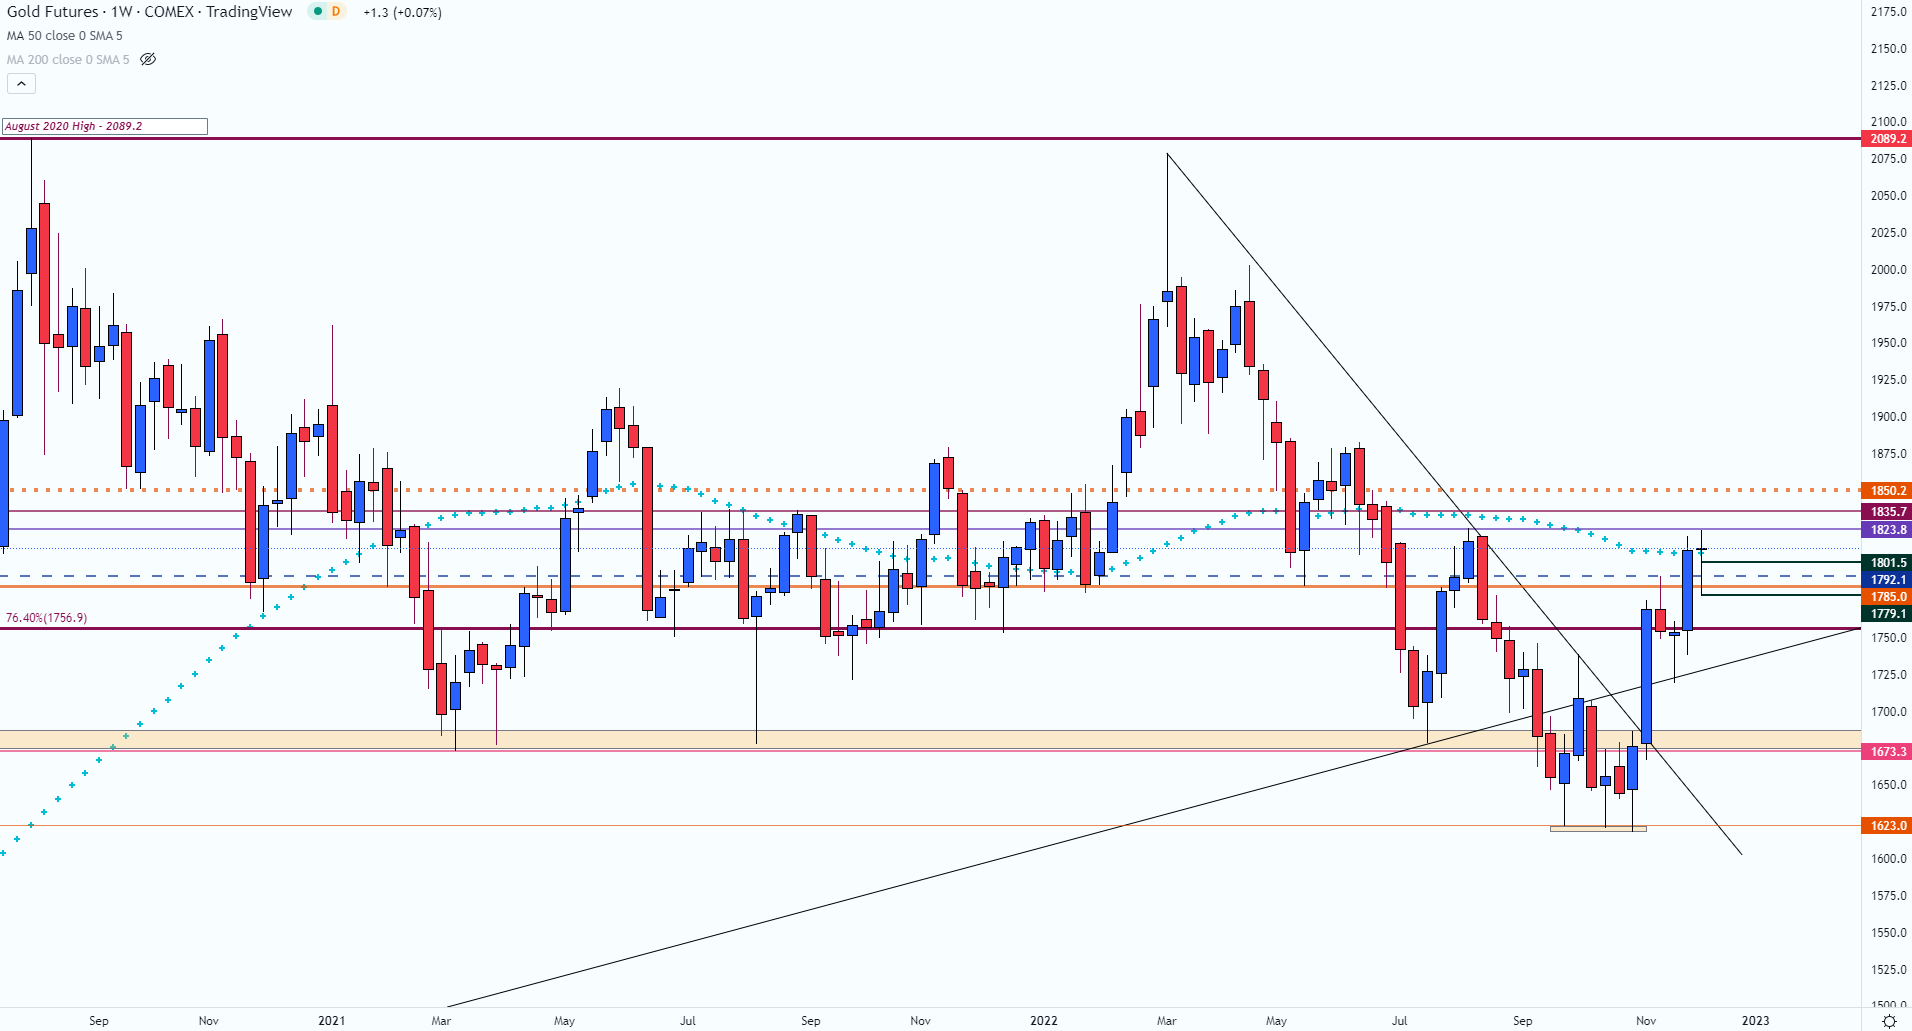
With XAU/USD currently trading above the key psychological level of 1800, this week’s price action remained subdued. As fundamental intensity eased and technical levels took centerstage, gold prices failed to gain traction, ending the week flat.

While the formation of a doji candle on the weekly chart forms around the 50-week MA (moving average) at 1807, next week’s event risk could drive the short-term move.

As central banks remain focused on taming inflation through restrictive monetary tightening, higher interest rates have been priced in leaving recession risks at the forefront of risk appetite.

XAU/USD Weekly Chart

Chart, histogram  Description automatically generated

Gold (XAU/USD) Technical Analysis

After rising to a high of 2078.8 in March, the Federal Reserve announced its first 75 basis point rate hike, supporting Dollar strength. With the hawkish narrative triggering a seven-month decline, XAU/USD fell into a tight zone of support between 1623 – 1618.

As this range helped cap the September – November lows, a rejection of the candlewicks highlights the importance of this zone. However, with the resurgence of bullish momentum driving price action above prior trendline resistance, prices continued to climb before peaking at 1823.8.

XAU/USD Daily Chart

Chart, histogram  Description automatically generated

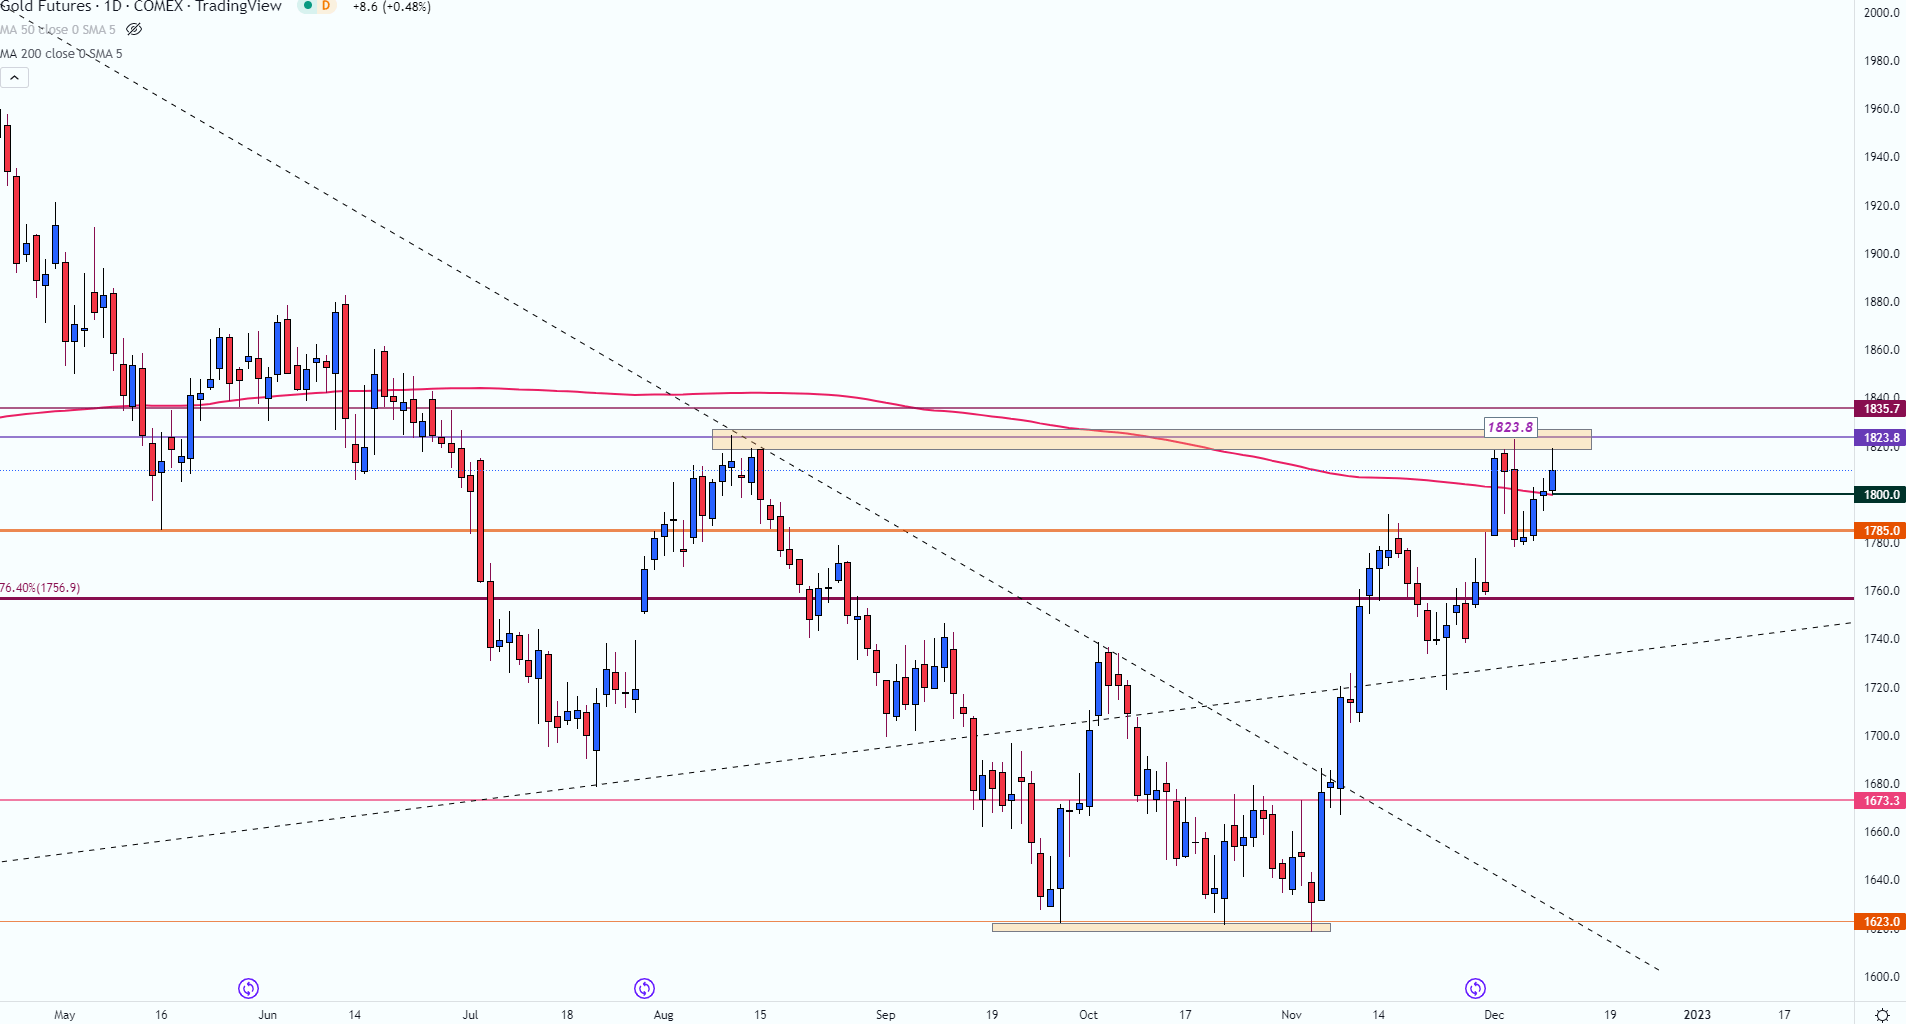
With body of the daily candle resting above 1800, this level coincides with the 200-day MA (moving average). As investors prepare for another FOMC, BoE (Bank of England) and ECB (European Central Bank) rate decision, inflation and sentiment data could fuel a move in either direction.

If recession fears ease and the Dollar gains ground, XAU/USD could fall below 1800 while the weekly low provides additional support around 1780. An increase in bearish momentum below this level could pave the way for a retest of 1760 and a move towards trendline support around 1720.

GoldMixed

Data provided by

Change inLongsShortsOI
Daily-7%4%-4%
Weekly3%2%3%

What does it mean for price action?

Get My Guide Silver (XAG/USD) Technical Analysis

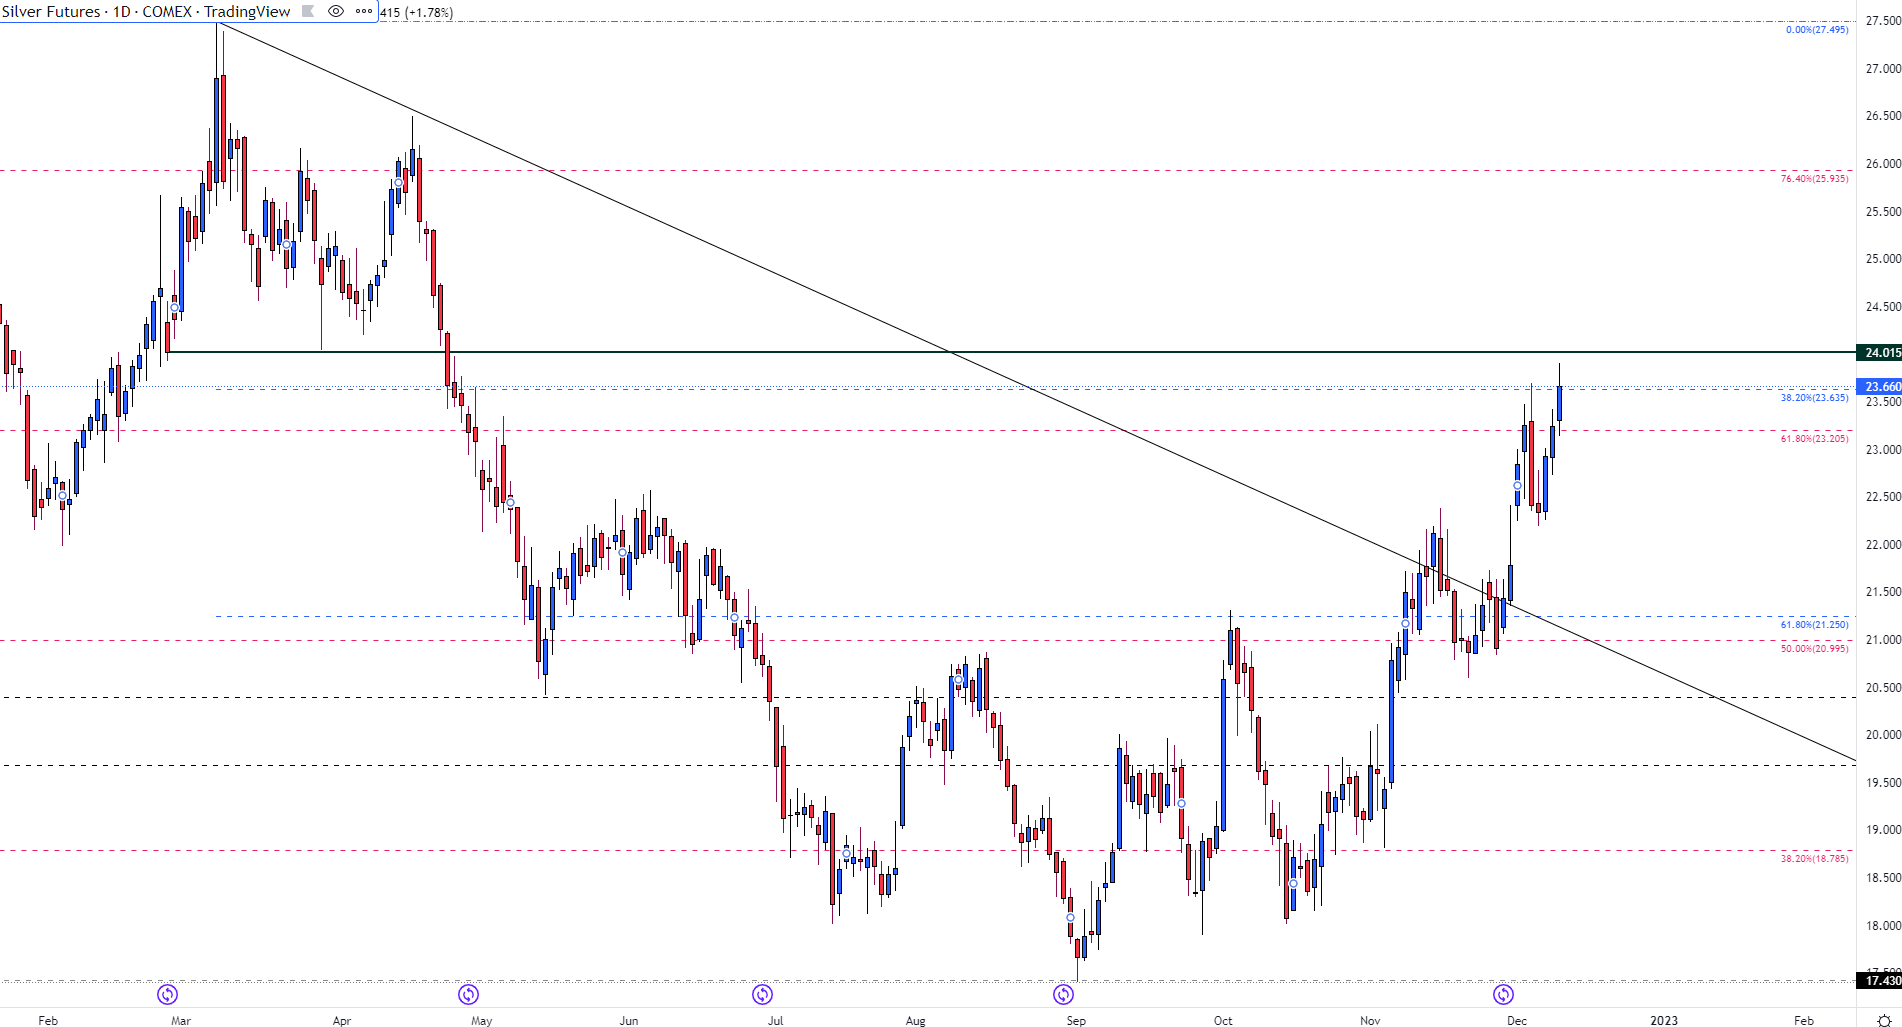
As Silver prices aim to break through Fibonacci resistance of the 2021 – 2022 move at 23.635, a hold above this level could drive XAG/USD back to the next big zone of resistance at 24.00 and towards 25.00. With the 23.00 and 22.00 psychological levels holding as support, a move lower could fuel bearish momentum back towards 21,25.

Silver (XAG/USD) Daily Chart

Graphical user interface, chart  Description automatically generated
Crude-Oil

Crude Oil Forecast: Brent Overcome by Recessionary Pressures Despite Several Fundamental Tailwinds

BRENT CRUDE OIL FUNDAMENTAL BACKDROP

Brent crude oil remains under pressure despite trading marginally higher this Friday. Crude oil fundamentals including both API and EIA weekly crude inventory numbers showing bigger declines than expected have not been enough to overcome global recessionary fears. In addition, the Keystone pipeline in the U.S. has been shut down due to the largest crude oil spills in roughly ten years. Crude oil’s pushback today is largely attributed to this hit to supply however, the worsening COVID situation in China is hampering hopes for a positive China re-open whereby demand for crude should theoretically increase. The EU’s G7 price cap on Russian oil is yet another uncertainty in the crude oil equation with Russia not showing signs of clarity around their response function just yet. While they have stated that they will not accept the price cap, supply cuts have not yet been actioned which could give crude a boost.

Trade Smarter – Sign up for the DailyFX Newsletter

Receive timely and compelling market commentary from the DailyFX team

Subscribe to Newsletter

This leaves the global slowdown rhetoric at the forefront of price limitations for crude oil and with further interest rate hikes scheduled for next week, the impact on consumer demand and economic growth will be negatively affected.

From a USD perspective, PPI and Michigan consumer sentiment will be key ahead of next week’s Federal Reserve interest rate decision because of the recent FOMC blackout period whereby Fed officials are unable to provide input. As of now, the Fed is being divided into dovish and hawkish camps, with doves receiving support from softening inflation while hawks more recently garnered provisions from a tight labor market (NFP beat) and more recently the ISM services print. The depressed greenback may be looking to turnaround post FOMC which could weigh on crude oil despite December being an historically weaker month for the dollar.

ECONOMIC CALENDAR

image1.png

Source: DailyFX economic calendar

TECHNICAL ANALYSIS

BRENT CRUDE (LCOc1) DAILY CHART -UNDATED

image2.png

Chart prepared by Warren Venketas, IG

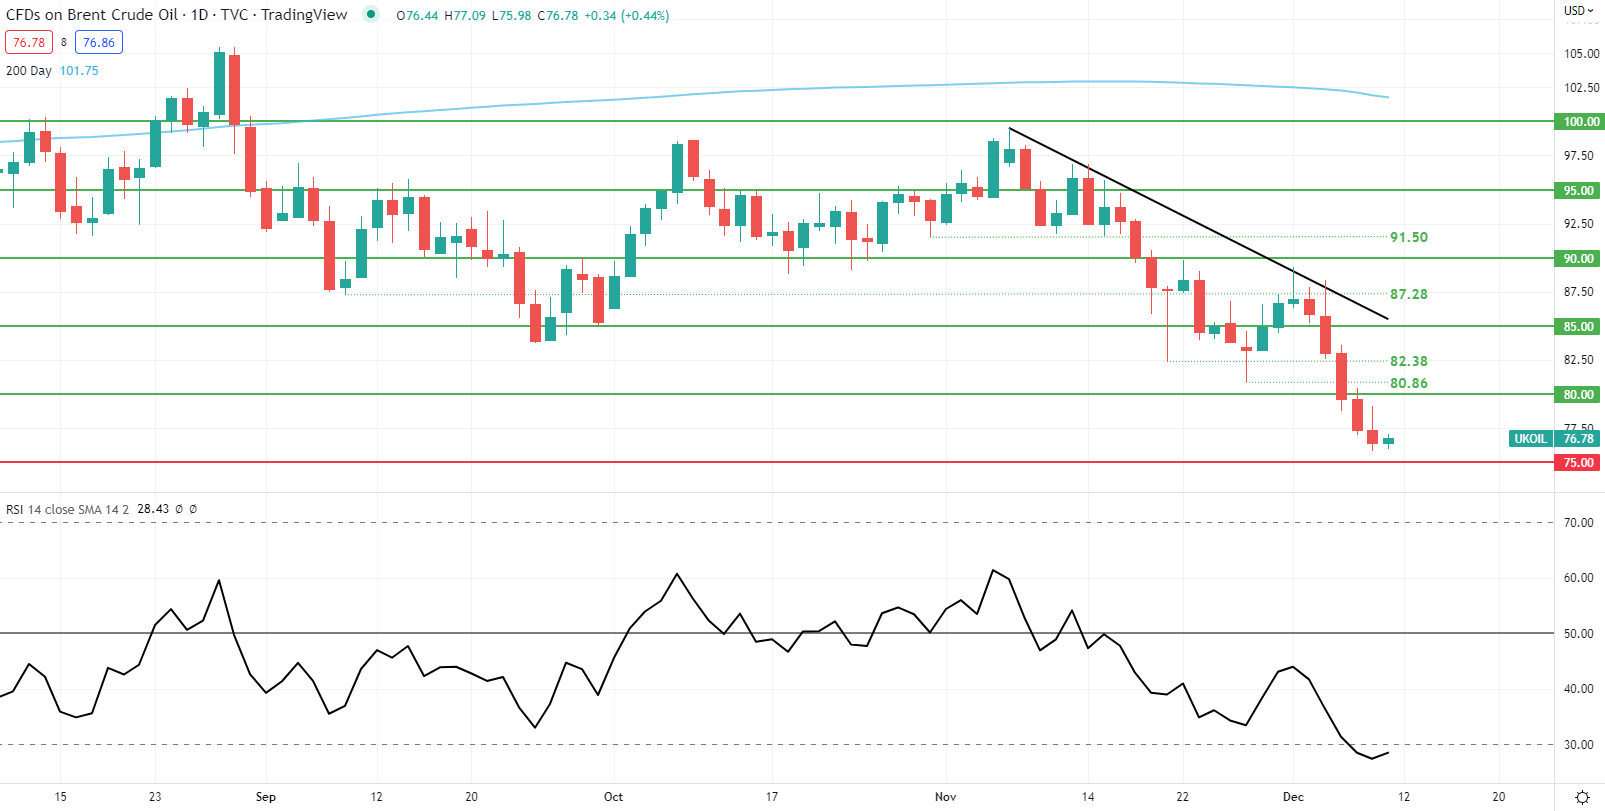
Daily Brent crude price action shows the 75.00 psychological support handle coming under pressure however, the Relative Strength Index (RSI) may suggest slowing bearish momentum with the RSI currently in oversold territory. This could give bulls some hope particularly if U.S. economic data misses forecasts giving crude oil a boost from the weaker greenback.

1080 1080 9 (1)

Become Best IB in Nigeria

Compete for the main prize of the year – Hyundai Tucson, or win one of three travel packages worth $5,000 or of seven MacBooks Pro, plus get extra money incentive prizes each month!

Become LiteFinance’s partner now:
https://bit.ly/3FAbENb

More information about the contest:
08166635848
Go ahead, give it your best shot!
Best Regards,
LiteFinance Nigeria

08166635848