AUD/USD Forecast – Aussie Continues to Hesitate

Australian Dollar vs US Dollar Technical Analysis

The Australian dollar initially tried to rally during the trading session on Thursday, but continues to struggle with the 0.65 level. At this point, we ended up forming a bit of a shooting star again, just as we did during the Wednesday session. The 0.65 level is an area that previously has been important, and it now looks as if it is going to remain that way. Furthermore, you have to keep in mind that the jobs number comes out on Friday and that is a major influence as to where things go from here.

Trading Derivatives carries a high level of risk to your capital and you should only trade with money you can afford to lose. Trading Derivatives may not be suitable for all investors, so please ensure that you fully understand the risks involved, and seek independent advice if necessary. A Product Disclosure Statement (PDS) can be obtained either from this website or on request from our offices and should be considered before entering into a transaction with us. Raw Spread accounts offer spreads from 0.0 pips with a commission charge of USD $3.50 per 100k traded. Standard account offer spreads from 1 pips with no additional commission charges. Spreads on CFD indices start at 0.4 points. The information on this site is not directed at residents in any country or jurisdiction where such distribution or use would be contrary to local law or regulation.

All things being equal, this is a market that I think will continue to move back and forth with the idea of global growth, which of course is a bit of a mess at the moment. The Australian dollar is highly sensitive to commodity markets, which of course are also influenced by the Asian markets. Underneath, the 0.64 level could be an area that a lot of people pay close attention to, and if we break down below there, then the market probably goes down to the 0.6250 level.

Alternatively, if we were to break above the top of the shooting star from the Wednesday session, then it’s possible that we could go looking to the 50-Day EMA, and then perhaps to the 0.66 level after that. That’s an area that I think would be a very difficult level to overcome. Quite frankly, we would need to see a very poor jobs number on Friday to make that happen anytime soon. After all, people are starting to look around the world and try to determine whether or not the Federal Reserve could start loosening its monetary policy. If it does, that obviously would be good for the Aussie, or perhaps more specifically, bad for the US dollar.

In general, I think this is a market that is setting up for a consolidation range, but if we can break out of the area, then we could have a bigger move given enough time. Ultimately, I do think the downside works a little easier than the upside, but we will have to wait and see how that plays out.

Gold Price Forecast – Gold Markets Stutter

Gold Market Technical Analysis

Gold has found itself a bit stagnant at the open of the Thursday trading session, as we continue to see a lot of questions when it comes to whether or not inflation is under control. Yes, inflation is dropped quite a bit in the United States since its peak, but at the same time it’s also worth noting that we have a little bit of a situation where the market continues to bounce around just above the 50-Day EMA, and its deftly worth noting that the jobs number on Friday will have a major influence where we go next. In the short term, I’m not overly excited about going long of gold quite yet, but I would like to pick up some type of dip if I get the opportunity.

Trading Derivatives carries a high level of risk to your capital and you should only trade with money you can afford to lose. Trading Derivatives may not be suitable for all investors, so please ensure that you fully understand the risks involved, and seek independent advice if necessary. A Product Disclosure Statement (PDS) can be obtained either from this website or on request from our offices and should be considered before entering into a transaction with us. Raw Spread accounts offer spreads from 0.0 pips with a commission charge of USD $3.50 per 100k traded. Standard account offer spreads from 1 pips with no additional commission charges. Spreads on CFD indices start at 0.4 points. The information on this site is not directed at residents in any country or jurisdiction where such distribution or use would be contrary to local law or regulation.

The 200-Day EMA sits right around the $1920 level, and I think that area between the indicator and the $1900 level will have to be watched closely by traders around the world to get a handle on what happens next. With that being the case, as long as we can stay above that area I think that this is a market that still has an opportunity to go to higher levels, perhaps reaching as high as $2000 given enough time.

Ultimately, I do think that we got a situation where we will eventually break out to the upside, and we are in the midst of forming a massive “W pattern.” If that is in fact going to be the case, then the “measured move is going to be for gold to hit the $2200 level eventually. That doesn’t mean that it happens anytime soon, just that we could be going there before it’s all said and done. Keep in mind that the jobs number is followed by a Labor Day on Monday, meaning that liquidity might be an issue for the next couple of trading days. However, as we get deeper into the month of September, it’s very likely that we continue to see more liquidity coming into the market, finally giving us a little bit more believability in the trade to the upside as more participants express their views.

US Core PCE Meets Expectations; Consumer Spending Skyrockets 0.8% in July

Price Index Movements

For July, the PCE price index went up by 0.2%. While goods prices dipped by 0.3%, services prices experienced a 0.4% rise. Excluding the volatile food and energy sectors, the PCE price index recorded a 0.2% increase. When contrasted with the same month from the previous year, the PCE price index surged by 3.3%. Remarkably, while goods prices dropped by 0.5%, the services sector saw a notable 5.2% ascent.

Real PCE Analysis

Real PCE, which strips out the effects of inflation, saw an overall increase of 0.6% in July. Goods spending led this rise with a 0.9% jump, with the “other” nondurable goods and recreational goods sectors acting as primary contributors. Within the services domain, the main drivers were food services, financial services, and housing utilities.

Personal Income and Consumer Spending

In July, personal income saw an increase of $45.0 billion, marking a 0.2% monthly growth. Concurrently, disposable personal income (DPI) – the total personal income minus current personal taxes – registered a marginal increase of $7.3 billion, which is less than 0.1%. The focus was also on personal consumption expenditures (PCE), with consumer spending shooting up by $144.6 billion, translating to a 0.8% surge.

Insights on Expenditures

Breaking down the surge in consumer spending, services took the lead with a whopping increase of $102.7 billion, dominated by financial services and insurance. This was primarily driven by portfolio management and investment advisory services. Other notable sectors contributing to this increase include housing and utilities, food services, and health care. On the goods front, spending saw an increment of $41.9 billion, mainly from “other” nondurable goods, predominantly pharmaceuticals and recreational items.

Oil Prices Forecast: Navigating China’s Slump Amid OPEC Production Cuts

Oil Prices Navigating Through Choppy Waters

Oil prices hit a snag on Thursday after disappointing Chinese manufacturing data emerged, while traders are also keeping an eye on forthcoming U.S. economic metrics. With conflicting global economic signs and geopolitical tensions at play, the oil market finds itself at a crossroads.

The Chinese Factor and U.S. Data

Manufacturing activity in China contracted for the fifth consecutive month, signaling a weak outlook for the world’s second-largest economy. Concurrently, traders are awaiting the release of U.S. Personal Consumption Expenditure (PCE) data. This U.S. indicator is crucial, as it could influence Federal Reserve policy, affecting demand conditions for oil.

Trading Derivatives carries a high level of risk to your capital and you should only trade with money you can afford to lose. Trading Derivatives may not be suitable for all investors, so please ensure that you fully understand the risks involved, and seek independent advice if necessary. A Product Disclosure Statement (PDS) can be obtained either from this website or on request from our offices and should be considered before entering into a transaction with us. Raw Spread accounts offer spreads from 0.0 pips with a commission charge of USD $3.50 per 100k traded. Standard account offer spreads from 1 pips with no additional commission charges. Spreads on CFD indices start at 0.4 points. The information on this site is not directed at residents in any country or jurisdiction where such distribution or use would be contrary to local law or regulation.

Geopolitical Uncertainties and Supply Cuts

Geopolitical elements are also in the limelight, with a military coup in Gabon adding another layer of complexity to OPEC’s supply outlook. On the production side, Saudi Arabia is likely to extend its voluntary oil cut of 1 million barrels per day into October, bolstered by OPEC+ allies led by Russia. This production pullback has been a bullish factor against bearish demand indicators.

Global Economic Metrics and Supply Chain

The U.S. recently downgraded its GDP growth to 2.1%, and data showed a slowdown in private payroll growth. Meanwhile, LNG markets are tense as industrial action in Australia casts doubt over supplies heading into winter. Further complicating the matter, sanctions and geopolitical shifts have made India and China Russia’s top oil clients, changing the calculus of global oil trade.

Short-Term Forecast

Despite these uncertainties, the market sentiment leans slightly bullish. Prices are expected to see a moderate uptick, driven by tighter supplies and ongoing geopolitical tensions. However, traders should exercise caution as both demand and supply factors remain volatile, and upcoming U.S. PCE data could sway the market.

In a world of conflicting data and geopolitical chess, oil prices are delicately balanced on the fulcrum of supply and demand. Keep a close eye on key metrics and geopolitical events; the next move could tip the scale.

Technical Analysis

Light Crude Oil Futures
4-Hour Light Crude Oil Futures

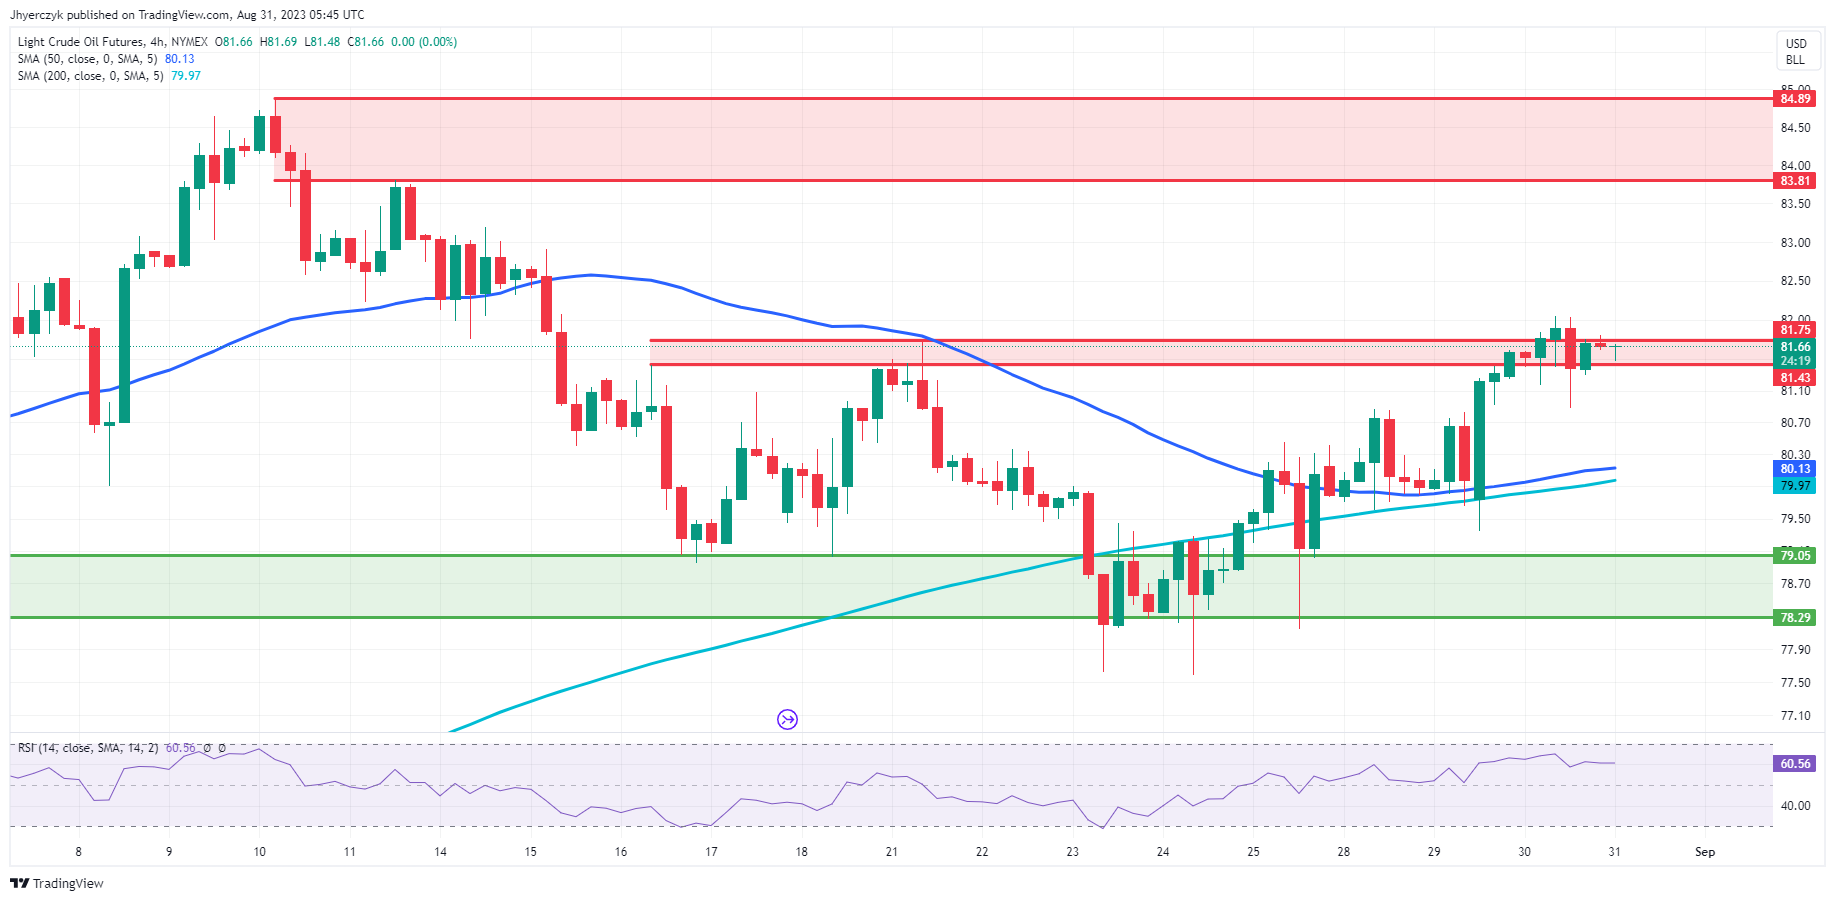
The Light Crude Oil Futures currently stands at 81.68, slightly above its previous 4-hour price of 81.66. The current price is trading inside the main resistance area (81.75 to 81.43) and is above both the 200-4H moving average (79.97) and the 50-4H moving average (80.13). This suggests the commodity is maintaining its strength in the near term. The 14-4H RSI reads 60.82, indicating slightly stronger bullish momentum without entering overbought territory.

With the price being nearer to the main resistance and trading well above the moving average support, the market sentiment for Light Crude Oil Futures appears modestly bullish.

US Dollar Index News: Will Key US Indicators Undermine DXY’s Bullish Streak?

Dollar’s Swaying Fortunes

The U.S. Dollar Index (DXY) is showing a mixed bag of performance. Although up by 1.4% this month, it has lost 0.8% over the week. Hopes of persistent high-interest rates had previously fueled the dollar, but signs of decelerating U.S. spending and hiring are tapering this week’s gains.

Influencing Economic Indicators

Key indicators await, poised to sway the dollar further. U.S. personal consumption data and core PCE, the Federal Reserve’s primary inflation gauge, are slated for later today. Moreover, a downward revision of U.S. second-quarter growth from 2.4% to 2.1% by the Commerce Department on Wednesday could be a harbinger. On the labor market front, data such as job openings and private payrolls suggest that things may be cooling down.

Trading Derivatives carries a high level of risk to your capital and you should only trade with money you can afford to lose. Trading Derivatives may not be suitable for all investors, so please ensure that you fully understand the risks involved, and seek independent advice if necessary. A Product Disclosure Statement (PDS) can be obtained either from this website or on request from our offices and should be considered before entering into a transaction with us. Raw Spread accounts offer spreads from 0.0 pips with a commission charge of USD $3.50 per 100k traded. Standard account offer spreads from 1 pips with no additional commission charges. Spreads on CFD indices start at 0.4 points. The information on this site is not directed at residents in any country or jurisdiction where such distribution or use would be contrary to local law or regulation.

Euro and ECB Uncertainty

The euro, at $1.0872, retreated by 0.5% today despite being up nearly 1% for the week. German policymaker Isabel Schnabel’s guarded comments have sparked uncertainty over a potential European Central Bank rate hike in September. Her cautious tone has led to traders pricing in a 60% chance of rates staying the same next month.

Sterling and Yen: Subdued Performances

The British pound softened to $1.2700, trailing the euro’s modest gains and setting the stage for a monthly fall against the dollar. Meanwhile, the Japanese yen, down 2.4% against the dollar this month, has stabilized around 146 yen per dollar amid mixed economic indicators and cautious governmental intervention.

Short-Term Forecast: Cautiously Bullish

While the dollar has shown robust performance fueled by high-interest rate hopes, the mixed economic data calls for cautious optimism. The indecisiveness in the European and Japanese markets further consolidates the dollar’s comparatively bullish short-term outlook.

Technical Analysis

XRP News: Ripple Executives Unleash SEC Tirade

Bitcoin, Ethereum and XRP Forecast Video for 01.09.23 by Tim Smith

Ripple Labs’ CEO Brad Garlinghouse and Chief Legal Officer Stuart Alderoty have unleashed scathing criticism against the U.S. Securities and Exchange Commission (SEC) in the wake of a significant court victory. The District of Columbia Court of Appeals recently ruled in favor of Grayscale Investments, compelling the SEC to review its decision regarding Grayscale’s spot Bitcoin exchange-traded fund (ETF) application.

Trading Derivatives carries a high level of risk to your capital and you should only trade with money you can afford to lose. Trading Derivatives may not be suitable for all investors, so please ensure that you fully understand the risks involved, and seek independent advice if necessary. A Product Disclosure Statement (PDS) can be obtained either from this website or on request from our offices and should be considered before entering into a transaction with us. Raw Spread accounts offer spreads from 0.0 pips with a commission charge of USD $3.50 per 100k traded. Standard account offer spreads from 1 pips with no additional commission charges. Spreads on CFD indices start at 0.4 points. The information on this site is not directed at residents in any country or jurisdiction where such distribution or use would be contrary to local law or regulation.

The two Ripple executives capitalized on the moment to lambast the SEC’s recent track record. Alderoty took to X, formally known as Twitter, stating that the SEC was “being battered in court.” In addition, he highlighted the court’s negative assessment of the SEC’s actions, including accusations of hypocrisy and a lack of faithful adherence to the law. Alderoty further noted that the SEC was fined for “discovery abuses.”

Garlinghouse Weighs In

Garlinghouse echoed Alderoty’s sentiment, remarking on the recent spate of legal victories against the SEC, which he referred to as a “Summer of Justice.” Moreover, the Ripple CEO expressed disappointment at the necessity of legal action to challenge the SEC’s decisions, describing the securities watchdog as “consistently WRONG on the facts and the law.”

Ripple’s own legal battle with the SEC, which has played out for more than two years, recently saw a New York judge issue a summary judgment in the blockchain payment company’s favor. Nonetheless, the case remains far from resolved, with the SEC planning to appeal parts of the ruling. Ripple’s executives have consistently criticized the SEC’s approach to crypto regulation, arguing that enforcement has taken precedence over clear legal guidelines.

Importantly, these ongoing legal battles highlight the uncertainty surrounding the regulation of digital assets and their ability to influence investor sentiment toward leading cryptocurrencies, such as XRP (XRP), Bitcoin (BTC), and Ethereum (ETH). Additionally, below we use technical analysis to identify important trading levels on the charts.

Technical Analysis:  XRP, Bitcoin and Ethereum

XRP

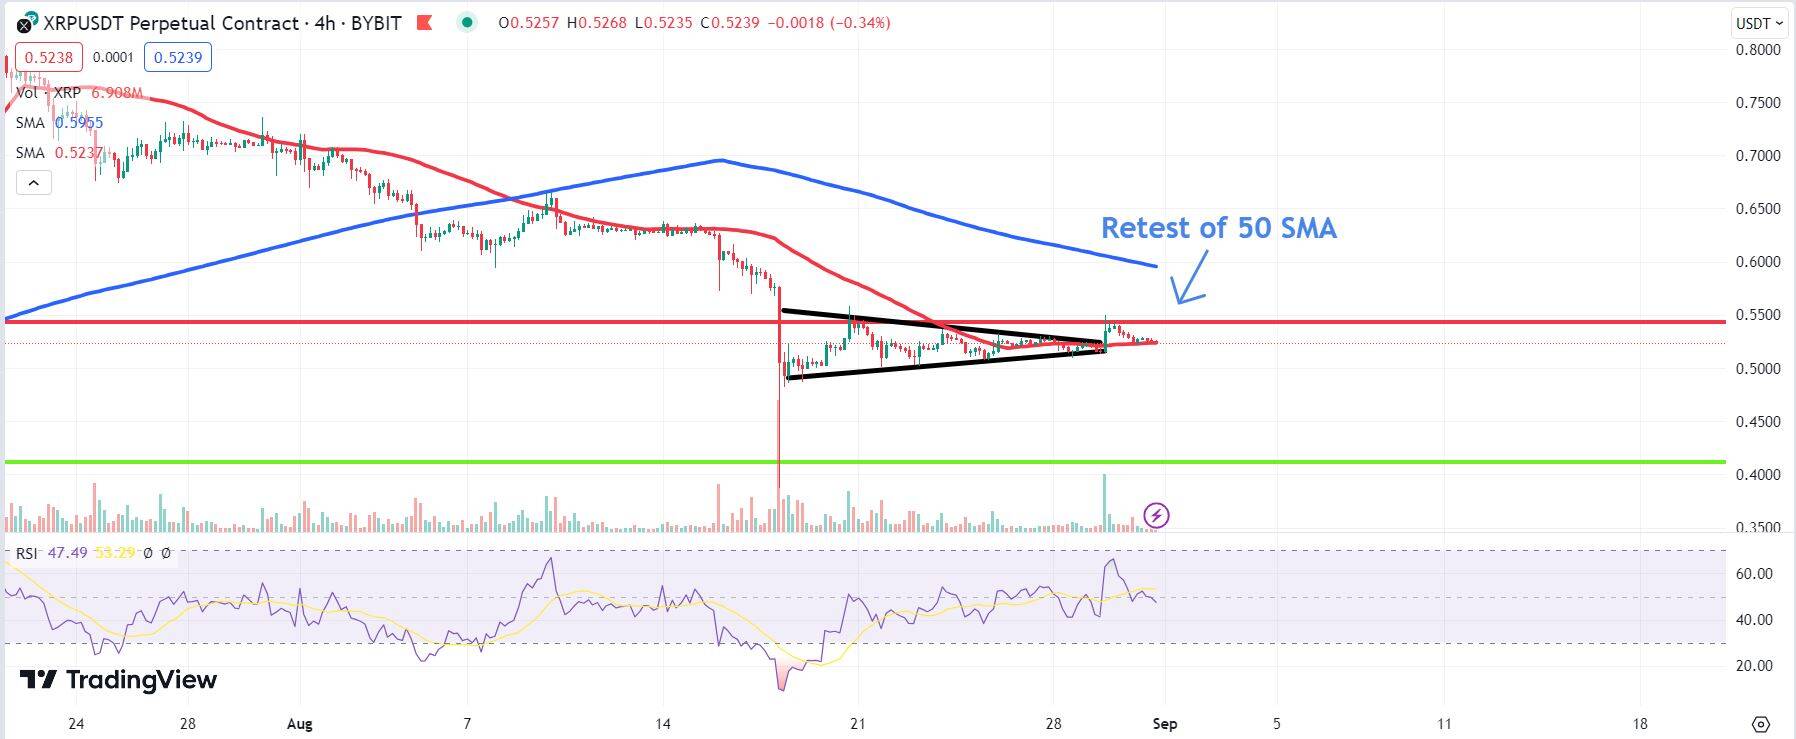
After breaking out above the top trendline of a symmetrical triangle on decent volume, XRP’s price has retraced to the 50 SMA. Providing the indicator acts as support at these levels, bulls may have the confidence to drive price back above crucial resistance at $0.545 and make a run towards the 200 SMA around 0.61. Alternatively, a breakdown here could see bears try and claw a move down to longer-term support at $0.42.

Chart depicting the price of XRP.

Bitcoin

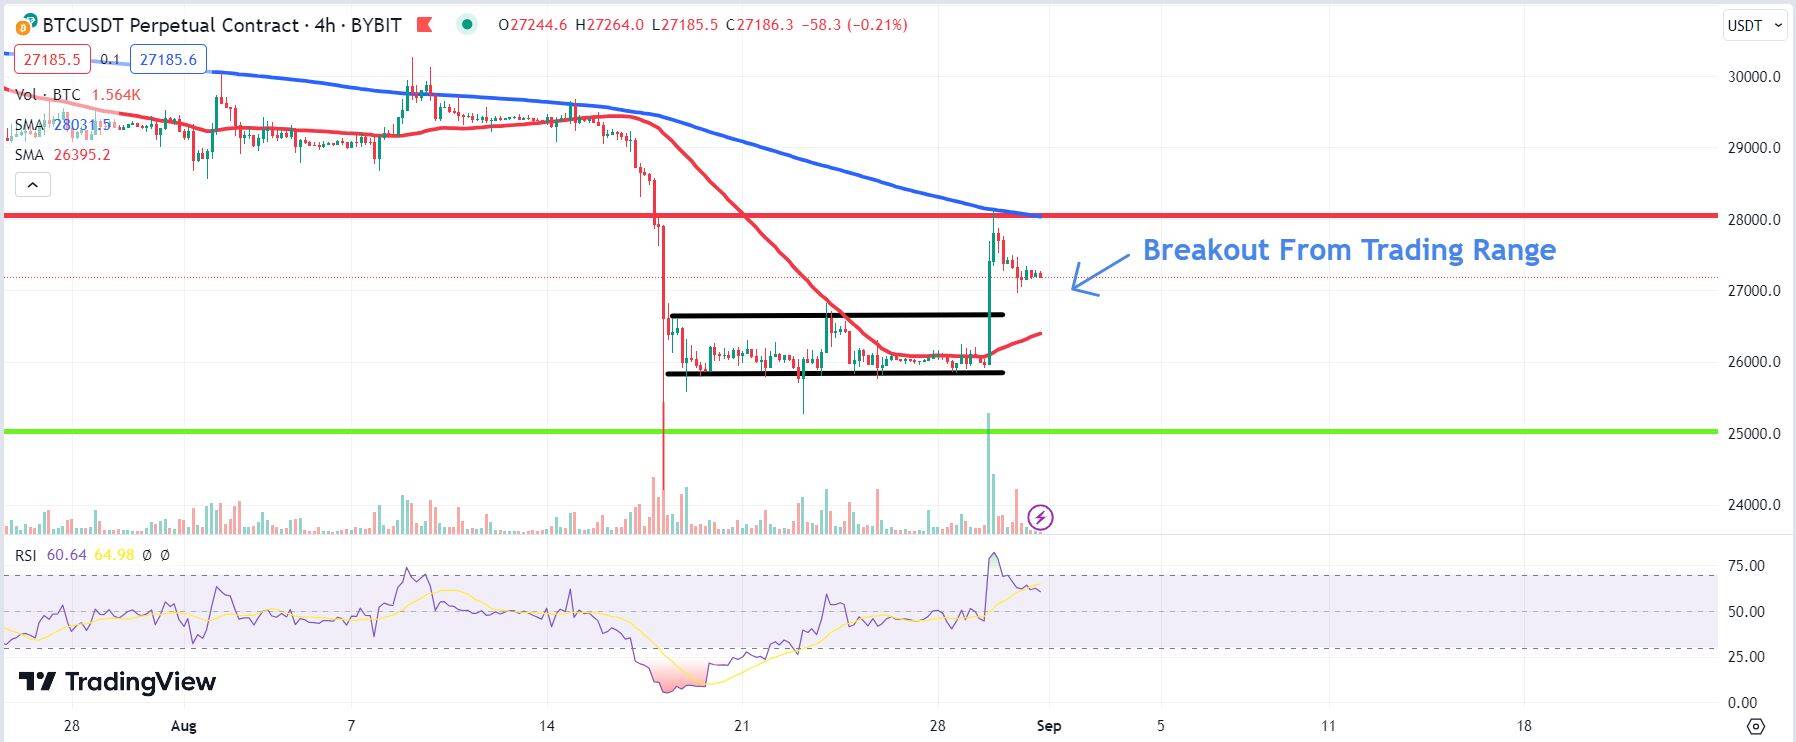
Bitcoin’s price has staged an impressive breakout from a five-day trading range. Importantly, reasonable trading volume accompanied the move, increasing the likelihood of follow-through buying. A successful retest of the previous trading range could see bulls initially target the $28,000. They may then possibly test overhead resistance at $29,000. However, a breakdown below the range’s top trendline could trigger a fall to support at the psychological $25,000 level.

Chart depicting the price of BTC.

Ethereum

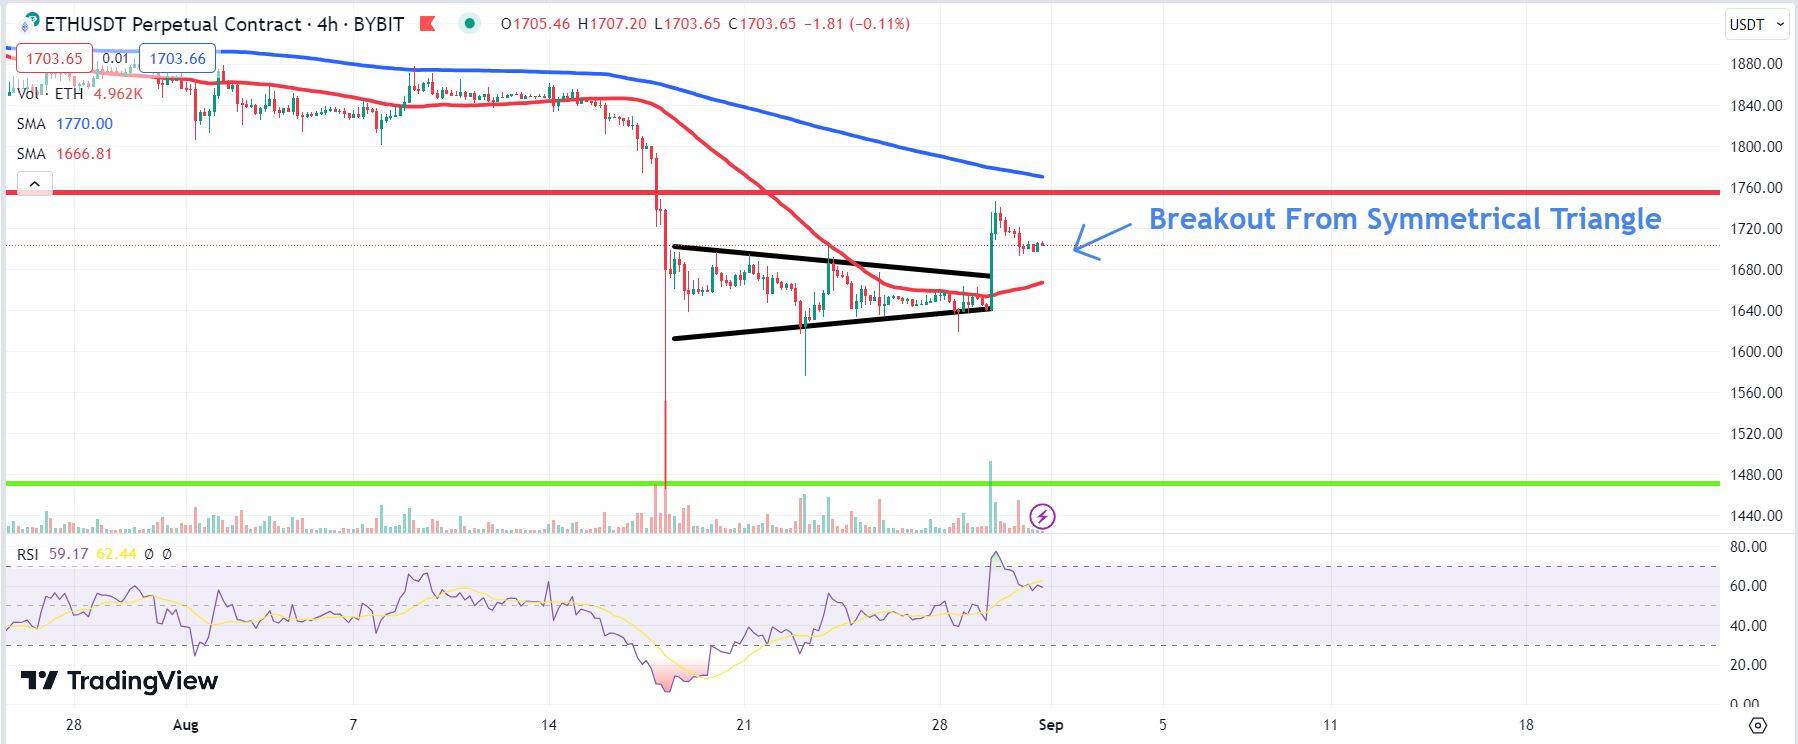
Ethereum’s price has broken above a symmetrical triangle with profit takers locking in gains after the initial move higher. Moreover, the breakout occurred on above-average volume, indicating buyer conviction. Further upside could see bulls test important overhead resistance at $1,757, followed by a possible run towards the $1,820 level. Conversely, a failure to hold above the 50 SMA could see bears reclaim control, which could spark falls to major support around $1,475.

Chart depicting the ETH price.

NASDAQ 100, Dow Jones, S&P 500 News: Salesforce Shines Amid Slowing US Economic Growth

  • pivotal Fed inflation gauge, to inform next moves.

Steady S&P 500 Amid Economic Signals and Earnings Reports

The S&P 500 futures hovered at a plateau Thursday, in line with the recent positive momentum, as investors weighed in on an impressive earnings beat by Salesforce and closely monitored economic indicators. Meanwhile, fresh data showcased a potential cooling in the U.S. economy, hinting at the Federal Reserve’s possible stance in the coming months.

Salesforce’s Stellar Performance & the Broader MarketPost their fiscal second-quarter revelations, Salesforce’s stock surged by over 5%. The software behemoth reported an adjusted earnings of $2.12 per share, surpassing analysts’ expectations of $1.90. The company’s revenue clocked in at $8.60 billion, also nudging past the anticipated $8.53 billion. This commendable performance lent support to the Dow futures, which rose 102 points or 0.29%.

Macro-Economic Indicators & Rate Hike Predictions

Recent data suggests a tempering U.S. economy, particularly after an ADP National Employment report indicated an increase of 177,000 private jobs in August, short of the 195,000 predictions. Moreover, the latest GDP figures revealed a 2.1% growth in the second quarter, a deceleration from the initial 2.4% estimation. These figures are guiding investor expectations about the Federal Reserve’s next moves. The consensus? A probable pause in rate hikes come September.

Economic Spotlight & Investor Moves

Investors remain watchful for July’s personal consumption expenditures data and the non-farm payroll numbers. The former, being the Federal Reserve’s preferred inflation gauge, holds significant weight. Speculations surrounding the Fed’s rate decision have been rife. Notably, bets on unchanged interest rates in September have jumped to nearly 89%. Amid this climate, Nvidia experienced a 1% stock uptick, with $35.5 billion worth of shares exchanged, marking it Wall Street’s most traded entity.

Outlook: A Cautious Optimism

In light of the current economic data and corporate performance, a cautiously bullish sentiment seems to be brewing. Traders are now attuned to forthcoming economic releases to gauge the possible trajectory of the U.S. economy and decipher the Federal Reserve’s next move. However, with the U.S. Labor Day holiday looming, trading activity might remain subdued in the immediate term.

Eurostat: Euro Area’s Inflation Defies Forecasts, Stays at 5.3%

Euro Area Inflation Remains Stable Amid Varied Sector Changes

Euro area’s annual inflation is anticipated to maintain its 5.3% rate in August 2023, consistent with the July figures, as per Eurostat’s flash estimate. This was higher than the 5.1% forecast. Within the key components affecting inflation, the most significant annual rate is predicted for food, alcohol, and tobacco at 9.8%, though it shows a decrease from July’s 10.8%. Services follow suit with a slight dip from July’s 5.6% to 5.5% in August. Non-energy industrial goods have also seen a reduction from 5.0% in July to 4.8% in August. Notably, the energy sector, while still negative, improves from -6.1% in July to -3.3% in August.

Unemployment Rates Across the Euro Area and EU Show Stability

The seasonally-adjusted unemployment figures for July 2023 remained consistent with June 2023, with the euro area’s unemployment rate steady at 6.4%. A year-on-year comparison reveals a decline from 6.7% in July 2022. Similarly, the EU witnessed a stable unemployment rate at 5.9%, which is a slight decrease from 6.1% in the previous year.

Quantifying the Unemployed Population

Eurostat’s data highlights an estimated 12.928 million unemployed individuals across the EU in July 2023, with 10.944 million specifically in the euro area. This statistic indicates an increase from June 2023, with 35,000 more unemployed in the EU and an addition of 73,000 in the euro area. Yet, when compared with July 2022, there is a silver lining. The number of unemployed individuals has decreased by 209 thousand in the EU and by a larger 264 thousand in the euro area.

Crypto Market Cools Down; XRP in Accumulation Phase

The crypto market is cooling after a surge in buying on the 29th, losing 0.8% over the past 24 hours to $1.085 trillion, but still almost 4% higher than before the jump. Crypto Fear and Greed Index has returned to neutral territory after a week and a half of wandering in “Fear”.

Bitcoin 4 hour chartBitcoin briefly dipped to $27K on Wednesday, about half of its initial jump from $26K to $28K and back below its 200-day and 200-week averages, despite the increased traction of risk in traditional markets. The decisive trend battle won’t come until Friday evening at the earliest, with consolidation around current levels all the way through.

Trading Derivatives carries a high level of risk to your capital and you should only trade with money you can afford to lose. Trading Derivatives may not be suitable for all investors, so please ensure that you fully understand the risks involved, and seek independent advice if necessary. A Product Disclosure Statement (PDS) can be obtained either from this website or on request from our offices and should be considered before entering into a transaction with us. Raw Spread accounts offer spreads from 0.0 pips with a commission charge of USD $3.50 per 100k traded. Standard account offer spreads from 1 pips with no additional commission charges. Spreads on CFD indices start at 0.4 points. The information on this site is not directed at residents in any country or jurisdiction where such distribution or use would be contrary to local law or regulation.

Ripple weekly chartXRP has performed worse than the cryptocurrency market over the past few days, erasing almost all gains of its latest leap. On a weekly timeframe, long-term support appears to have been taken over by the 200-week average (now $0.516). A fortnight ago, the sell-off stopped at the 50-week average ($0.457). Both curves are well above the multi-year uptrend line, which now runs through $0.39. This dynamic could attract more speculators soon, with an upside potential of $0.60 or even $0.80, said Alex Kuptsikevich from FxPro.

Crypto News

According to Raul Pal, founder of Real Vision, ongoing Bitcoin consolidation could well end with a powerful spike. According to him, BTC is growing exponentially after periods of low volatility.

Bloomberg Intelligence suggests that stablecoins will be more popular than BTC in the short term.

Company X, formerly known as Twitter, has obtained the licence to provide cryptocurrency payment and trading services in the US. This is a positive sign for the future of crypto on the platform.

BlackRock has invested over $400 million in the shares of four mining companies, making it one of the US’s largest lobbyists for the Bitcoin industry.

During the SEC’s case against Binance, the regulator filed a sealed motion containing 35 exhibits, a statement from the agency’s trial counsel and a proposed order. The commission did not want the data submitted to the court to be made public, a rare occurrence according to legal experts.

The US Congress has proposed firing the head of the SEC following a court ruling that found Grayscale’s refusal to create a bitcoin ETF illegal.

Crude Inventories Decline By 10.6 Million Barrels

On August 30, EIA released its Weekly Petroleum Status Report. The report indicated that crude inventories declined by 10.6 million barrels from the previous week, compared to analyst consensus of -3.3 million barrels.

Total motor gasoline inventories decreased by 0.2 million barrels, while distillate fuel inventories grew by 1.2 million barrels. Crude oil imports declined by 316,000 bpd, averaging 6.6 million bpd.

The U.S. continued to purchase oil for the Strategic Petroleum Reserve (SPR). As a result, SPR increased from 348.9 million barrels to 349.5 million barrels. It should be noted that SPR remains close to multi-decade lows, so the U.S. is buying oil despite rising prices as it must replenish reserves.

Domestic oil production remained unchanged at 12.8 million bpd. The recent pullback in the oil markets did not have any impact on domestic oil producers.

Today, traders will also stay focused on the military coup in Gabon, which is an OPEC member. Oil markets stay tight, and additional production disruptions may provide significant support to oil prices.

Currently, WTI oil is trying to settle above the $82.00 level. The significant decline in crude inventories may provide additional support to the oil market. Meanwhile, Brent oil is testing the $85.50 level.