Wall Street Drifts Higher Overnight, RBA Meeting in Focus: Russell 2000, Hang Seng Index, Brent Crude

Wall Street Drifts Higher Overnight, RBA Meeting in Focus: Russell 2000, Hang Seng Index, Brent Crude

The new trading week kickstarted with a drift higher in Wall Street overnight (DJIA +0.28%; S&P 500 +0.15%; Nasdaq +0.21%), as sentiments remain largely on its cautiously optimistic state ahead of more big tech earnings releases and the US job report this week. As we head into August, seasonality suggests that the month tends to be more subdued in terms of US market performance. Along with market breadth and sentiment indicators pointing towards overbought conditions, calls are growing that we could see some near-term cooling ahead, although it could still be difficult to overturn the upward trend without a series of growth scares.

The day ahead will leave the US ISM manufacturing PMI data in focus, which is expected to deliver its ninth straight month of contraction (46.8 versus previous 46.0). The US job opening numbers will be released as well, with further moderation expected (9.61 million from previous 9.82 million).

While historical instances suggest that a fall in job openings tend to correlate with an increase in US unemployment rate, that has not been playing out this year, which is looked upon to support soft landing hopes. Nevertheless, any sharp decline in job openings will remain on watch to provide signs for a weakening labour market in the lead-up to the US non-farm payroll report this week.

Overnight, the Russell 2000 index has pulled ahead with a 1% gain, with another attempt to reclaim its key resistance at the psychological 2,000 level. A bullish crossover was formed between its 100-day and 200-day moving average (MA), with RSI above its 50 level reflecting buyers in control. Further upside may place the 2,110 level on watch next, with potential for some catch-up performance in the index as it remains in a broader consolidation pattern at a time where other major US indices are pushing to their multi-month highs.
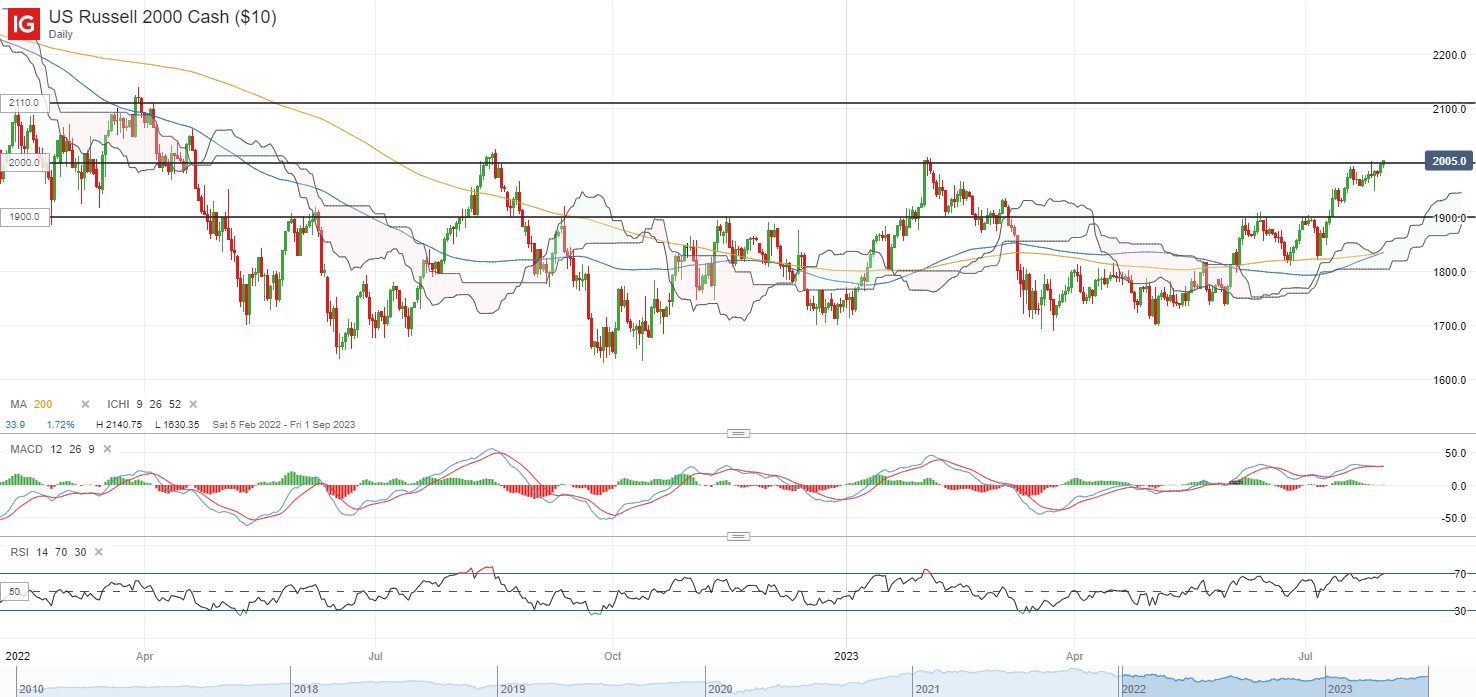
image1.png

Asia Open

Asian stocks look set for a positive open, with Nikkei +0.28%, ASX +0.32% and KOSPI +1.00% at the time of writing. China’s new measures to stimulate consumer spending were seen as more conservative by stopping short of direct stimulus, triggering a more lukewarm reaction in Chinese equities. The Hang Seng Index closed 0.7% higher yesterday, while the Nasdaq Golden Dragon China Index is up by a similar scale overnight as well.

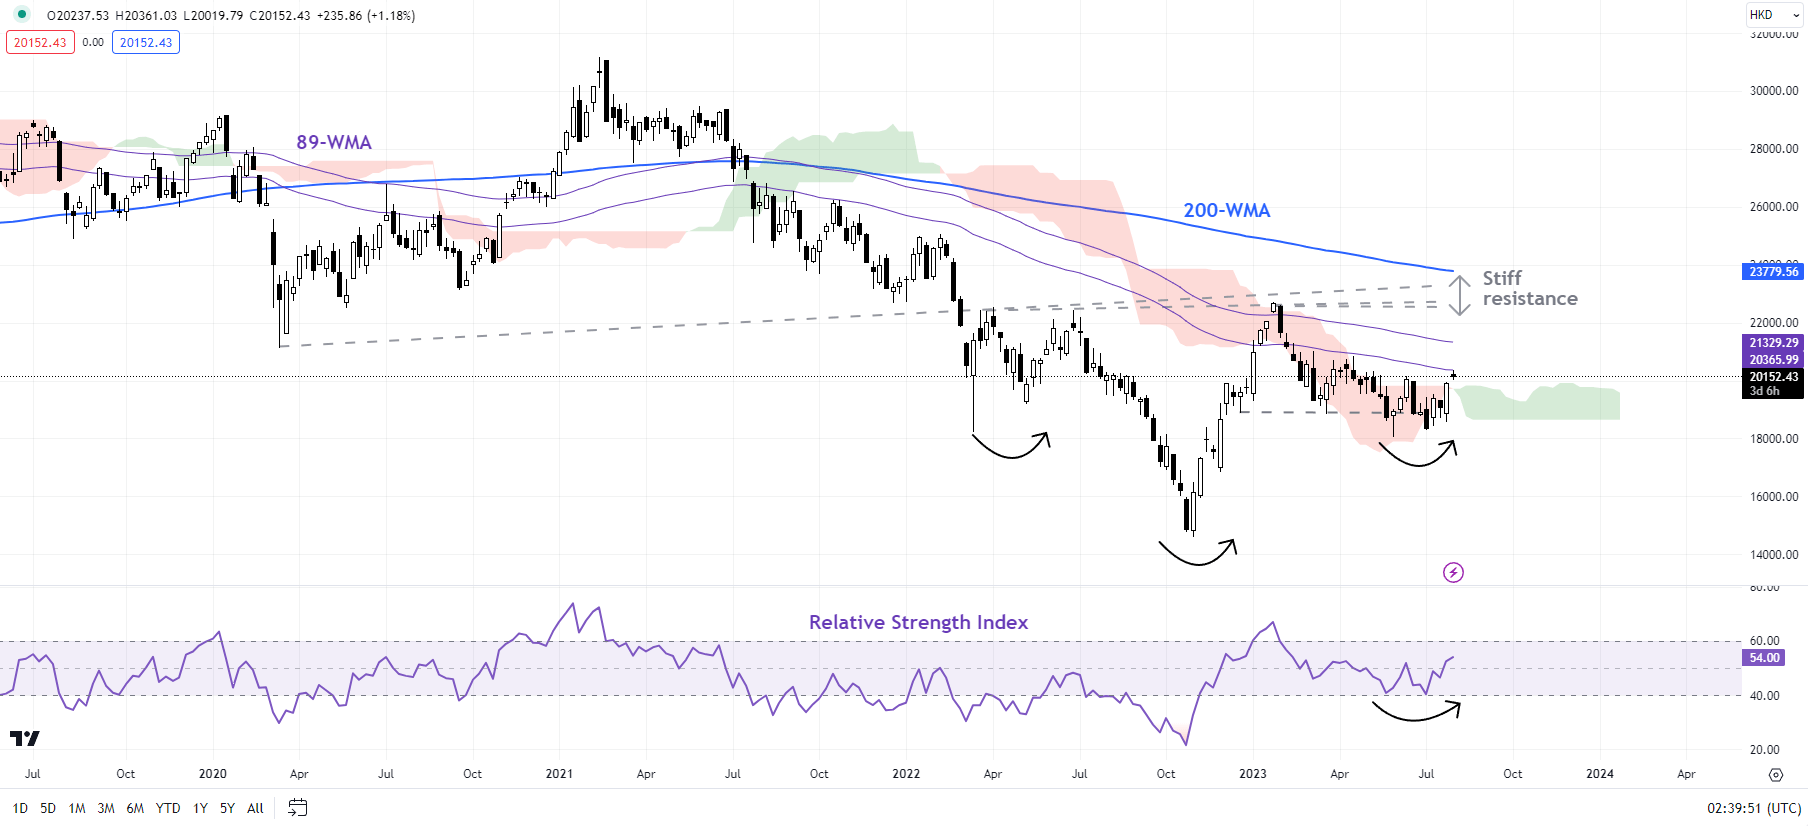
Nevertheless, on the weekly chart for the Hang Seng Index, buyers are attempting to take greater control by overcoming its Ichimoku cloud resistance, where past interactions since the start of the year have not been successful. A bullish crossover on weekly moving average convergence/divergence (MACD) is presented as well, as its relative strength index (RSI) attempts to head above zero. Sustaining above its key psychological 20,000 level may be crucial, while further upside may leave the 20,800 level on watch for a retest next.
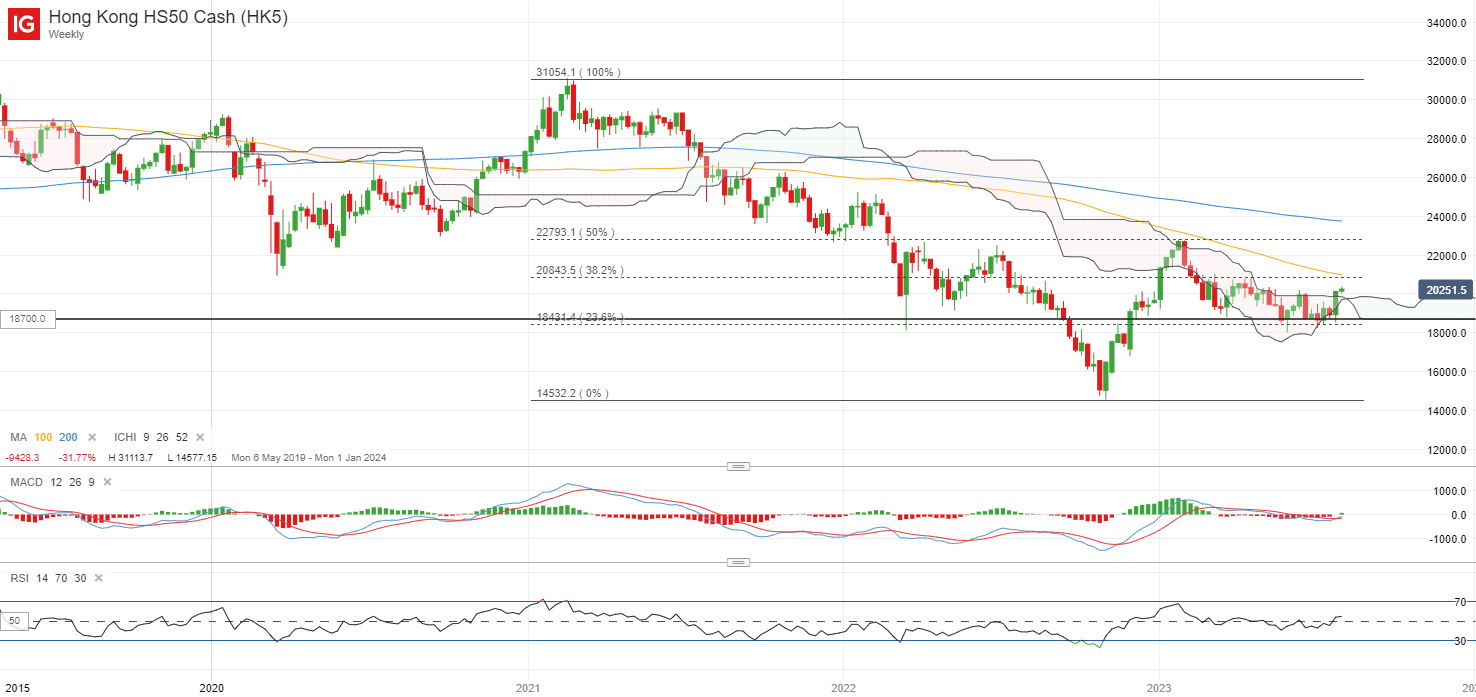
image2.png

Ahead, the Reserve Bank of Australia (RBA) interest rate decision will be the key event on the calendar. Given the downside surprise last week in inflation (6% year on year versus 6.2% expected) and retail sales data (-0.8% versus 0.0% expected), broad expectations are that the central bank may look past its still-strong labour market and keep its rates unchanged for now. That said, cash rate futures are not suggesting that it will be the end of the hiking cycle yet. Expectations are still pricing for the possibility of another 25 basis-point (bp) rate hike over coming months, which leaves the RBA’s guidance on watch for any validation, although a more data-dependent stance is still the likely scenario.

On the watchlist: Oil prices aiming for a retest of its 2023 high?

Brent crude prices continue to push to a new higher high this week, as bearish sentiments continue to unwind on improving supply conditions and hopes for China’s supportive measures to underpin some demand into the second half of the year. Brewing expectations are for Saudi Arabia and Russia to extend their voluntary output cuts for another month to include September. The firming in the US dollar lately has been largely shrugged off by oil prices, as rising MACD and RSI point to some building upward momentum.

On the daily chart, prices have managed to overcome its Ichimoku cloud resistance, along with its 200-day MA for the first time since August 2022. Further upside could seem to place its year-to-date high on watch for a retest, which could determine if prices can break out of its medium-term range. Breaking above its year-to-date high may potentially pave the way to retest the US$98.00 level next.
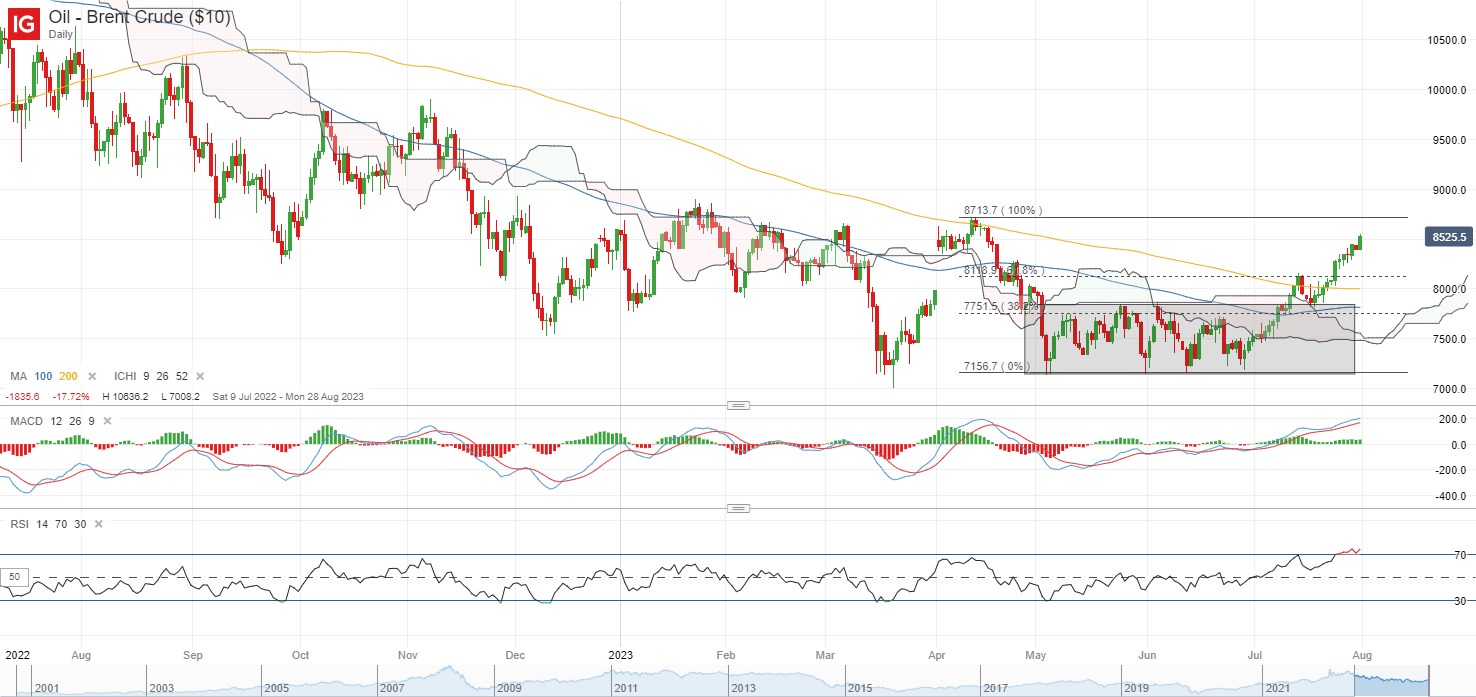
image3.png


British Pound Toppish Ahead of BOE: GBP/USD, GBP/AUD, GBP/NZD Price Setups

British Pound Toppish Ahead of BOE: GBP/USD, GBP/AUD, GBP/NZD Price Setups

The chances of a smaller interest rate hike at the Bank of England’s (BOE) meeting on Thursday are growing as UK price pressures appear to be finally moderating from elevated levels.

Given that inflation remains well above BOE’s comfort range, it will probably be too soon to declare victory even with the downside surprise in UK June CPI. Elevated inflation and solid growth in wage growth in May point to a 25 basis points move, rather than 50 basis points.

The key focus will be on BOE’s forward guidance – a data-dependent approach Vs a reiteration of further tightening given persistently sticky inflation. With speculative long GBP positioning still around the highest level since 2014, GBP could decline in the former case, while GBP could struggle to sustain gains in the latter case as forward-looking price and activity indicators point to downward momentum in underlying price pressures. Still, the downside in GBP supported given still-wide interest rate differentials with some of its peers.

GBP/USD 240-minute Chart

image1.png

GBP/USD: Could soften in the near term

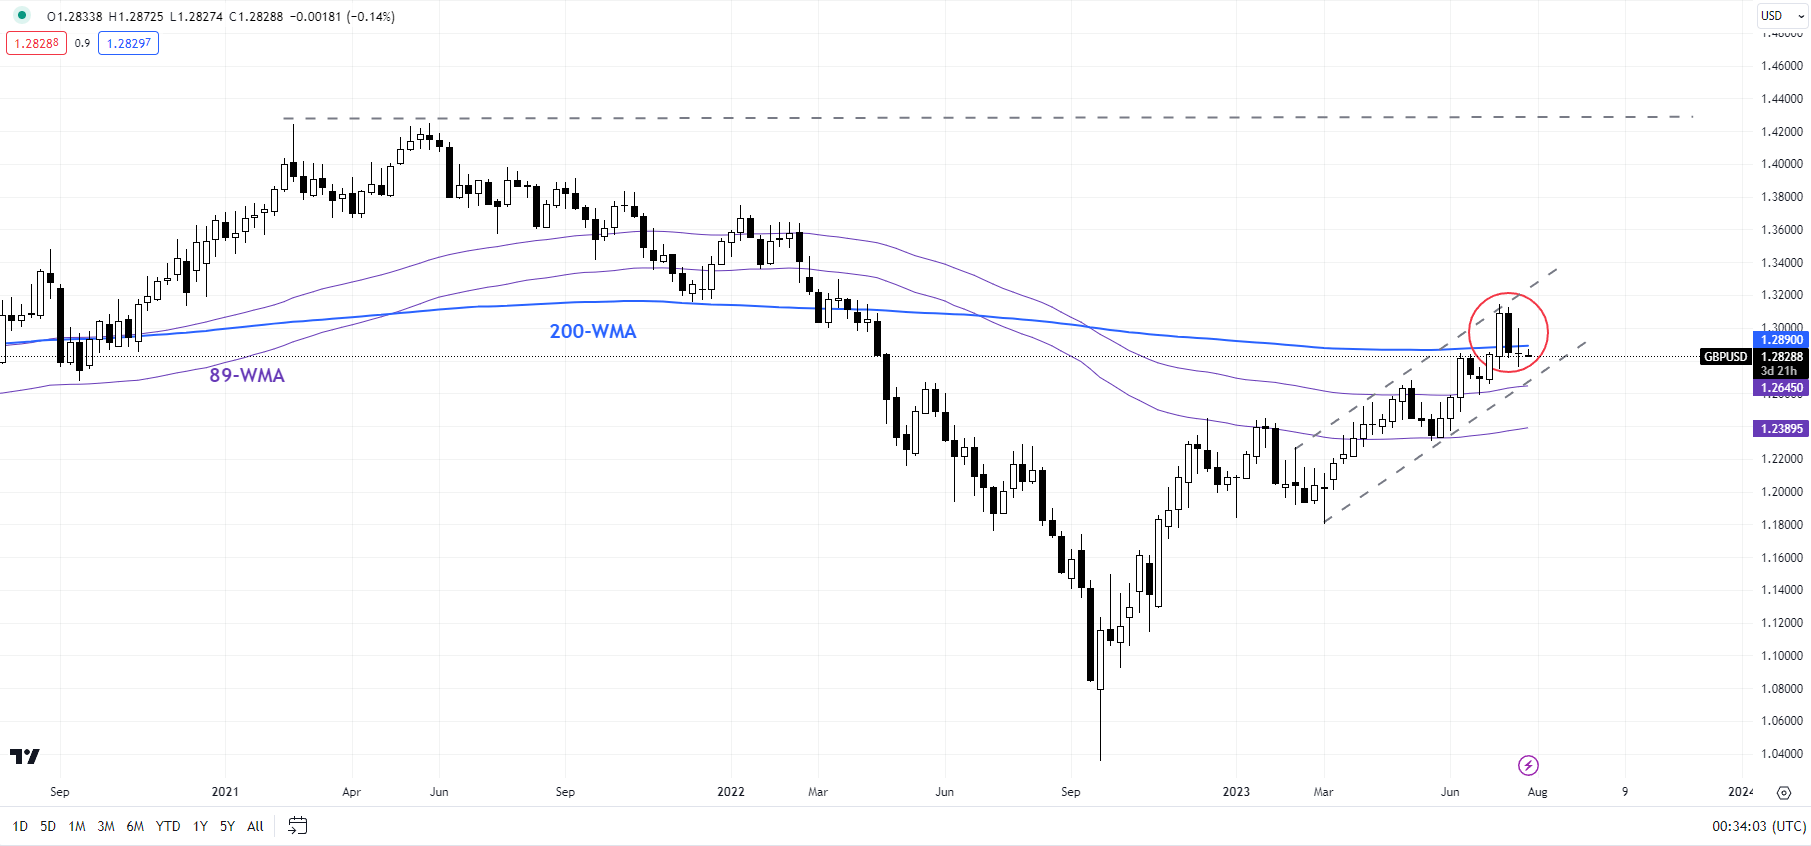
GBP/USD’s failure to sustain gains above stiff resistance on the 200-week moving average, roughly coinciding with the upper edge of a rising channel since early 2023 raises the risk of minor weakness in the near term given overbought conditions. See the previous update that pointed out the risk that the upward pressure in GBP/USD could be easing – “What’s Changed for British Pound After UK CPI? GBP/USD, EUR/GBP, GBP/AUD Price Setups,” published July 20.

GBP/USD Weekly Chart

image2.png

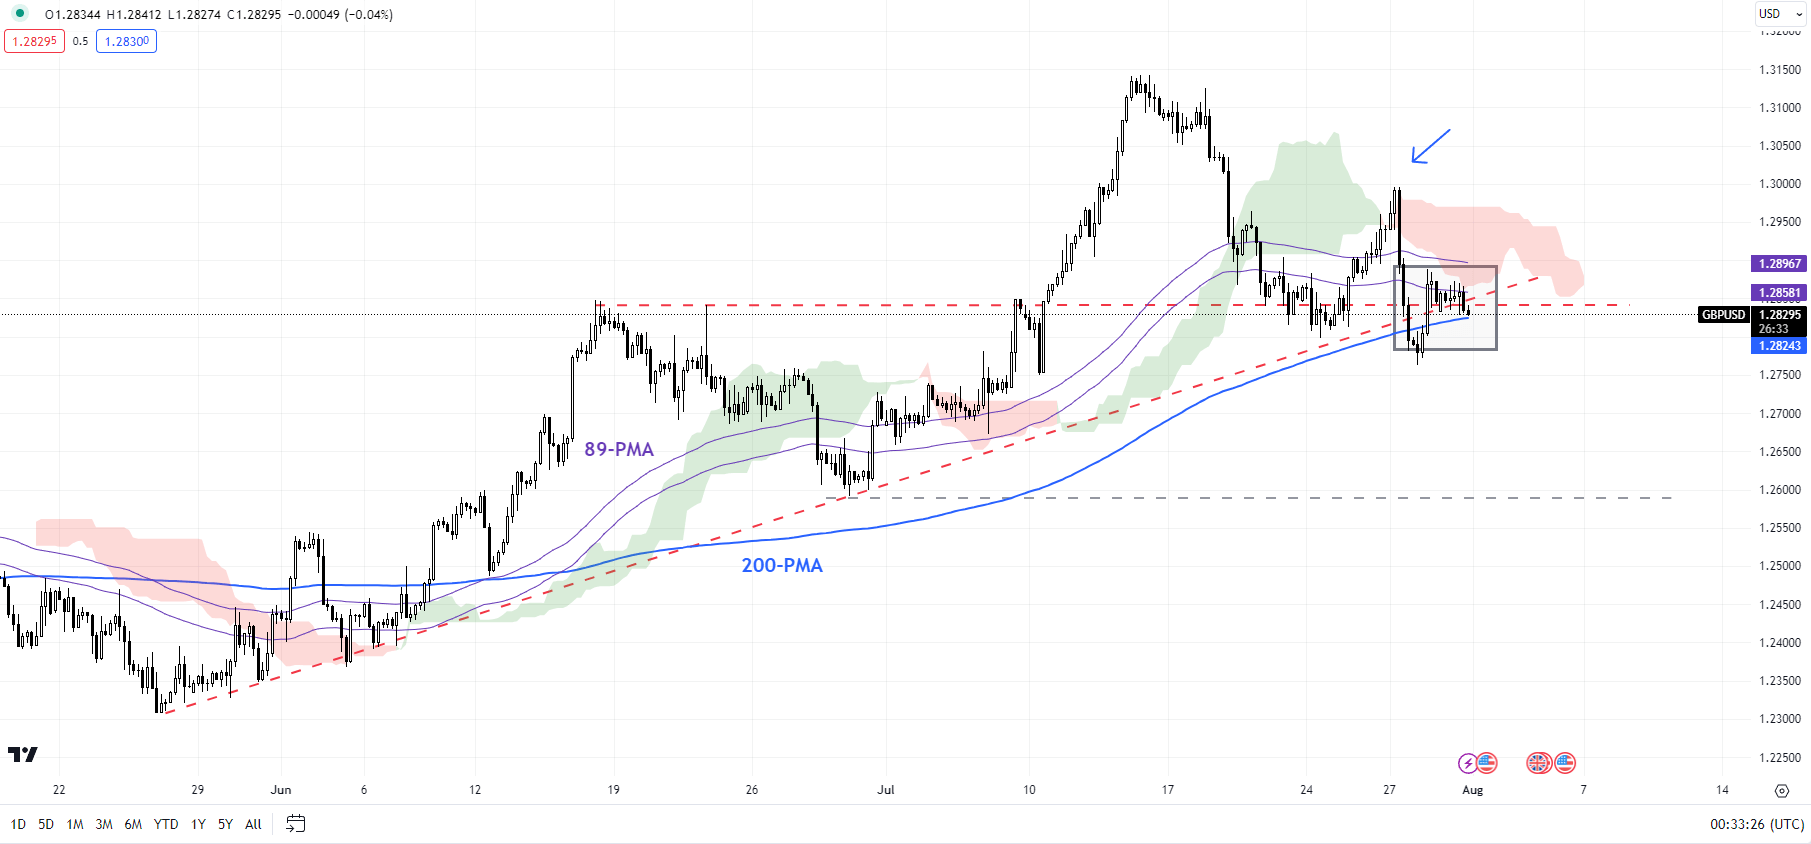
Zooming into intraday charts, cable’s failed attempt to rise past the upper edge of the Ichimoku channel on the 240-minute charts has created a lower high for the first time in recent weeks. So far, the pair has been holding above strong converged cushion around – an uptrend line from the end of June and the 89-period moving average. However, the pair looks vulnerable to a fall below the support. Such a break could pave the way toward the end-June low of 1.2600.

GBP/USD Daily Chart

image3.png

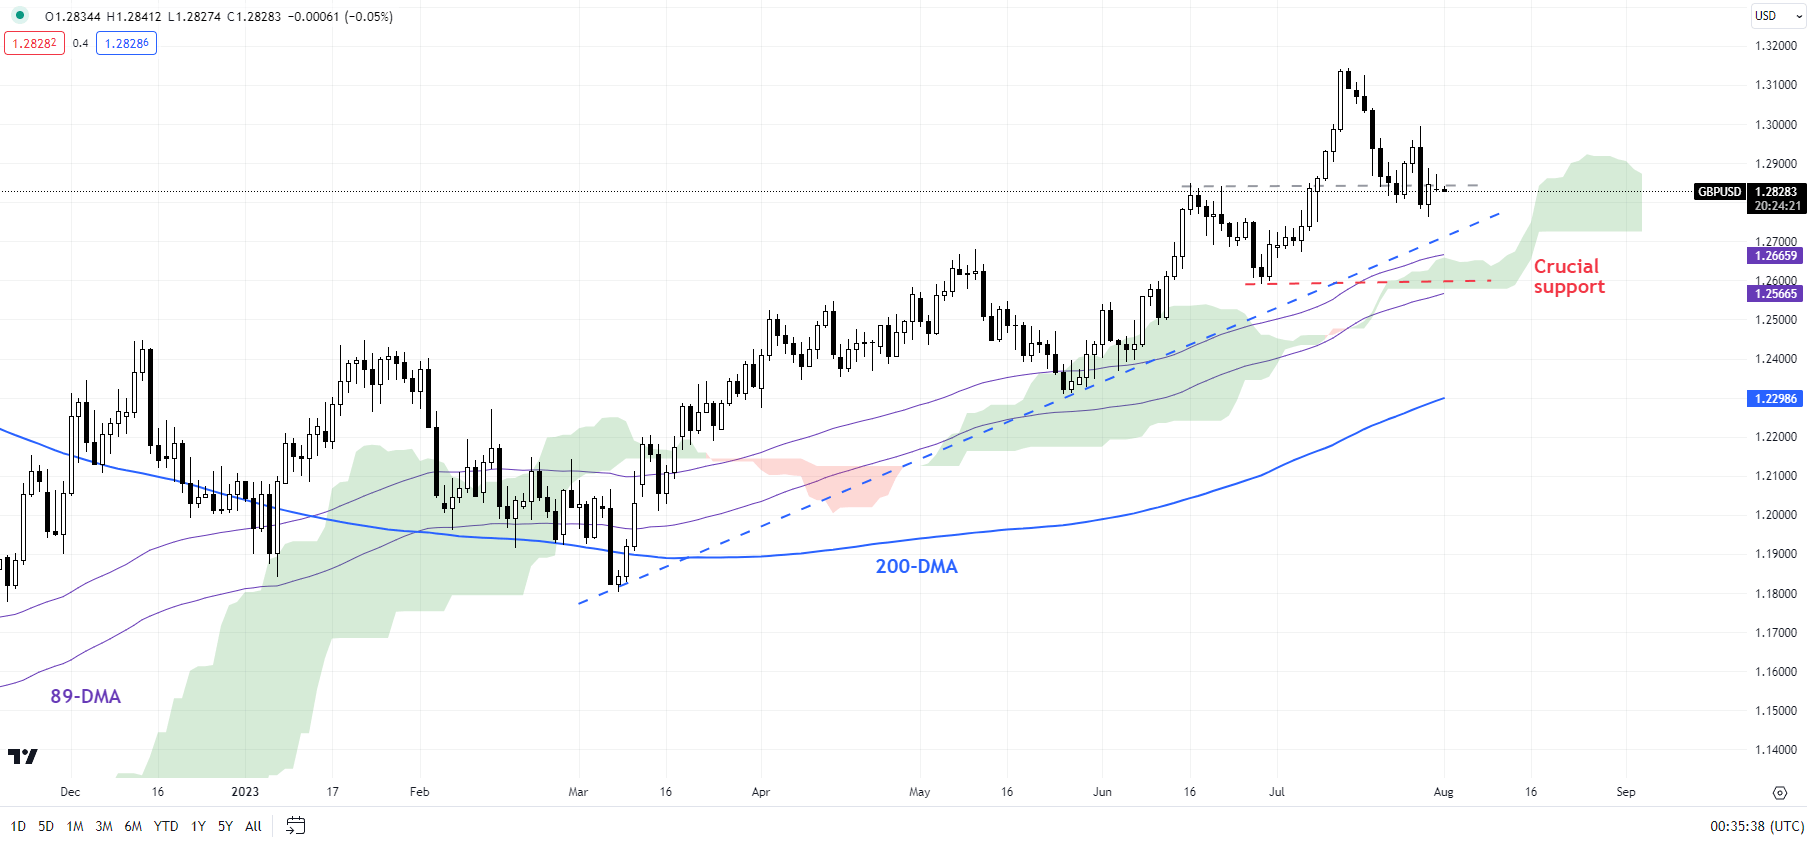
Beyond the daily timeframe, as the previous update pointed out, from a medium-term perspective, the rise this month to a one-year high in May confirmed the higher-tops-higher-bottom sequence since late 2022, leaving open the door for some medium-term gains. But cable may have to soften slightly before it embarks on the next leg higher (see “British Pound Buoyant Ahead of BOE: How Much More Upside?”, published May 8).

GBP/AUD Weekly Chart

image4.png

GBP/AUD: Risks turning down

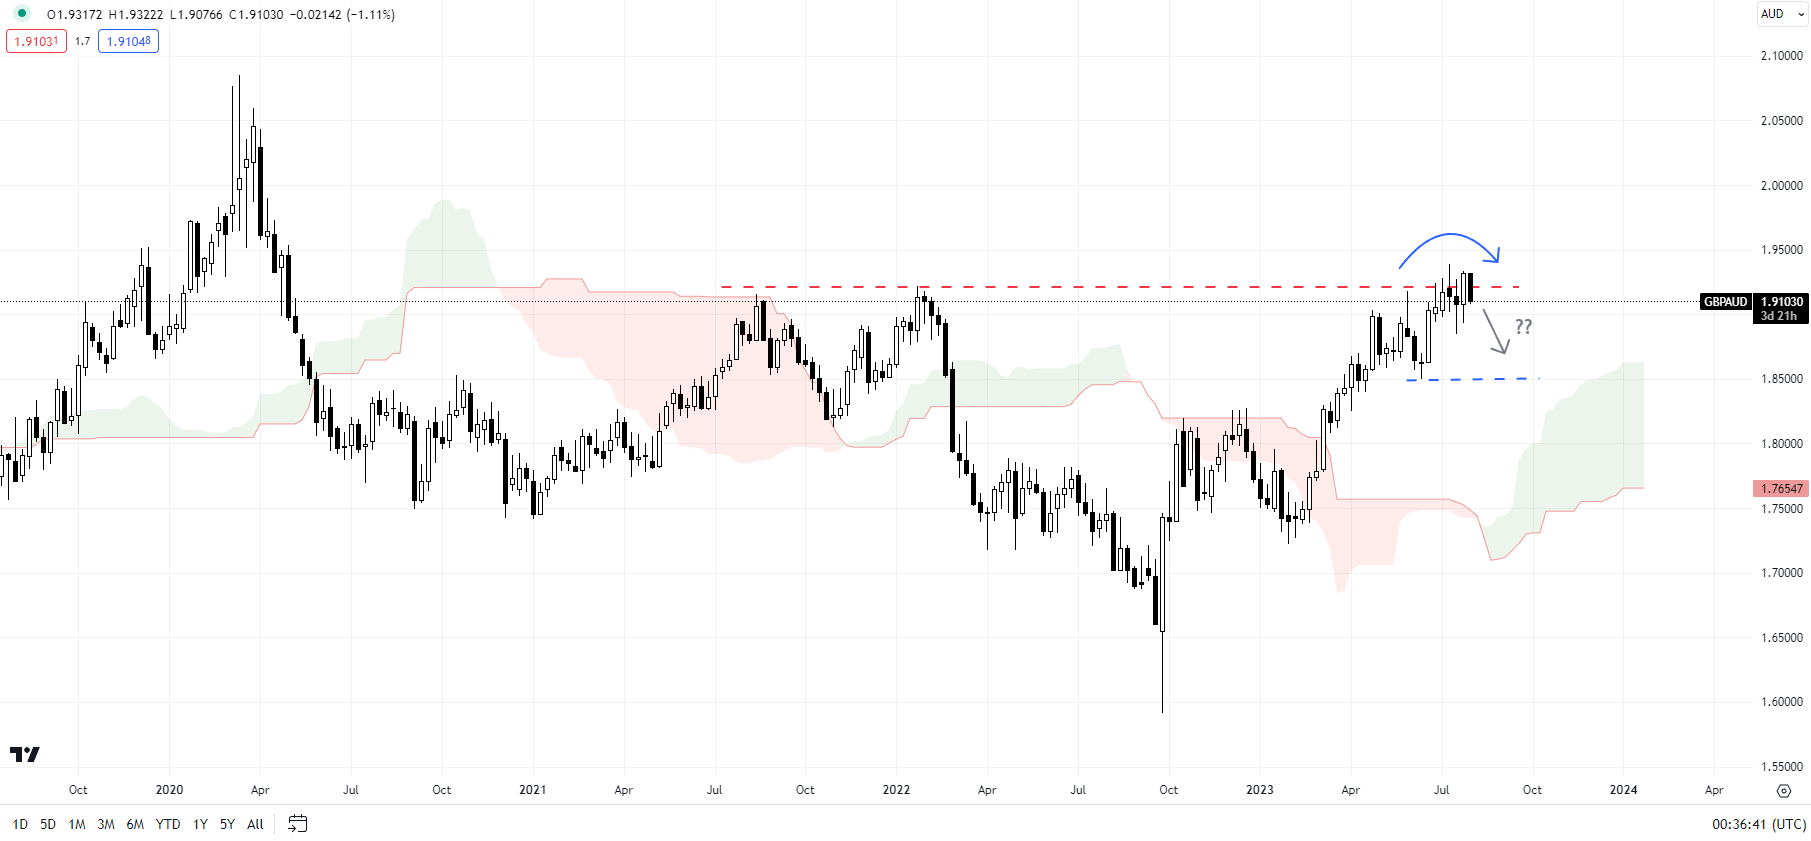
GBP/AUD’s rally is losing steam as it tests a vital ceiling on a horizontal trendline from 2021, at about 1.9200 – a confirmation of this is the failure this week to build on to Friday’s sharp gains. The cross risks a retreat in the near term, initially toward the late-July low of 1.8850, with strong support at the June low of 1.8500.

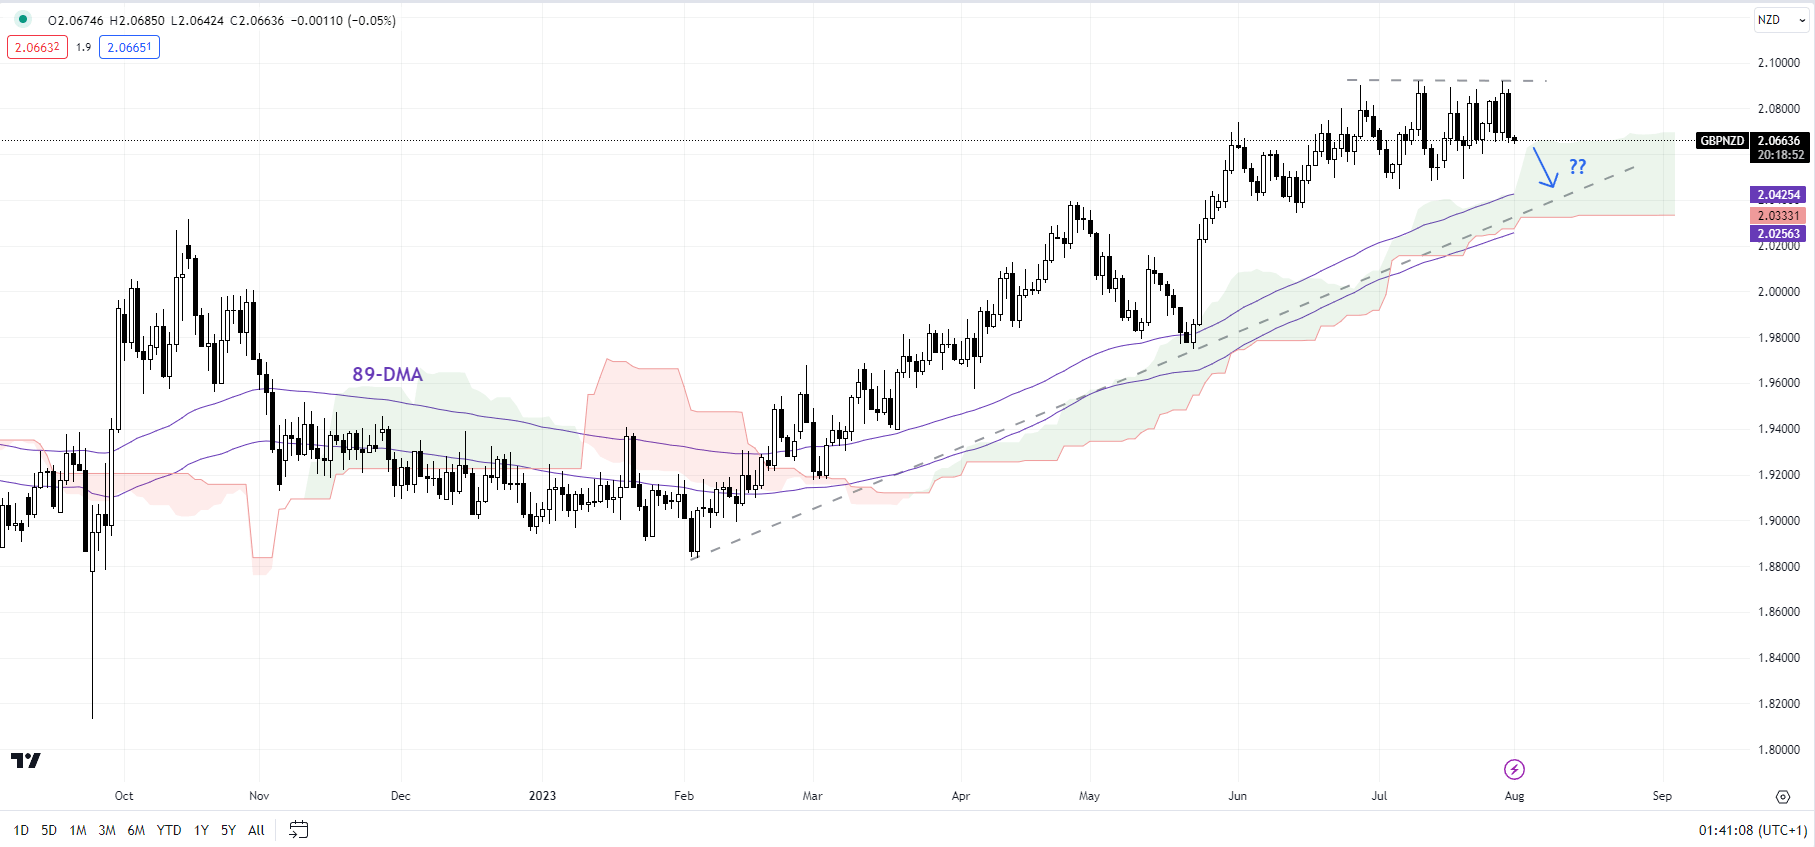
GBP/NZD Daily Chart

image5.png

GBP/NZD: Overbought conditions point to some consolidation

GBP/NZD has struggled to extend gains in the past couple of months – a reflection of overbought conditions on higher timeframe charts. Any break below immediate support at the July low of 2.05 could open the way toward 2.02.

Australian Dollar Whipsaws After RBA Pause Again on Hiking Cycle. Lower AUD/USD?

Australian Dollar Whipsaws After RBA Pause Again on Hiking Cycle. Lower AUD/USD?

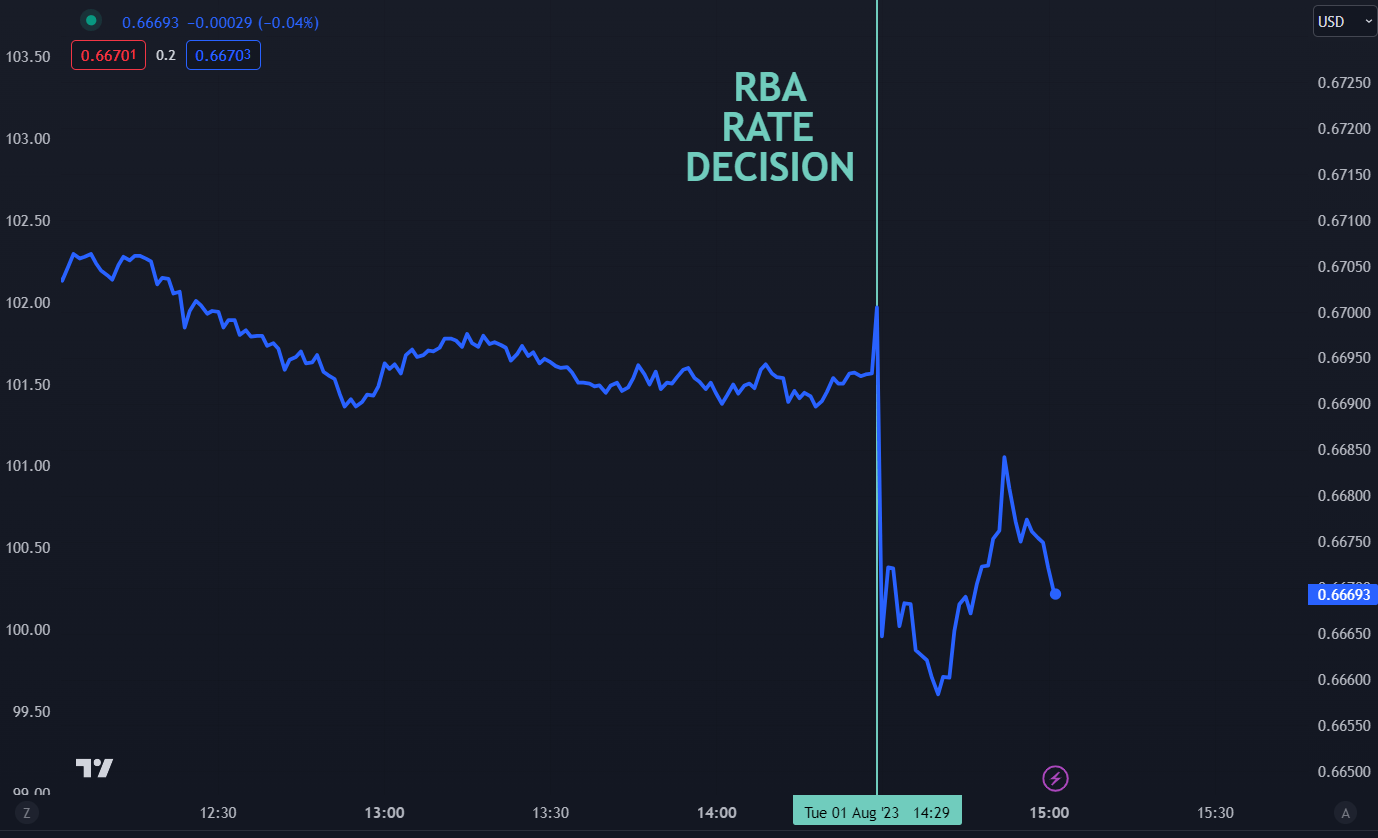
The Australian Dollar initially spiked before running lower after the RBA once again refrained from tightening monetary policy, leaving the cash rate at 4.10%. The S&P/ASX 200 bumped up on the news.

Going into today’s decision, traders and commentators were divided on the potential outcome.

The futures interest rate market had priced in a less than 20% probability of a 25 basis point hike while a Bloomberg survey of economists saw 18 in favour of a lift and 12 looking for no change.

The market has now ascribed around a 50% chance of a 25 basis point hike for the remainder of this tightening cycle.

In the accompanying statement, Governor Lowe said, “Some further tightening of monetary policy may be required to ensure that inflation returns to target in a reasonable timeframe, but that will depend upon the data and the evolving assessment of risks.”

Regarding inflation, they also noted that “Inflation in Australia is declining but is still too high at 6 per cent.”

The June quarter-on-quarter headline CPI was 0.8% which was below the 1.0% anticipated and 1.4% prior.

The RBA’s preferred measure of trimmed-mean CPI was 5.9% year-on-year to the end of June which is also less than the 6.0% estimated and 6.6% previously.

The trimmed mean quarter-on-quarter CPI read of 1.0% was below the 1.1% forecast and 1.2% for Q1.

Today’s decision comes after the appointment of Michelle Bullock as the new RBA Governor was announced just over two weeks ago. She will take up her new role in mid-September.

Ms Bullock has been the Deputy Governor of the bank since April 2022 and has been with the institution since 1985. She has a reputation as a leading economist in her own right.

The appointment is mostly viewed as a steady transfer of leadership at a critical time for monetary policy at the RBA.

Earlier today, Australian building approvals data for June sunk by -7.7% month-on-month, which was not as negative as the -8.0% anticipated and -8.1% prior. The current unemployment rate of 3.5% is near multi-generational lows.

The tight labour market was referenced in the accompanying statement and the bank is of the belief that the unemployment rate will need to climb toward 4.5% in order for CPI to get back down below 3%.

Looking forward, the bank has made it clear that the incoming data will enable them to determine the impact of the increase of 400 basis points to borrowing costs since May last year.

It is possible that there could be higher volatility around economic data than has been the recent case for Australian financial markets.

The RBA’s full monetary policy statement can be read here.

AUD/USD 1 MINUTE CHART PRICE REACTION TO RBA HIKE

Live prices can be found here.

image1.png


Japanese Yen Remains Under Pressure as USD/JPY Looks for Upside Breakout

Japanese Yen Remains Under Pressure as USD/JPY Looks for Upside Breakout

The US Dollar is back on the offensive against the Japanese Yen. From a fundamental perspective, this follows the aftermath of what was a dovish Bank of Japan monetary policy announcement last week. Meanwhile, over the past 24 hours, the central bank announced an unscheduled debt-buying operation to help contain rising local government bond yields.

In all, JPY has weakened over 2 percent since the BoJ rate decision last week. Is USD/JPY preparing to resume the broader uptrend? Looking at the daily chart below, the currency pair is attempting to confirm a breakout above the July 21st high of 141.95. If this is achieved over the remaining 24 hours, that would place the focus on the June peak at 145.07.

Moreover, the rising trendline from March has been reinforced, maintaining the upside technical bias since the beginning of this year. Extending upward exposes the 61.8% Fibonacci extension level at 148.27. Before long the October high of 151.94 may come into focus.

image1.png

Let us zoom in on the 4-hour chart to get a better picture of what the near-term trend is shaping up to be. For starters, there has been a confirmatory bullish Golden Cross between the 50- and 100-period Moving Averages (MA). That is adding fuel to the upside technical bias.

However, be mindful that in this timeframe, we do have the presence of negative RSI divergence. This is a sign of fading upside momentum, which can at times precede a turn lower. In such a case, immediate support seems to be the 61.8% Fibonacci retracement level at 142.07. Below that, the 50-period line may come into focus and hold as support, maintaining the near-term upside bias. Otherwise, key resistance above on this timeframe seems to be the 78.6% level at 143.39.

image2.png


HK/China Equities Attempt to Build Base on Stimulus Hopes; Hang Seng, CSI 300 Price Setups

HK/China Equities Attempt to Build Base on Stimulus Hopes; Hang Seng, CSI 300 Price Setups

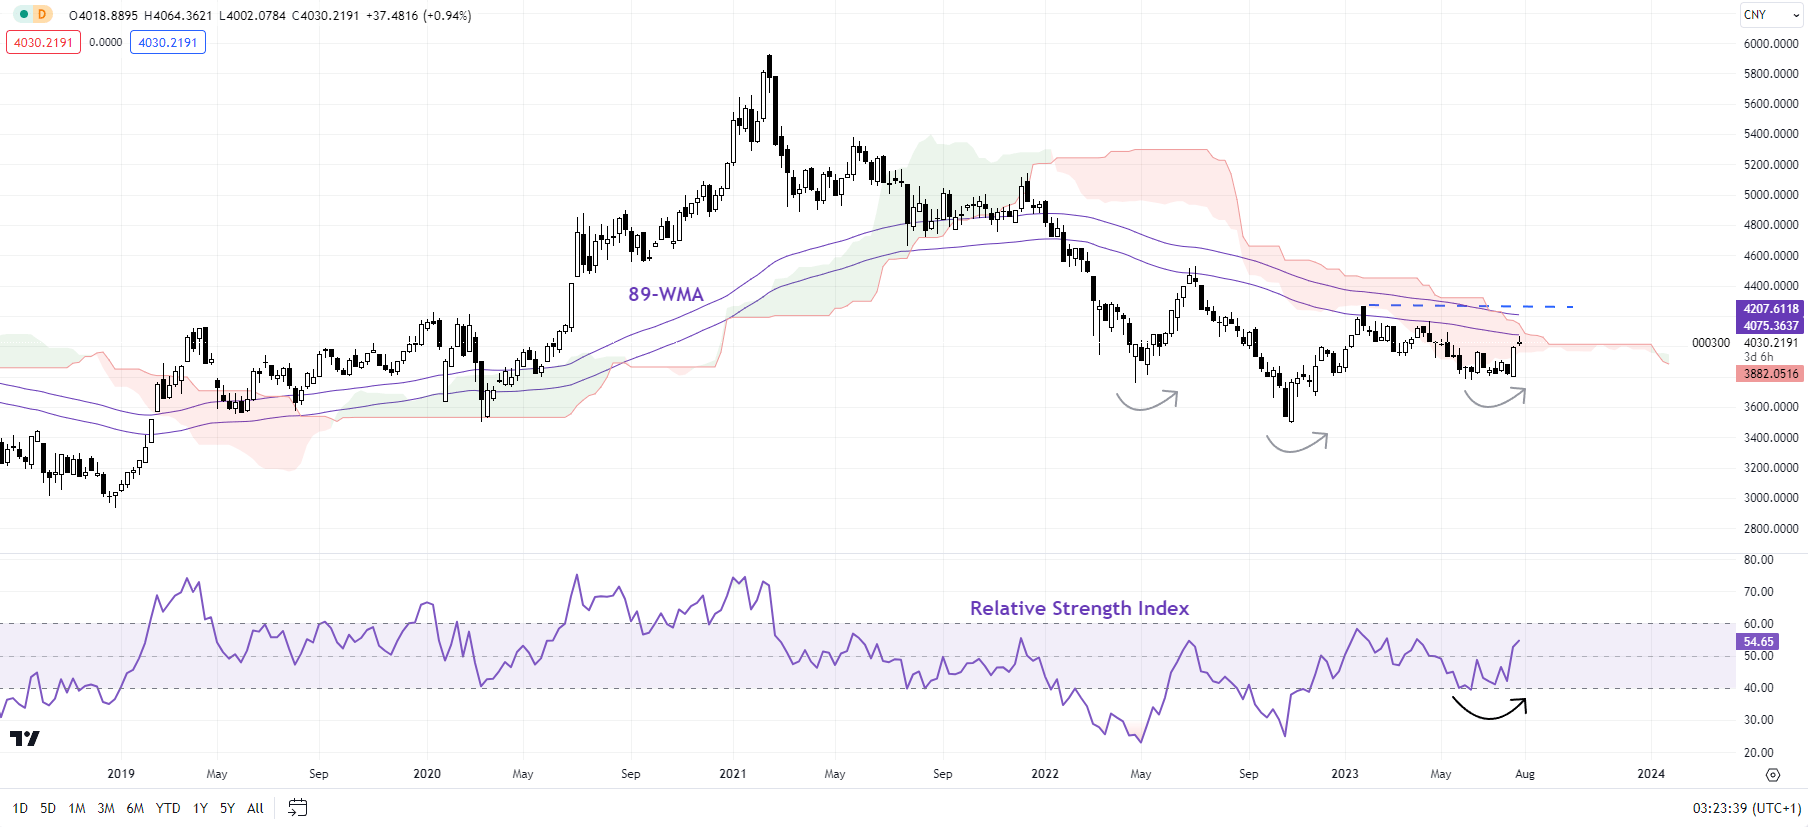
China/Hong Kong equities appear to be in the early stages of base building amid hopes of further stimulus.

Chinese authorities have pledged to support the fragile post-Covid economy recovery, focusing on boosting domestic demand, confidence and preventing risks. China’s State Council on Monday issued measures to restore and expand consumption in automobiles, real estate, and the service sector. The hope is for more measures to support the ailing property sector.

The economic growth outlook in the world’s second-largest economy has deteriorated in recent months, with consensus downgrading economic forecasts for the current year and 2024. Beijing has announced a series of measures in recent weeks to cushion some of the downside risks to the economy, including cuts in key lending benchmarks, targeted measures toward new-energy vehicles, the property sector, and the booming generative artificial intelligence sector, and signaled the end of the years-long crackdown on the technology sector.

Attractive valuations compared with some of its peers, generally oversold conditions, and higher risk premium (according to some estimates, pessimism toward China is at extreme levels) could trigger a repricing higher of HK/China equities.

Hang Seng Index Weekly Chart

image1.png

Chart Created Using TradingView

Hang Seng: Holding above key support

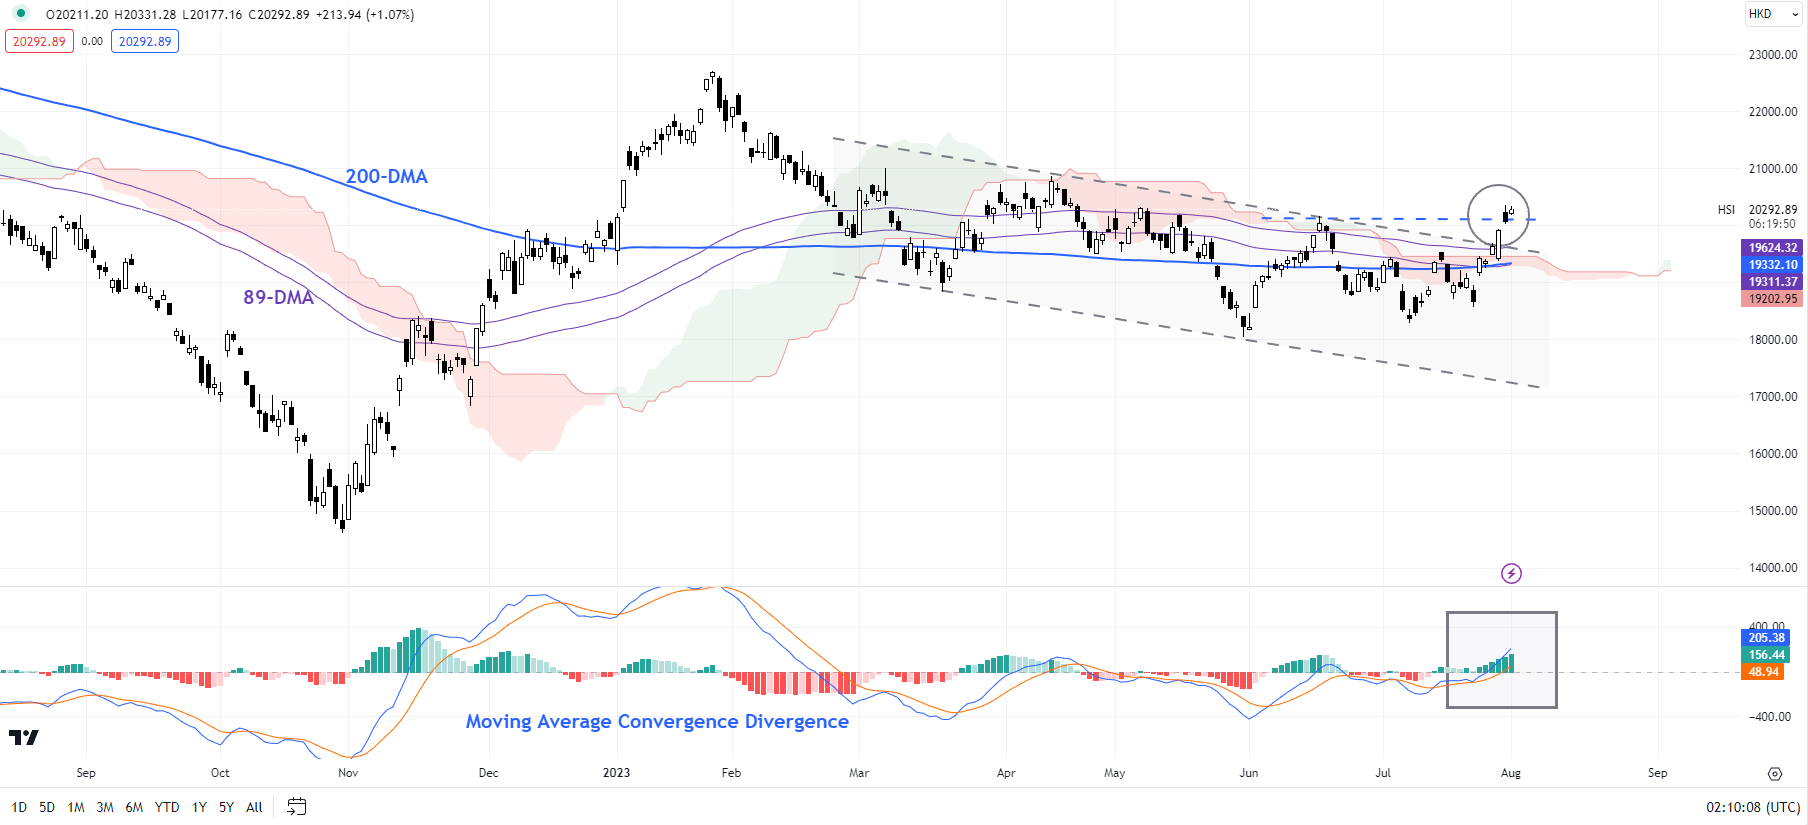
The upward momentum in the Hang Seng Index is improving as it attempts to break above a vital barrier at the mid-June high of 20155, roughly coinciding with the upper edge of a declining channel since April. Any break above would confirm that the immediate downward pressure had eased, opening the way toward the January high of 22700.

Hang Seng Index Daily Chart

image2.png

Chart Created Using TradingView

On the weekly charts, after declining from January onwards, the index held ground around the lower edge of the Ichimoku cloud on the weekly charts, just as the 14-week Relative Strength Index found support around the crucial 40-mark. In the process, the index formed a higher low, an early sign of base building.

CSI 300 Index Weekly Chart

image3.png

Chart Created Using TradingView

CSI 300: Base building?

The higher low formed in mid-2023 raises the prospect of base building in the CSI 300 index, a point confirmed by the 14-week Relative Strength Index holding above the crucial 40-mark. However, unless the index surpasses the immediate ceiling at the February high of 4268, the path of least resistance remains sideways to down. Any break above could raise the odds that the downward pressure was easing, exposing the upside toward 4500.

USD/CAD Price Forecast: Loonie Preps for Canadian & US PMI Data

USD/CAD Price Forecast: Loonie Preps for Canadian & US PMI Data

CANADIAN DOLLAR FUNDAMENTAL BACKDROP

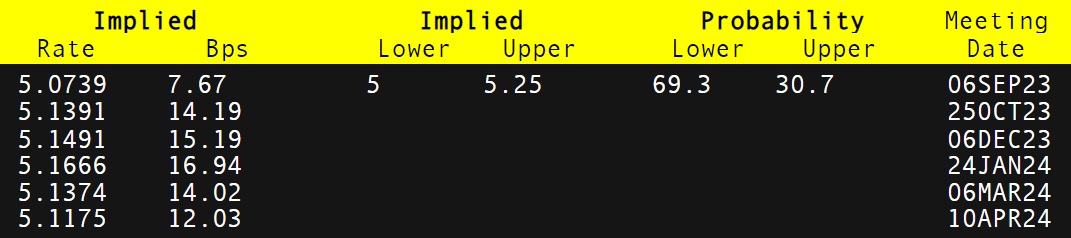
The Canadian dollar has been steadily declining against the USD since mid-July despite the fact the crude oil prices have rallied. The crude oil price appreciation has largely offset some of the dollar gains since the Bank of Canada’s (BoC) Summary of Deliberations last week revealed the central banks hesitation to tighten monetary policy further from here on in after raising interest rates by 25bps in July. Money market pricing (refer to table below) shows no additional hikes priced in at the moment but there is scope for possible hikes should economic data deem it necessary. With global inflationary pressures falling, I expect Canadian inflation to follow a similar trend that should mean the BoC is at the peak of their hiking cycle. Rate cuts will be the next point of contention but for now markets will be looking at Canadian fundamental data to firstly rule out any additional rate hikes.

BANK OF CANADA INTEREST RATE PROBABILITIES

image1.png

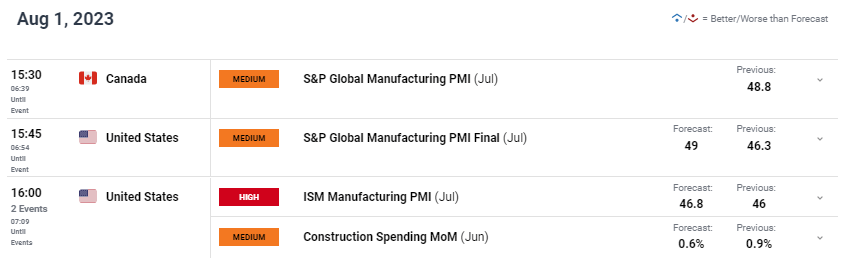
Later today, the economic calendar will be focused on both Canadian and US manufacturing PMI’s. Both countries are currently in contractionary territory and any improvement could support the respective currency accordingly.

USD/CAD ECONOMIC CALENDAR (GMT +02:00)

image2.png

TECHNICAL ANALYSIS

USD/CAD DAILY CHART

image3.png

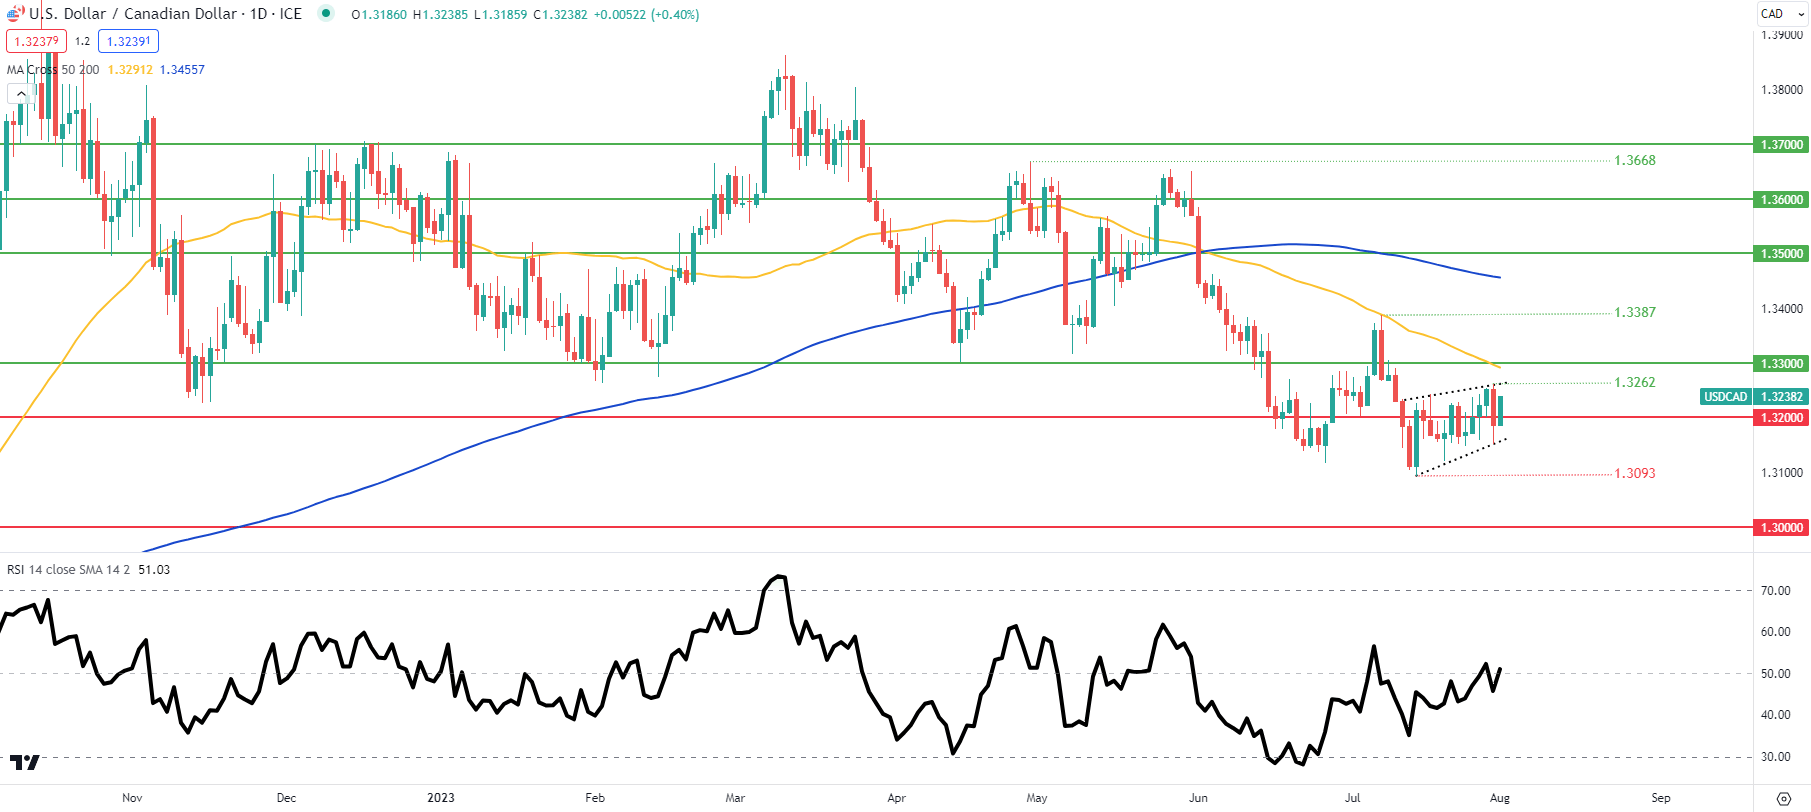
Daily USD/CAD price action has the pair conformed within a developing rising wedge chart pattern (black) now trading above the 1.3200 psychological level. The Relative Strength Index (RSI) shows market hesitancy as it lingers around the midpoint region of the oscillator. This could suggest that traders are waiting further fundamental data that include upcoming US ISM services PMI, Canadian jobs and the Non-Farm Payroll (NFP) reports.

Bears will be looking for daily candle close below wedge support that could prompt a larger move lower towards subsequent support zones. From a bullish perspective, a close above wedge resistance/1.3262 could invalidate the pattern and expose the 1.3300 level.