EUR/USD holds recovery near 1.1000 ahead of US ADP jobs data

EUR/USD holds recovery near 1.1000 ahead of US ADP jobs data

EUR/USD is holding recovery gains near 1.1000 in the early European session on Wednesday. The pair is finding support from a broadly weaker US Dollar, as investors stay cautious amid the US debt rating downgrade and ahead of the key US ADP jobs data.

The EUR/USD dropped modestly on Tuesday, and the bias is to the downside; however, the pair has been able to remain above an uptrend line and above the strong support area of 1.0950/60. A break below this support level could trigger an acceleration to the downside towards 1.0910, where the 55 and 100-day Simple Moving Averages await. On the upside, the Euro needs to rise above 1.1070 (20-day SMA) to improve the outlook.

On the 4-hour chart, the pair is rebounding from a trendline, and technical indicators are starting to show the Dollar’s strength is fading. The Momentum is moving north, approaching the middle line, and the Relative Strength Index (RSI) is bouncing from near 70. However, price remains under the 20-SMA. A recovery above 1.1000 would indicate that the Euro could recover further, with the focus turning to 1.1050.

The EUR/USD dropped towards last week’s lows, but it remained above and rebounded, trimming losses during the American session. The pair held above the important support area of 1.0950. The dollar stays resilient, but momentum appears to be fading. Incoming US data and market sentiment are likely to be key drivers.

The Final Eurozone PMI showed little change, with the headline remaining at 42.7, and Germany’s at 38.8. The German Unemployment rate fell in July to 5.6%. The interest rate market suggests that the odds of another rate hike from the European Central Bank (ECB) are below 40%.

The US Dollar lost strength versus the Euro following mixed US data. The JOLTS Job Openings report came in below expectations at 9.58 million. The ISM Manufacturing PMI in July rose to 46.4, below the market’s expectation of 46.8. The Price Paid index fell from 41.8 to 42.6, and the Employment Index declined from 48.1 to 44.4. Despite the numbers, US yields moved modestly higher.

The Greenback remains strong, but the momentum versus the Euro is waning. On Wednesday, the focus will be on more US employment data with the ADP report, with the focus set on Friday’s Nonfarm Payrolls.

A second wave of inflation could dash US rate cut hopes

A second wave of inflation could dash US rate cut hopes

The US could experience a second wave of inflation, perhaps starting as soon as the next Consumer Price Index (CPI) data to be reported, according to StoneX market strategist Vincent Deluard. Inflation could pick up to a 3.5% annual rate in July due to base effects and a rally in the oil price, now over $80 per barrel from under $70 earlier this year. Such a second wave would echo history. Moreover, identifiable economic shocks could take inflation higher. Traders expecting the Fed not to raise rates this year, and to enact progressive interest cuts next year, could well be disappointed in inflation rises.

Euro area unemployment at 6.4%

Euro area unemployment at 6.4%

In June 2023, the euro area seasonally-adjusted unemployment rate was 6.4%, stable compared with May 2023 and down from 6.7% in June 2022. The EU unemployment rate was 5.9% in June 2023, also stable compared with May 2023 and down from 6.1% in June 2022. These figures are published by Eurostat, the statistical office of the European Union. Eurostat estimates that 12.802 million persons in the EU, of whom 10.814 million in the euro area, were unemployed in June 2023. Compared with May 2023, unemployment decreased by 2 thousand in the EU and by 62 thousand in the euro area. Compared with June 2022, unemployment

German labour market shows very first cracks

German labour market shows very first cracks

German unemployment increased by 62,000 in July, raising the number of unemployed to 2.617 million. The seasonally-adjusted unemployment rate, however, dropped to 5.6%, from 5.7% in June. For those who want to find some sign of weakening in the labour market, today’s report brought some reassurance: the July increase was the second largest July increase of the last 10 years. Compared with last year, unemployment was up by almost 150,000.

FIrst cracks in the labour market

The strong labour market has been an important driver of the economy’s resilience over the last few years. A combination of fiscal stimulus, furlough schemes and demographic change seems to have made the German labour market almost invincible. Now, however, it is showing some cracks. For the current wage negotiations, these first signs of cooling will be too small to have a significant impact. We still expect wage growth of around 5% this year and 4% in 2024. Not included in these numbers are one-off payments that have become more popular in wage bargaining since the government announced it would exempt one-off payments of up to 3000 euros from taxes and social contributions to help alleviate the impact of rising inflation.

The stagnating economy has dampened recruitment plans, both in the manufacturing and services sectors. The longer economic growth remains sluggish and uncertainty persists, the higher the likelihood that unions and employees will increasingly opt again for job security rather than high wage growth. As a result, the current wave of surging wages should be temporary and will represent more of a ‘catch-up’ after years of falling purchasing power, rather than a textbook-style wage-price spiral.

German labour market shows very first cracks

EURCHF current upleg could have legs

EURCHF current upleg could have legs

Technical Analysis – EURCHF current upleg could have legs

EURCHF is trading sideways today, a tad above the new 2023 low of 0.9521 recorded on July 27. This was the lowest print of the pair since September 29, 2022 as the bears finally staged their much-anticipated breakout from the 10-month-old rectangle.However, the good news for the bears appears to stop here as the momentum indicators are gradually turning in favour of the bulls. More specifically, the Average Directional Movement Index (ADX) traded to the highest level since December 2021, but it is now moving aggressively lower. This could be seen as a sign that the recent bearish trend has run its course. Similarly, the stochastic oscillator is preparing to rise above its oversold territory. If this move actually takes place, it could be a strong signal for the start of a bullish move.

Should the bulls feel inspired by the momentum indicators, they would like to reclaim the key 0.9650-0.9665 range that is defined by the January 15, 2015 low and the 23.6% Fibonacci retracement of the June 9, 2022 – September 26, 2022 downtrend respectively. Even higher, the 0.9706 area, populated by the November 14, 2022 low and the 50-day simple moving average (SMA), should prove stronger to overcome. If successful, the bulls could start thinking about pushing EURCHF back inside the recent rectangle.

On the flip side, the bears look determined to push EURCHF even lower. The first obstacle appears to be the August 23, 2022 low at 0.9552 and the recent 2023 low at 0.9521. Breaking these levels would mean that the door would be wide open for a more sizeable move towards the 0.9403 area, and the chance to record a new all-time low. To sum up, the bears remain in control of the market but there is increasing bullish pressure which could quickly gain traction if the bulls stage a rally above the 0.9665 area.

Rise in production fails to prevent further deterioration of CA operating conditions in July

Rise in production fails to prevent further deterioration of CA operating conditions in July

Canada’s manufacturing sector remained in contraction territory during July, but only just as a marginal rise in output and a weaker fall in new orders were registered. Job cuts were, however, more prominent, whilst there were accelerations in both input and output price inflation. Firms retained some confidence for the future, with sentiment picking up to a four-month high. The seasonally adjusted S&P Global Canada Manufacturing Purchasing Managers’ Index® (PMI®) posted below the 50.0 no-change mark for a third month running in July. However, rising to 49.6, from 48.8 in June, the headline index pointed to the

Australia’s central bank leaves rates unchanged at 4.1%

Australia’s central bank leaves rates unchanged at 4.1%

The Reserve Bank of Australia held interest rates at 4.1% for a second month on Tuesday as the central bank buys time to assess the impact of previous hikes, while warning of further hikes in the future.

This decision to hold rates steady comes as inflation in Australia slowed to 6% in the second quarter from 7% in the first quarter, but was still well above the RBA’s stated target of 2% to 3%.

Economists were divided on whether the Australian central bank would raise interest rates at this meeting, with a slim majority expecting a 25-basis point hike.

“The higher interest rates are working to establish a more sustainable balance between supply and demand in the economy and will continue to do so,” Governor Philip Lowe said in a statement.

“In light of this and the uncertainty surrounding the economic outlook, the Board again decided to hold interest rates steady this month. This will provide further time to assess the impact of the increase in interest rates to date and the economic outlook,” he added.

The Australian dollar extended earlier losses against the dollar after the announcement. It was trading down almost 0.7% at at about 0.67 to the dollar in afternoon trading in Asia.

The Australian central bank has hiked interest rates by a cumulative 400 basis points since May last year to its highest in 11 years. The country has been grappling with surging inflation as economic activity picked up after the height of the Covid-19 pandemic.

“While the RBA retains a tightening bias, we expect the hurdle to another rate is high,” Commonwealth Bank of Australia economists said in a note. “It would take an upside surprise to the economic data from here, namely on prices and/or wages, for the RBA to shift its assessment of the outlook.”

Forward guidance

In his August policy statement, the RBA governor pointed to several “significant uncertainties.”

Among them is the lag time that policy takes root in the real economy, and how firms’ pricing decisions and wages will respond to the slowing economy at a time when the labor market remains tight.

Lowe pointed to consumption growth that has substantially slowed due to cost of living pressures and higher interest rates.

“The central forecast is for CPI inflation to continue to decline, to be around 3.25% by the end of 2024 and to be back within the 2-3 per cent target range in late 2025,” Lowe said.

“Some further tightening of monetary policy may be required to ensure that inflation returns to target in a reasonable timeframe, but that will depend upon the data and the evolving assessment of risks,” he added.

Tuesday’s RBA policy meeting is Philip Lowe’s penultimate meeting as governor. Michele Bullock is set to succeed him when he finishes a seven-year term in office on Sept. 17.

​​​​Nasdaq 100 and S&P 500 Near Recent Highs, Hang Seng Drops Back From Three-Month High​​​​

​​​​Nasdaq 100 and S&P 500 Near Recent Highs, Hang Seng Drops Back From Three-Month High​​​​

Nasdaq 100, S&P 500, Hang Seng Prices, Analysis, and Charts

​​​Nasdaq 100 steady after recent gains

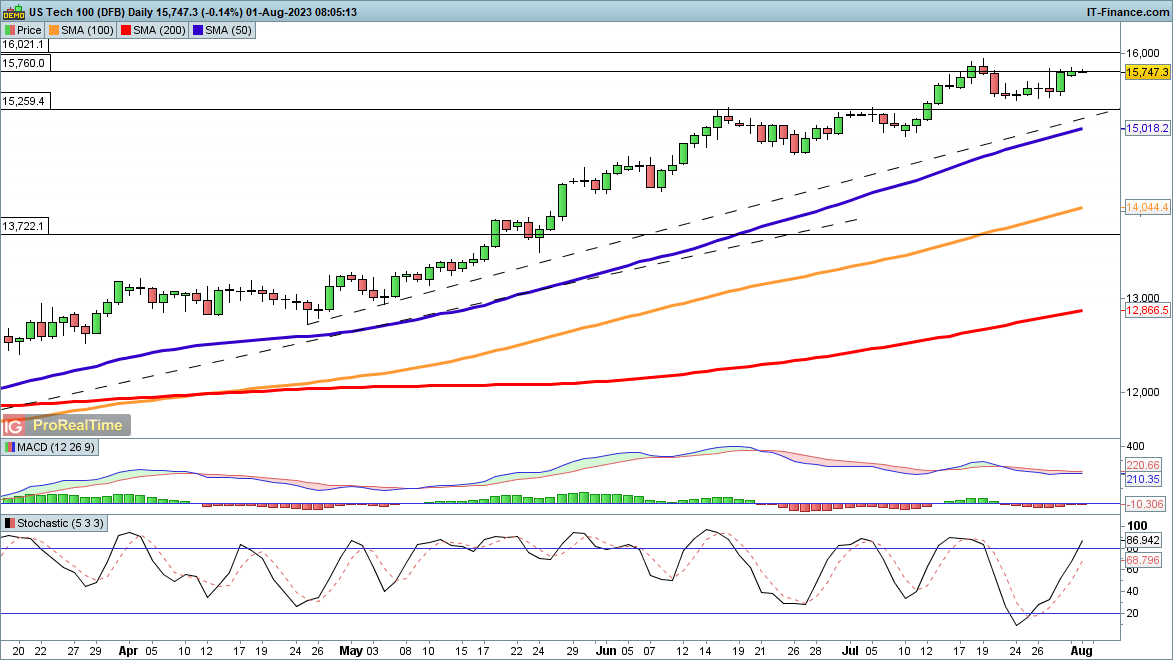
​The steady rally here goes on, with no sign of a downturn at hand.​Late July saw a brief pullback, but this resolved into a move higher that has left the price back within 200 points of the July high. Above 15,930, the price targets 16,021, and then above this the 16,630 high from January. Finally the 16,769 record high from late 2020 comes into view.

In the event of a reversal, trendline support from mid-April comes into play, towards 15,300, and then below this 15,260 and then the 50-day SMA are current downside targets.

Nasdaq 100 Daily Price Chart

​S&P 500 holds near 2023 high

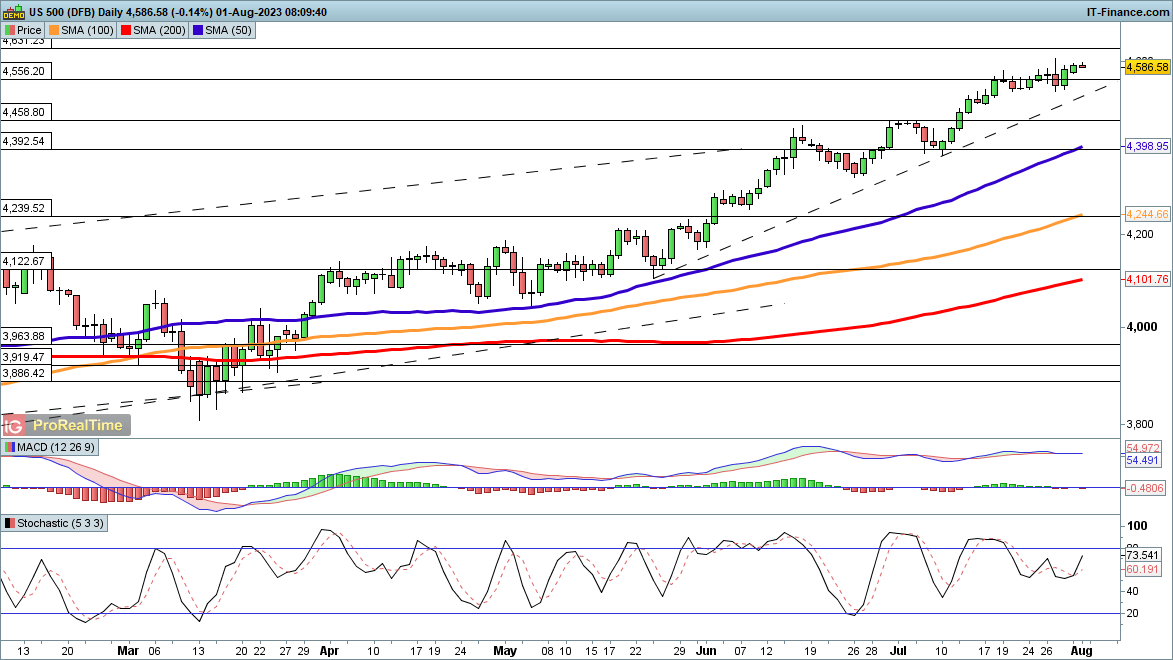
​This index has also seen little in the way of downside. Short-term drops in June and July found buyers very quickly.​March 2022’s high at 4631 could come into play soon, and above this would see the index sitting at its highest level since January 2022. Further gains then target 4743 and then the record high at 4817.

​In the event of a pullback, the price would first test nearby trendline support from the early May low,and then on to 4458, before heading towards the rising 50-day SMA (currently 4398).

S&P 500 Daily Price Chart

​Hang Seng edges back from a three-month high

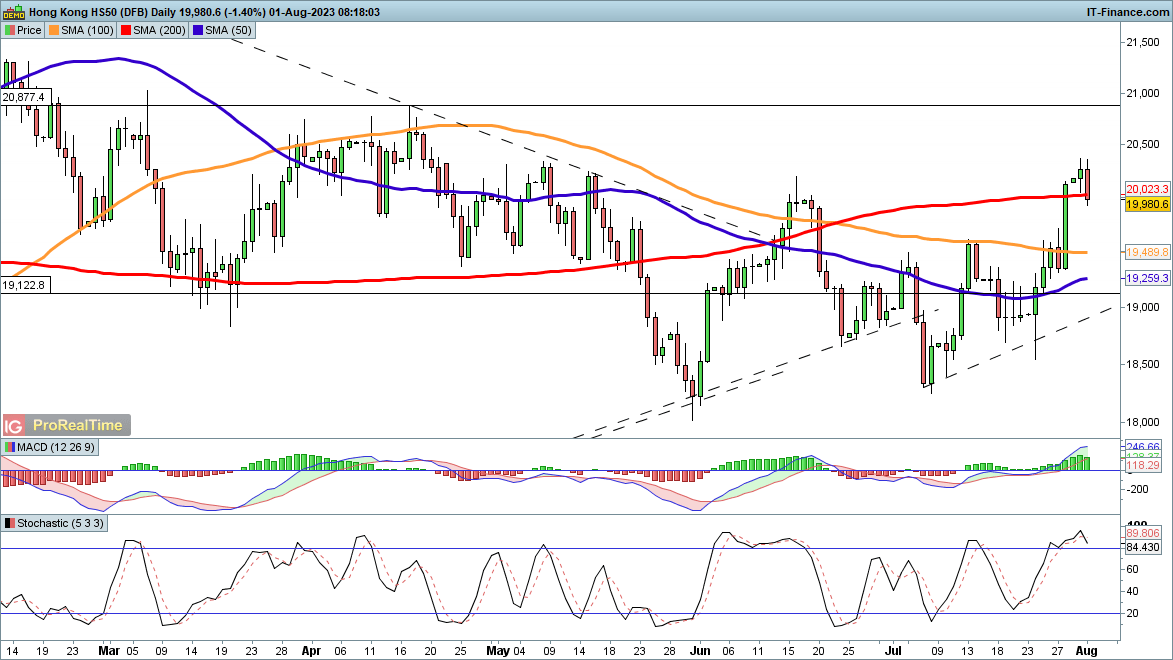
​A huge rally from the July low has seen the index move back above the 200-day SMA, though it has dropped back in early trading this morning.​The price has dropped back below the June peak of around 20,000, a potentially worrying sign, but given the scale of the move since the beginning of July, some weakness was to be expected. The price has also pulled away from trendline support from the July lows, leaving it potentially exposed in the short-term.

​Above 20,375, the high seen on Monday, the price will target 20,730, the high from April.

Hang Seng Daily Price Chart

​