WHY TRADE CRUDE OIL AND HOW DOES CRUDE OIL TRADING WORK?
Crude oil is the world economy’s primary energy source, making it a very popular commodity to trade. A naturally occurring fossil fuel, it can be refined into various products like gasoline (petrol), diesel, lubricants, wax and other petrochemicals. It is highly demanded, traded in volume, and extremely liquid. Oil trading therefore involves tight spreads, frequent chart patterns, and high volatility.
Brent crude is the world’s benchmark for oil with almost two thirds of oil contracts traded being Brent oil. WTI is America’s benchmark oil, it is a slightly sweeter and lighter oil compared to Brent.
CRUDE OIL TRADING HOURS
WTI trades on CME Globex:
Sunday – Friday, 6:00 p.m. – 5:00 p.m. (with an hour break from 5:00 p.m. to 6:00 p.m. each day)
Brent trades on ICE:
Sunday – Friday – 7:00 p.m. – 5:00 p.m.
CRUDE OIL TRADING BASICS: UNDERSTANDING WHAT AFFECTS PRICE MOVEMENTS
When trading oil, the two major focal points are, as with many commodities, supply and demand. Whether there was an economic report like a news event or press release or tensions in the Middle East, the two factors that will be taken into consideration is how supply and demand is affected, because this will affect the price.
Supply Factors
- Outages or maintenance in key refineries around the globe, whether it’s the Forties pipeline in the North Sea or the Port Arthur refinery in Texas, must be monitored because of the effect it can have on the supply of oil. War in the Middle East leads to concerns about supply. For example, when the Libyan Civil war began in 2011, prices had seen a 25% rise from in the space of a couple of months.
- OPEC (Organization of the Petroleum Exporting Countries) production cuts or extensions lead to changes in the price of oil. For example, back in 2016 when the cartel had announced their decision to curb global supply by 1.9% (see chart below), the price of oil has risen from $44/bbl to as much as $80/bbl.
WTI and Brent Crude price reaction to OPEC supply cut:
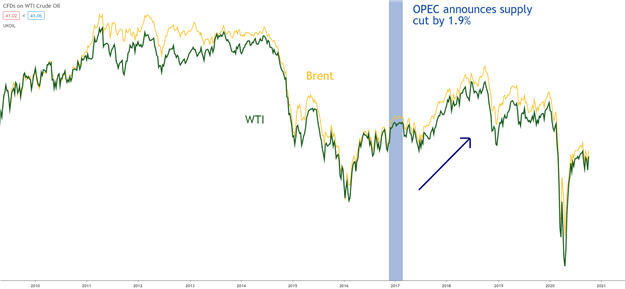
Chart prepared by Warren Venketas, TradingView
- Oil Suppliers: Similarly, with understanding the importance of OPEC, it is also worth knowing who the top global oil suppliers are, and this information can be fond from the EIA website.
Demand Factors
- Seasonality: Hot summers can lead to increased activity and higher oil consumption. Cold winters cause people to consume more oil products to heat their houses.
- Oil Consumers: The largest consumers of oil have typically been developed nations such as the U.S. and European countries. However, in recent times there has been a surge in oil consumption in Asian countries, namely China and Japan. As such, it is important for traders to pay attention to the level of demand from these nations, alongside their economic performance. Any slowdown could affect oil prices and demand may fall.
- Correlation to Global Growth: The chart below shows the largely positive correlation between the price of crude oil and global growth. The Chinese and US economies being the two largest in the world are a great barometer for global growth. The chart includes their respective major stock indices which move in line with crude oil prices – when the equity indices fall, the price of crude oil tends to fall and vice versa.
WTI and Brent Crude positive correlation with FTSE China A50 and S&P 500 chart representation:
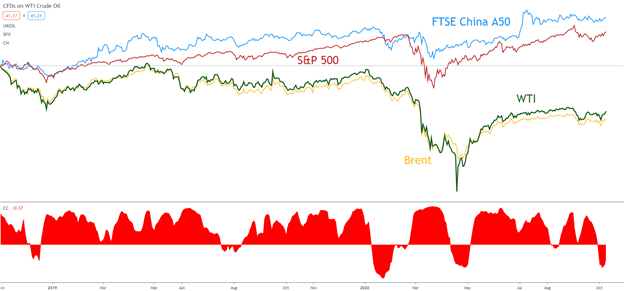
Chart prepared by Warren Venketas, TradingView
- Alternative Energy: While fossil fuels such as oil and gas continue to dominate cleaner energy sources, there is an incessant push towards sustainability on a global scale. This will definitely impact crude oil prices going forward which makes this a key factor to monitor in a crude oil trading strategy.
The impact of derivatives on the traditional valuations of crude oil have been thought by many to have destabilized the asset class. Simply put, the oil futures are thought to have reflected higher proportions of noise which do not reflect the fundamental data at the time. This is contentious within the investing community with some in disagreement with the above rationale, but it cannot be ignored that large speculative traders are becoming more influential with the flourishing derivative market.
Want to know more about oil? Here are 8 Surprising Crude Oil Facts Every Trader Should Know !
HOW TO TRADE OIL: TOP TIPS AND STRATEGIES
Expert oil traders generally follow a strategy. They will understand the fundamental factors that affect the price of oil and use a trading strategy that suits their trading style. Each trading strategy is different, risk management is an important component to consistent trading, like the effective use of leverage and avoiding top trading mistakes.
A comprehensive crude oil trading strategy could include:
- Fundamental Analysis
- Technical Analysis
- Risk Management
Once a trader understands the fundamental supply and demand factors that affect the price of oil, he/she can look for entries into the market using technical analysis. Then, when a buy or sell signal has been identified using technical analysis, the trader can implement the proper risk management techniques. Let’s go through an example using the steps outlined above:
- Fundamental Analysis
On the 30th of November 2017, OPEC and Russia agreed to extend an oil production cut, which lead to a decrease in supply. The basic theory of supply and demand suggests that a decrease in supply should be succeeded by an increase in demand and consequently price. This is the fundamental analysis a trader would need to incorporate into their strategy in order to identify potential buy signals in the market.
WTI daily chart highlighting supply cut:
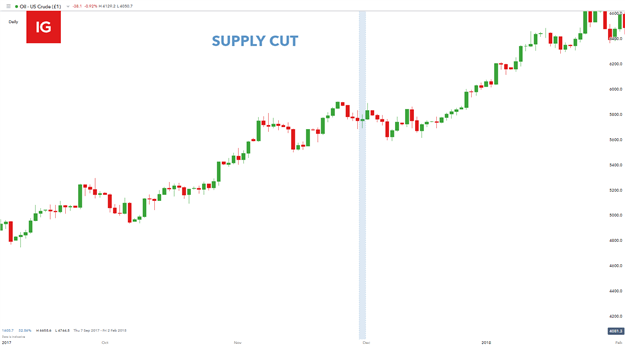
Chart prepared by Warren Venketas, IG
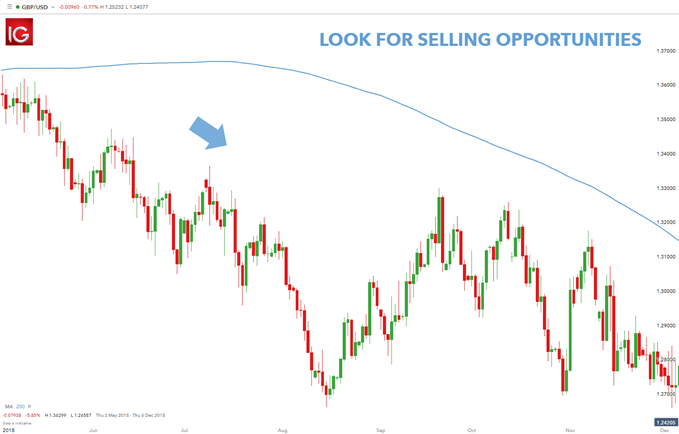
2. Technical Analysis
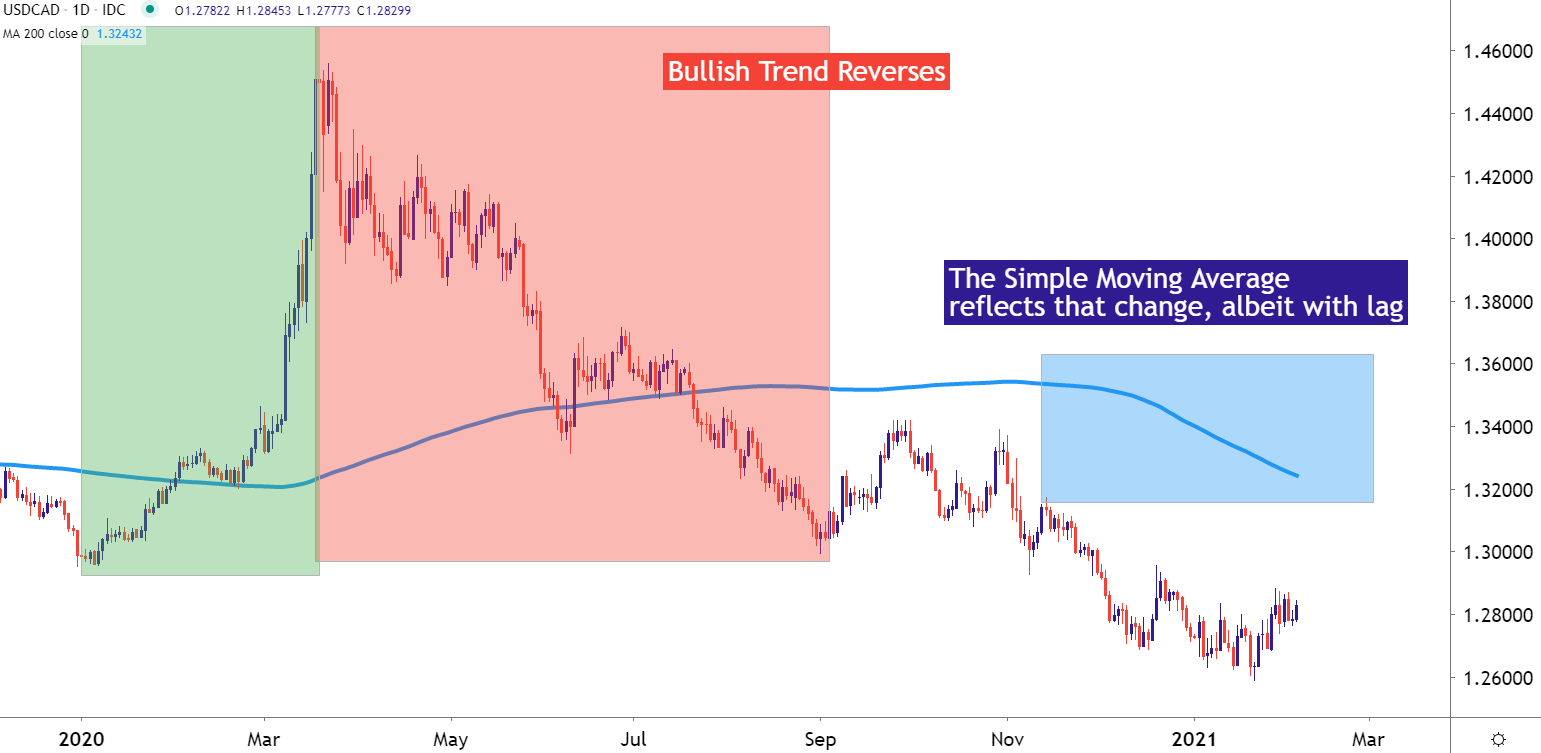
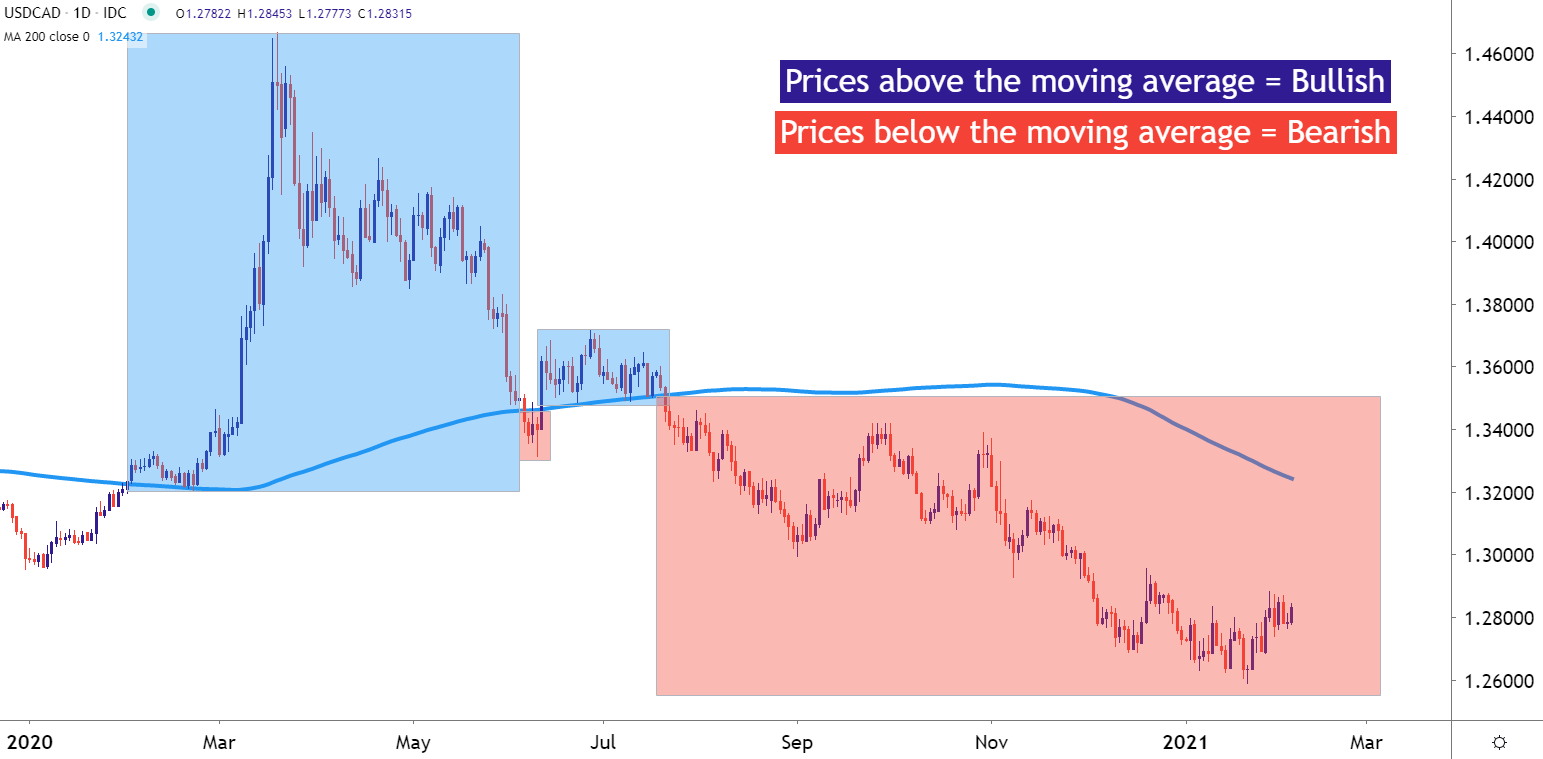
The next step would be to analyze the chart using technical analysis. There are a variety of technical indicators and price patterns a trader can use to look for signals to enter the market. There is no need to use many technical indicators, one that you understand well will do the job. A common yet very effective way to begin analyzing any chart is to identify the overall trend of the market. In this example, the implementation of simple price action is used to identify higher highs and higher lows which is suggestive of a preceding upward trend. This falls in line with our fundamental expectation of further upward price movement.
WTI daily chart showing preceding upward trend:
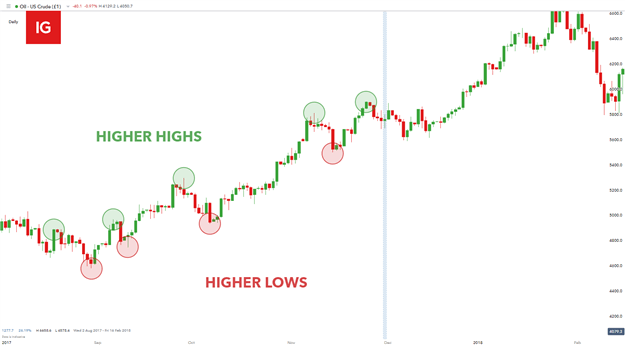
Chart prepared by Warren Venketas, IG
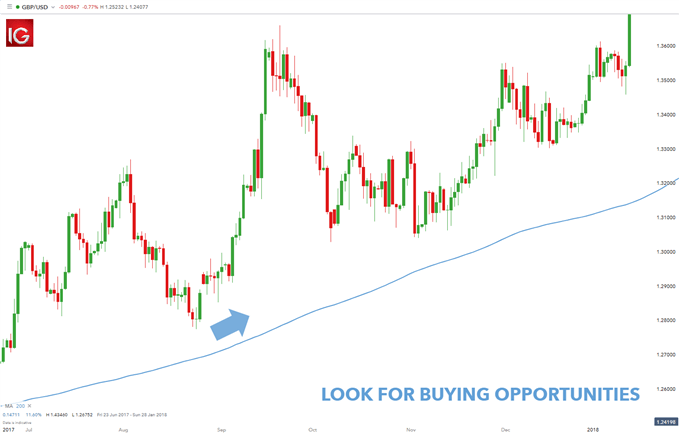
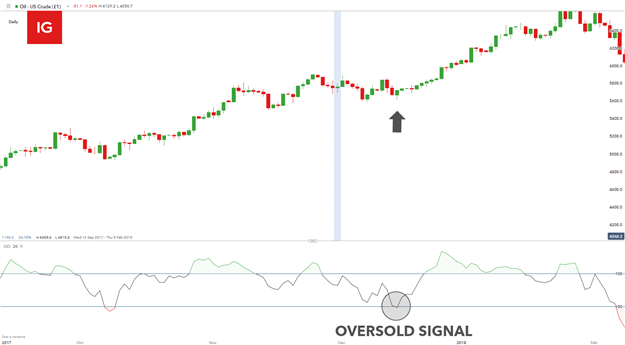
Once the bullish trend has been confirmed, the next step in the trading strategy would be to recognize possible entry points. Again, there are multiple tools and techniques to locate entry points but this example uses the Commodity Channel Index (CCI) indicator which moves into oversold territory shortly after the fundamental supply cut announcement was made. An oversold signal on the CCI advocates further price appreciation and the possibility of a long (buy) entry.
WTI daily chart with CCI indicator:
3. Risk Management
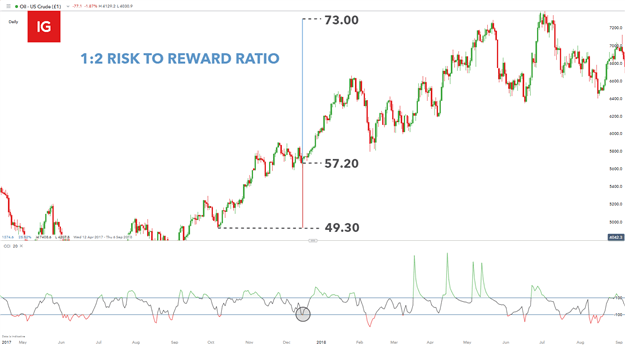
The final step in any trading strategy would be to employ sound risk management to every trade. At DailyFX we support the 1:2 risk-reward ratio guideline which basically means that the target level should be roughly two times more than the position stop-loss level. To manage risk, the trader could look to set a take-profit above the recent high and set a stop-loss at the recent low.
In this example, a recent swing low ($49.30) has been identified as stop level which is approximately $8 away from the entry price ($57.20). There is no recent high which in this case which would allow for a target projection using basic math. With the stop distance being roughly $8 away from entry, a 1:2 projection could seee initial resistance at the $73 level.
WTI daily chart with 1:2 risk-reward ratio:
This sample trade would illustrate a positive risk to reward ratio. We researched millions of live trades in a variety of markets and discovered a positive risk to reward ratio was a key element to consistent trading. Additionally, at DailyFX, we recommend risking less than 5% of capital on all open trades.
ADVANCED TIPS FOR OIL TRADING
Advanced traders can incorporate additional information when setting up trades. Traders sometimes look at the futures curve to forecast future demand, CFTC speculative positioning to understand the current market dynamic and can use options to take advantage of forecasted high volatility moves or to hedge current positions.
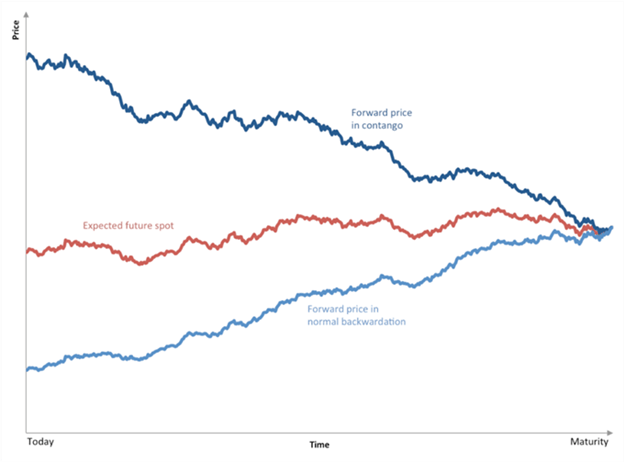
Futures Curve: The shape of the futures curve is important for commodity hedges and speculators. As such, when investors analyze the curve, they look for two things, whether the market is in contango or backwardation:
- Contango: This is a situation in which the futures price of a commodity is above the expected spot price, as investors are willing to pay more for a commodity at some point in the future than the actual expected price. This typically signals a bearish structure.
- Backwardation: This is a situation when the spot price is above the forward price for a commodity. This typically signals a bullish structure.
CFTC/Speculative Positioning:
The Commodity Future Trading Commission Report (CFTC) is important when trading crude oil futures. It provides traders with information related to market dynamics and therefore s can be a good way to gain a sense of where oil prices are heading. Movements in the CFTC managed money net positions typically precede the move in oil prices.
Trading via futures and options
Buying futures and options, a trader must use the appropriate exchange for the oil benchmark he/she wants to trade. Most exchanges have criteria for who is allowed trade on them, so the majority of futures speculation is undertaken by professionals.
Oil Investing
Instead of trading the individual market, a trader can get exposure to oil through shares of oil companies or through energy-based exchange traded funds (ETFs). The price of oil companies and ETFs are heavily influenced by the price of oil.
Major Oil/Energy ETFs:
- Energy Select Sector SPDR (XLE)
- Vanguard Energy ETF (VDE)
- United States Energy Fund (USO)
KEY REPORTS EVERY OIL TRADER SHOULD FOLLOW
Weekly updates on the amount of crude oil inventories in the U.S. are very important pieces of data for oil traders – the release of which frequently leads to a bout of volatility. The inventory data is an important barometer for oil demand. For example, if weekly inventories are increasing, this would suggest that demand for oil is dropping, while a drop in inventories suggests that oil demand is outstripping supply.
- American Petroleum Institute (API): The API produces a weekly statistical report, which highlights the most important petroleum products that account for more than 80% of total refinery production, while crude oil inventories are also included. This data is typically released on Tuesday at 16:30ET/21:30 London time.
- Department of Energy (DoE/EIA): Much like the API report, the DoE report provides information on the supply of oil and the level of inventories of crude oil and refined products. This is announced on Wednesday at 10:30ET/15:30 London time.
USING SOCIAL MEDIA TO TRADE CRUDE OIL
Over the years, social media has become an increasingly useful platform to share ideas, pass on information and receive breaking news. This is the case for oil traders using #OOTT, which stands for the “Organization of Oil Traders” on Twitter. Here traders and industry leaders provide breaking news and key reports related to the oil market.