Natural Gas and Oil Forecast: Geopolitical Tensions and OPEC+ Cuts Shape Market

Global Oil Dynamics: Navigating Supply Cuts and Geopolitical Tensions

In Asian trading on Monday, Crude Oil prices experienced a modest increase, sustained by OPEC+’s decision to continue its production cuts through the second quarter. However, the upward trend was tempered by U.S. calls for an immediate ceasefire between Israel and Hamas.

Despite this, the oil market has enjoyed significant gains in the past two weeks, driven by the anticipation of tighter supplies and the prospect of a decline in U.S. interest rates.

The OPEC+ commitment to maintain a reduction of 2.2 million barrels per day in supply until June suggests a tighter global oil supply. However, concerns over weakening demand and high U.S. production could offset these supply constraints.

This mixed outlook could influence the daily forecasts for commodities like Natural Gas and Oil, as geopolitical tensions and economic policies affect market sentiment.

Natural Gas Price Forecast

NG Price Chart
Natural Gas (NG) witnessed a significant uptick, registering a 3.49% increase to $1.9290, reflecting market optimism. Despite this rally, NG trades below the pivotal $1.9399, suggesting cautious sentiment among traders.

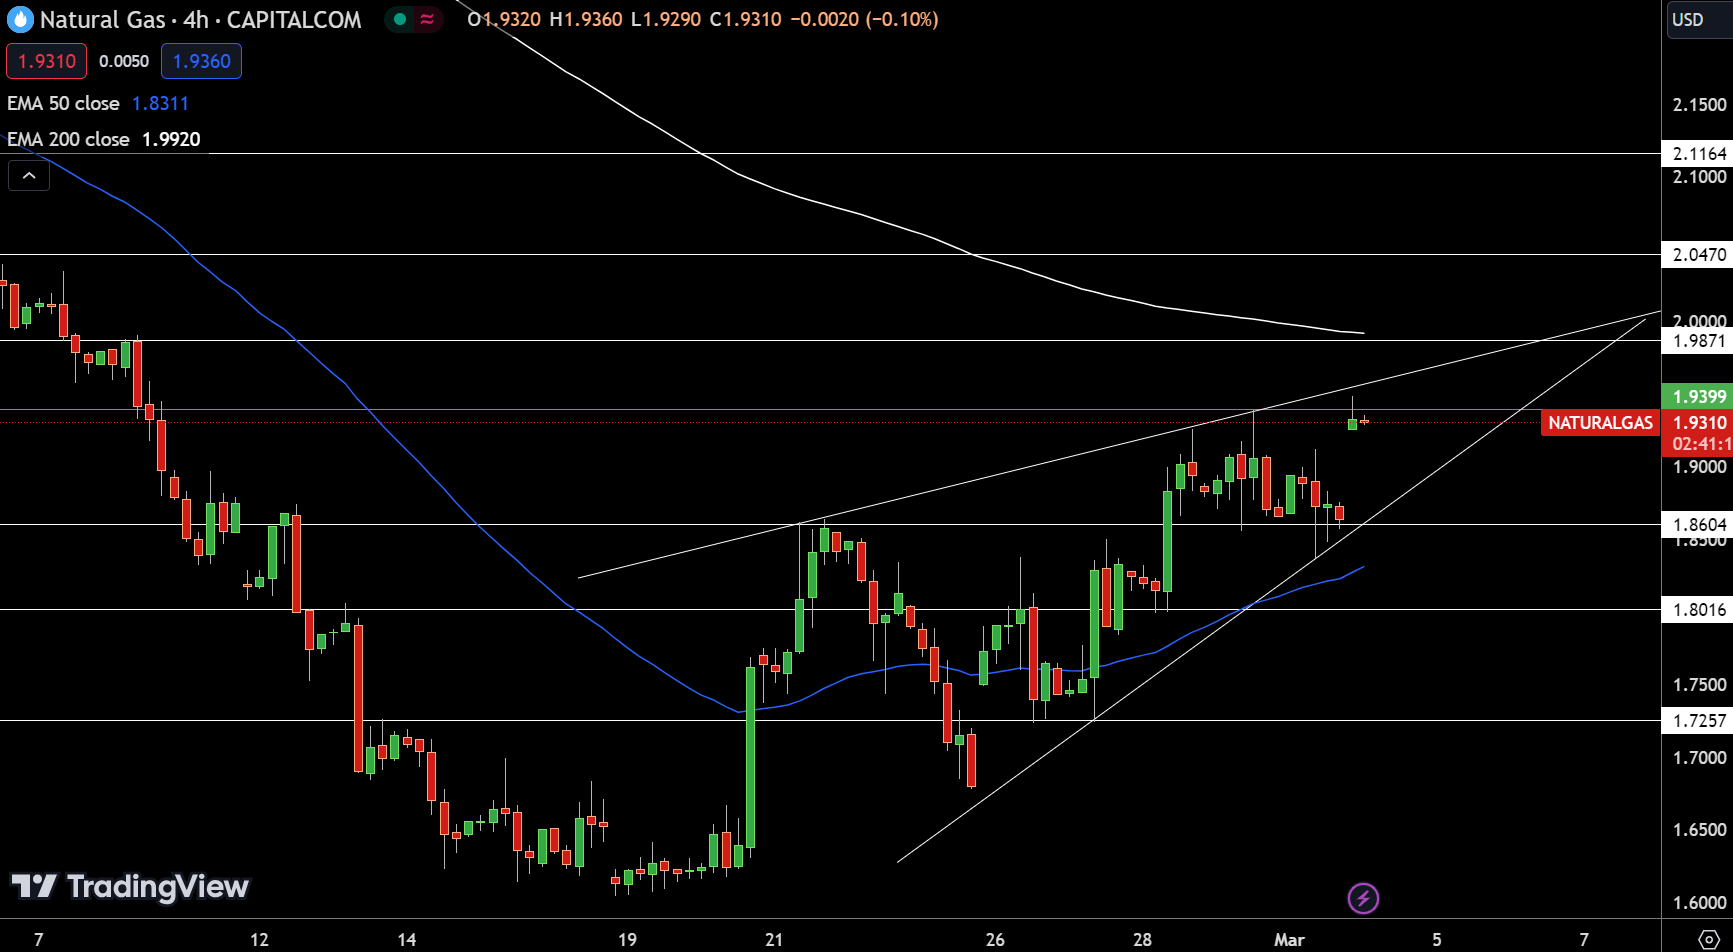
Key resistance levels at $1.9871, $2.0470, and $2.1164 mark potential hurdles for further gains, while support at $1.8604, followed by $1.8016 and $1.7257, offers a safety net against declines.

The 50-Day and 200-Day EMAs, at $1.8311 and $1.9920 respectively, highlight a mixed outlook. With NG currently bearish below $1.9399, surpassing this threshold could signal a shift towards a bullish trend.

WTI Oil Price Forecast

WTI Price Chart
Crude Oil (USOIL) marginally decreased by 0.17%, settling at $79.89. Currently hovering above its pivot point at $79.29, it exhibits a tentative bullish stance. Resistance levels at $80.36, $81.06, and $81.80 delineate potential barriers for upward movement.

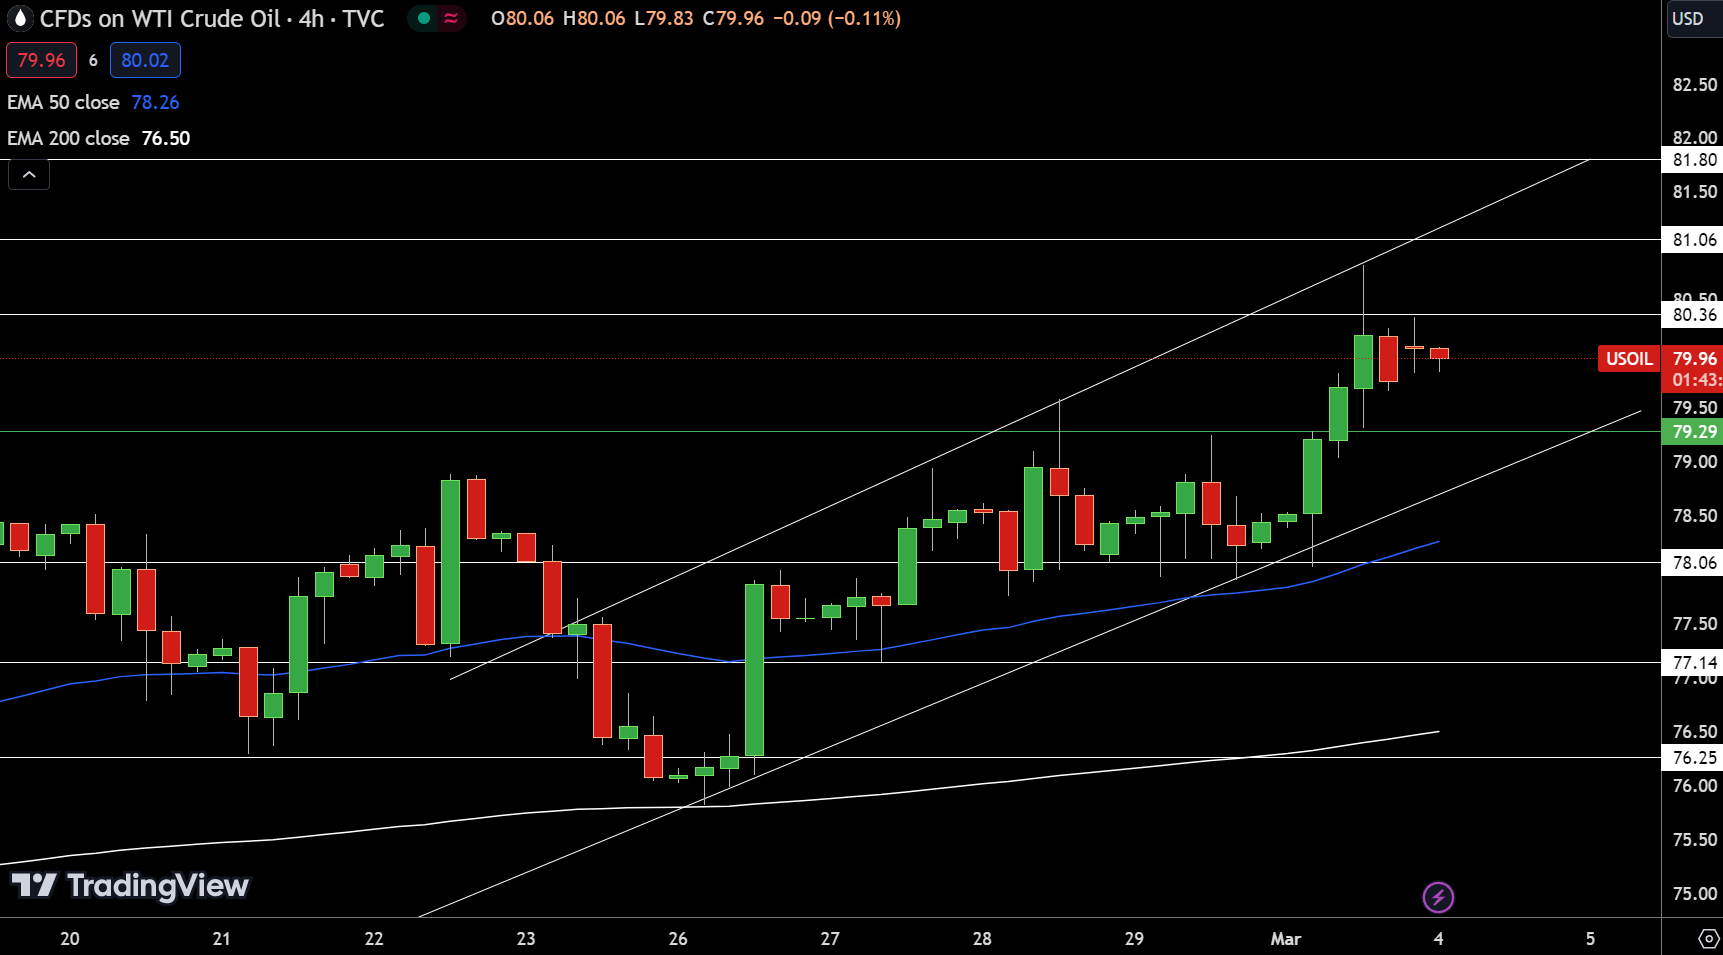
Conversely, support positions at $78.06, $77.14, and $76.25 offer fallback points in case of a price pullback. The 50-Day and 200-Day Exponential Moving Averages, at $78.26 and $76.50 respectively, underscore a bullish trend.

Therefore, USOIL’s market outlook remains optimistic above the $79.29 mark, hinting at a continued upward trajectory barring any significant market shifts.

Brent Oil Price Forecast

UKOIL Price Chart
UKOIL Price ChartBrent Oil (UKOIL) experienced a slight decline of 0.31%, trading at $83.58. Positioned above its pivot point at $83.02, UKOIL indicates a bullish outlook. Resistance levels at $83.94, $84.88, and $85.80 could challenge further gains.

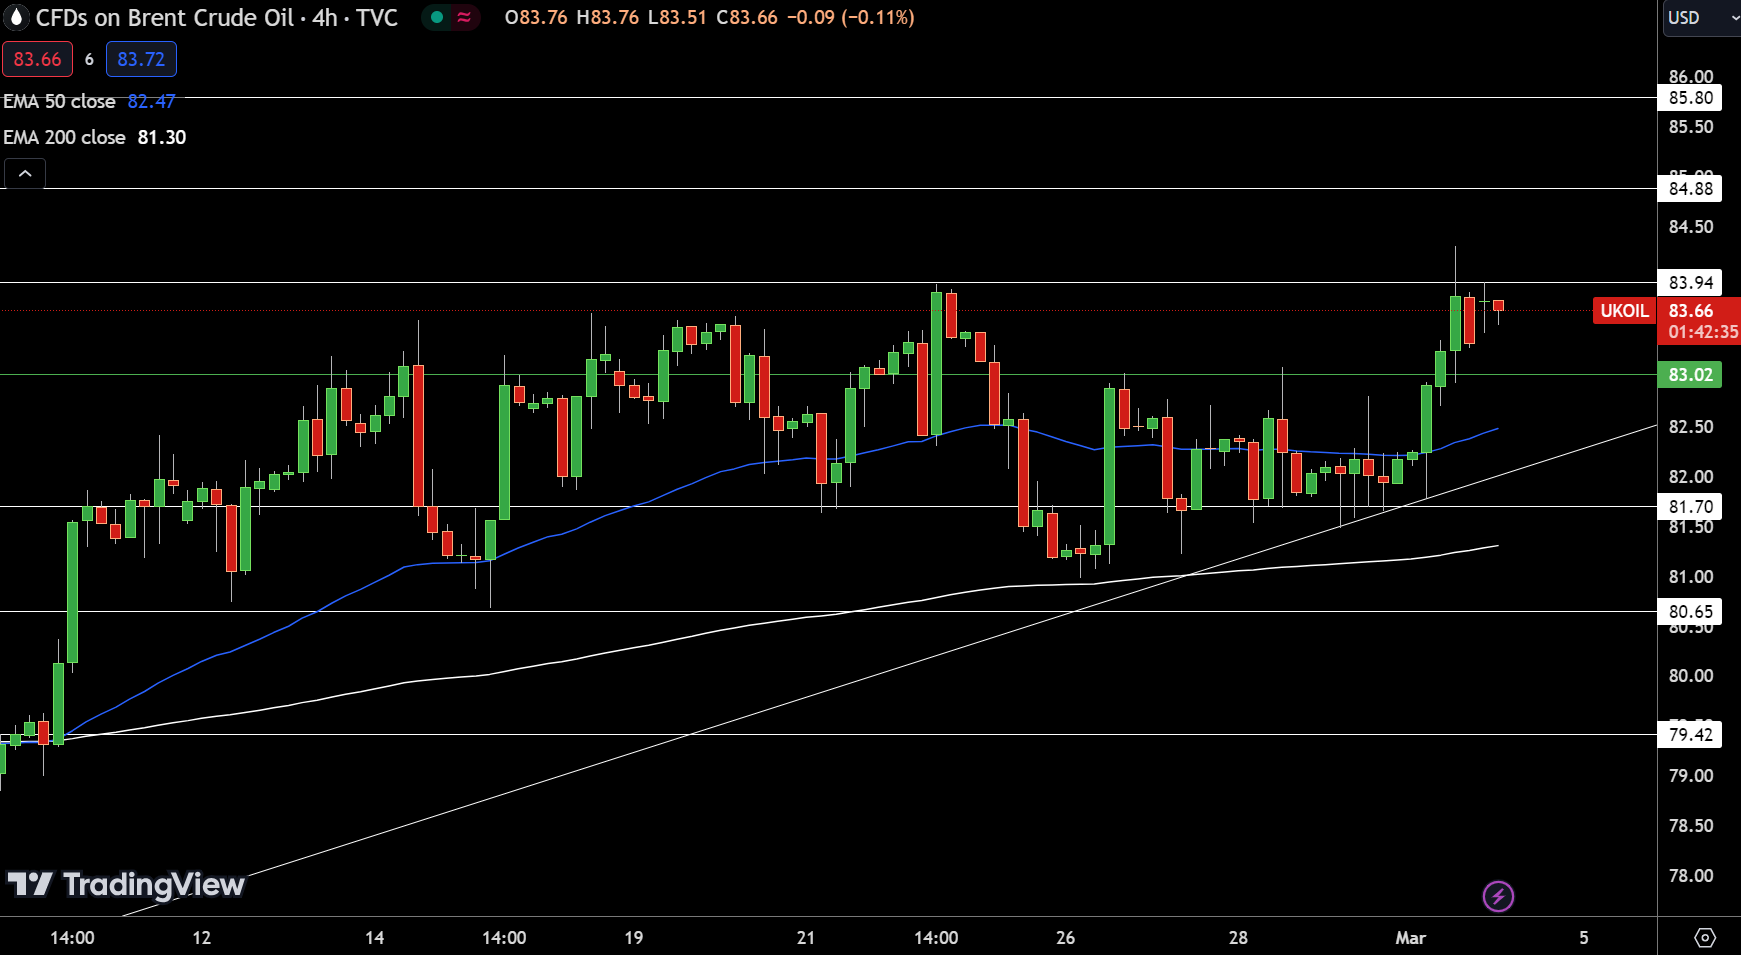
Support levels at $81.70, $80.65, and $79.42 provide a safety net against potential drops. The 50-Day and 200-Day Exponential Moving Averages, at $82.47 and $81.30 respectively, underscore a positive momentum.

Thus, UKOIL’s market sentiment remains bullish above the $83 threshold, suggesting potential for continued upward movement.

Gold, Silver, Copper Daily Forecast: Rate Cuts Propel XAU Near $2,100; Buy Now?

Metals Market Watch: Gold Hits Nine-Week High Amid Rate Cut Expectations

Gold (XAU/USD) approaches a nine-week pinnacle, flirting with the $2,100 threshold as recent U.S. economic setbacks fuel rate cut speculations, bolstering gold’s allure.

Simultaneously, silver and copper navigate through market nuances, influenced by broader economic indicators and Federal Reserve policies. Gold’s climb, amidst softened U.S. Treasury yields, underscores investor’s heightened interest, positioning gold near $2,080.

U.S. Manufacturing PMI’s contraction and Fed’s steady policy rate amplify gold’s appeal, juxtaposed against mixed signals from Chinese manufacturing. Upcoming economic announcements, including Chinese Services PMI and U.S. ISM Services PMI, alongside Fed Chair Powell’s testimony and U.S. NFP data, are poised to shape the metals’ market trajectory.

Gold Prices Forecast

Gold - Chart
Gold – ChartGold‘s recent downturn, with a minor decrease to $2080.88, navigates through a cautious market. Positioned below a pivotal $2088.49, it faces resistance at $2100.68, $2112.88, and $2123.01, suggesting hurdles for an upward trajectory.

Conversely, support levels at $2069.75, $2058.28, and $2046.58 offer potential stability. The Relative Strength Index (RSI) and the 50-Day and 200-Day Exponential Moving Averages (EMAs) at $2040.05 and $2029.48, respectively, signal a bearish outlook under $2088.49.

Yet, surpassing this threshold could pivot towards bullish sentiment, highlighting the delicate balance in gold’s current market dynamics.

Silver Prices Forecast

Silver - Chart
Silver – Chart

Silver‘s price slightly decreased to $23.04, reflecting a cautious sentiment in the market. Positioned just under the pivot point of $23.11, it confronts immediate resistance levels at $23.28, $23.43, and $23.63, which could limit upward movements.

Support levels are established at $22.92, $22.75, and $22.58, suggesting areas where declines might stabilize. The 50-Day and 200-Day Exponential Moving Averages, at $22.73 and $22.82 respectively, indicate a potential for bullish momentum if silver surpasses the $23.11 mark.

However, remaining below this threshold could maintain bearish pressure, underscoring the importance of these key price levels in determining silver’s short-term direction.

Copper Prices Forecast

Copper - Chart
Copper – ChartCopper‘s market dynamics present a slight downturn, with its price at $3.84, marking a 0.30% decline. The metal hovers around its pivot point of $3.84, suggesting a balanced field of play between buyers and sellers.

Resistance levels at $3.87, $3.91, and $3.94 delineate potential ceilings for price escalations, while support at $3.81, followed by $3.78 and $3.75, outlines critical zones for price stabilization.

The close proximity of the 50-Day EMA ($3.85) to the current price, alongside the 200-Day EMA ($3.83), indicates a narrowly bullish sentiment, contingent on sustaining above the pivot point. This subtle bullish bias underscores copper’s potential for upward movement, provided it maintains above $3.84.

XRP News Today: SEC vs. Ripple Case Outcome Predictions Unveiled

The Sunday Overview

On Sunday, XRP declined by 2.68%. Partially reversing a 7.20% rally from Saturday, XRP ended the session at $0.6277. Significantly, XRP ended a three-session winning streak.

XRP Remains Susceptible to Profit-Taking

There were no SEC v Ripple case-related updates for investors to consider on Sunday. The SEC and Ripple are preparing remedy-related briefs. The remedy-related briefs give the SEC and Ripple the medium to argue for and against a punitive penalty. In July 2023, Judge Analisa Torres ruled Ripple sold unregistered XRP securities to US institutional investors.

Ripple will use US legal precedent to argue for a reduced penalty considering the lack of fraud. In contrast, the SEC wants a punitive penalty as a deterrent. Another reason could be to salvage credibility after the ruling on Programmatic Sales of XRP. In the July rulings, Judge Torres ruled programmatic sales of XRP did not satisfy the third prong of the Howey Test.

Notably, the Terraform Labs ruling may have incentivized the SEC to pursue an appeal against the Programmatic Sales ruling. Judge Rakoff ruled that Luna and TerraUSD are securities. The lingering SEC threat to appeal against the Programmatic Sales ruling remains an XRP headwind.

However, rulings from other SEC cases against crypto firms could pour cold water on plans to appeal.

SEC v Coinbase: Motion to Dismiss Ruling on the Horizon

Coinbase (COIN) filed a Motion to Dismiss (MTD) in August 2023, arguing the SEC lacked the statutory authority to regulate crypto exchanges.

The Motion to Dismiss relates to SEC charges alleging Coinbase operated as an unregistered securities exchange, broker, and clearing agency. Additionally, the SEC charged Coinbase for the unregistered offering and selling of securities in connection with its staking-as-a-service program.

Significantly, if Judge Katherine Failla grants the MTD, the courts could force the SEC to step back from regulating crypto exchanges through enforcement. It could also set a precedent for the listed cryptos in the case that the SEC alleges are securities.

Legal experts believe that if the judge grants the MTD, the SEC will settle the SEC v Ripple case.

According to the SEC v Ripple court briefing schedule, Judge Torres will begin deliberating on the penalty after May 6. A court ruling on the Coinbase MTD before May 6 could swiftly conclude the SEC v Ripple case. An SEC settlement would remove the chance of appealing against the Programmatic Sales of XRP ruling.

XRP Price Action

Weekly Chart sends bullish price signals.
Daily ChartXRP sat well above the 50-day and 200-day EMAs, affirming bullish price signals. Additionally, the 50-day EMA crossed above the 200-day EMA, another bullish signal.

An XRP break above the $0.6354 resistance level would support a move toward the $0.7047 resistance level.

BTC-spot ETF-related news and SEC v crypto-related updates need consideration.

However, if the price falls below the $0.6250 handle, it could prompt bearish momentum toward the $0.5835 support level.

The 14-day RSI reading, 68.33, suggests an XRP break above the $0.6354 resistance level before entering overbought territory.

XRP Daily Chart affirms bullish price signals.
4-Hourly ChartOn the 4-hourly, XRP hovered well above the 50-day and 200-day EMAs, affirming the bullish price signals.

An XRP breakout from the $0.6354 resistance level would give the bulls a run at the $0.7047 resistance level.

However, a drop below the $0.62 handle would bring the $0.5835 support level into play.

The 4-hourly RSI, with a reading of 58.78, indicates an XRP move to the $0.65 handle before entering overbought territory.

4-Hourly Chart reaffirms bullish price signals.


Euro Trade Setups Ahead of ECB Decision – EUR/USD, EUR/GBP and EUR/JPY

The economic calendar has a handful of high-importance releases and events next week with the two standouts, the ECB policy meeting and US Nonfarm Payrolls likely to gather the most interest. The ECB will keep all policy settings unchanged but may hint when rate cuts are expected to start. Financial markets are pricing in the first 25 basis point ECB rate cut at the June meeting and it will be interesting to note if ECB President Lagarde, or any of the other ECB voting members, push back against this.

On Friday the latest US Jobs Report will be released with market forecast of +190k. Last month’s report saw a blockbuster 353k new jobs announced and if history is any guide, last month’s number is likely to be revised lower.

image1.png

EUR/USD is currently trading around the 200-day simple moving average, and next week’s releases and events are likely to help the pair make a more decisive move. Support for the pair is seen between 1.0787 to 1.0800 – this week’s lows, the 20-day sma, and an old swing high – and if this breaks then the February 14th multi-month low at 1.0695 may come into play. A clean break above the 200-day sma will bring a cluster of recent highs, the 50-day sma, and the 23.6% Fibonacci retracement level all around the 1.0850/60 level back into focus.

EUR/USD Daily Price Chart

image2.png

EUR/GBP has nudged higher all week and now changes hands around 0.8564 and back above the 20-day sma. This week’s move higher has bought a cluster of recent highs – all the way up to 0.8578 and the 50-day sma at 0.8588 back into focus. Above here, the 200-day sma at 0.8610 and a cluster of early-mid January highs around 0.8620 should be noted.

EUR/GBP Daily Price Chart

image3.png

Retail trader data shows 67.32% of traders are net-long with the ratio of traders long to short at 2.06 to 1.The number of traders net-long is 3.47% lower than yesterday and 18.20% lower than last week, while the number of traders net-short is 7.69% lower than yesterday and 16.76% higher than last week.

We typically take a contrarian view to crowd sentiment, and the fact traders are net-long suggests EUR/GBPprices may continue to fall. Positioning is more net-long than yesterday but less net-long from last week. The combination of current sentiment and recent changes gives us a further mixed EUR/GBP trading bias.

The Japanese Yen remains under the influence of the Bank of Japan and the Ministry of Finance for now as traders monitor language from the two official institutions. In contrast to the ECB, traders are looking for any hints as to when the Bank of Japan will begin to raise rates after keeping them at ultra-low levels for years.

Japanese Yen Grabs a Bid, Emboldened by Bank of Japan Talk

EUR/JPY will also be under the Euro’s influence next week and the outlook looks choppy for the pair. The recent run higher from the February 7th low looks broken and the 20-day sma at 161.70 looks vulnerable. Below here, the 161 zone comes into focus ahead of the 50-day sma and big support around 160.00. The February 26th high at 163.72 should cap any break higher.

EUR/JPY Daily Price Chart

image4.png

Gold Price Forecast: Bullish Breakout Continuation Hinges on US Jobs Data

Gold prices (XAU/USD) staged a remarkable rally this past week, breaking past key technical thresholds to reach their highest point since December 2023. By Friday’s close, the precious metal had notched a substantial weekly gain of 2.33%, settling near $2,082.

Bullion’s bullish momentum can be attributed in part to a moderate pullback in U.S. Treasury yields, a reaction triggered by two significant economic reports that left investors pondering their implications for the Federal Reserve’s monetary policy stance.

To start, January’s core PCE deflator came in at 0.4% m/m and 2.8% y/y, meeting consensus estimates. Wall Street, rattled by recent CPI and PPI data, had been bracing for another upside inflation surprise, but was relieved when the FOMC‘s preferred price gauge landed precisely on its expected mark.

Eager to gain insights into gold’s future path? Discover the answers in our complimentary quarterly trading guide. Request a copy now!

Adding to the narrative, disappointing manufacturing PMI (ISM) figures showed an accelerated contraction last month, reinforcing the retreat in yields. Traders speculated that weak factory sector output may lead the U.S. central bank to start easing its stance earlier than initially envisioned.

Looking ahead, traders should be attentive to the upcoming February U.S. jobs data for insights into the market’s trajectory. A blockbuster report mirroring January’s robust numbers would undermine hopes of an early Fed pivot toward rate cuts, potentially sending gold prices tumbling.

On the other hand, if nonfarm payrolls figures underwhelm projections and hint at mounting economic headwinds, interest rate expectations are likely to recalibrate toward a more dovish outlook, weighing on yields. This scenario is poised to support precious metals.

UPCOMING US JOBS REPORT

image1.png

Wondering how retail positioning can shape gold prices? Our sentiment guide provides the answers you are looking for—don’t miss out, get the guide now!

GOLD PRICE (XAU/USD) TECHNICAL ANALYSIS

Gold surged beyond trendline resistance at $2,035 and breached another key ceiling at $2,065 this past week, edging closer to surpassing late December’s swing high around $2,085. Failure by bears to contain the price at this point might trigger a rally toward the yellow metal’s record in the vicinity of $2,150.

On the flip side, if sellers stage a comeback and spark a bearish reversal, initial support appears at $2,065. Further losses below this level could lead to a retracement towards the 50-day simple moving average at $2,035. If weakness persists, attention will turn to the $2,010/$2,005 range.

GOLD PRICE TECHNICAL CHART

A screenshot of a graph  Description automatically generated


US Dollar Forecast: Markets Eye NFP After Manufacturing Scare

Concerning Forward-Looking Data to Translate into a Lower Start Next Week?

The dollar limped into the end of the trading week after US manufacturing data posted some slightly concerning results, as the overall sector continued to contract for the 16th straight month.

Notable standouts in the report surfaced via sub-indices, ‘employment’, ‘production’ and the forward-looking metric ‘new orders’ as they all declined compared to January. While the surveyed results provide ‘soft data’, it is something the market has viewed as noteworthy – judging by the reaction. The chart below depicts the immediate reaction to the data from the dollar basket’s (DXY) perspective.

US Dollar Benchmark (DXY) 5-Minute Chart

image1.png

Learn how to set up for and prepare for high importance market moving data and events via our downloadable guide below:

Next week’s US services PMI carries greater importance as the services sector makes up the majority of US GDP

The move also had US Treasury yields moving lower, extending the weekly slide. The 2-year treasury yield is known to be sensitive to fluctuation in Fed funds bets, and the recent move lower suggests a renewed focus on inevitable rate cuts which could arrive in June or July this year.

US 2-Year Treasury Yield Daily Chart

image2.png

US Dollar Finds Support, The Fed Continues its Cautious Approach to Rate Cuts

The Fed must be holding back the temptation to say, ‘we told you so’ now that market expectations match those released in the Fed’s December summary of economic projections. Three rate cuts in 2024 is the new expectation, down from six and potentially seven at one stage. As such, the dollar has found its footing in the early weeks of 2024 but has weakened since the February high.

The shorter-term bearish direction appears to have found support at the 200-day simple moving average (SMA) and if not for the weaker manufacturing data, the dollar would have seen reasonable gain.

However, sustained directional moves, outside of yen pairs, have been hard to come by. As we get closer to D-day for the first interest rate cut, markets appear reactive to the incoming data but often lack the necessary follow through to prolong the move. Such market conditions are typically conducive to range trading strategies and setups.

ISM services PMI data next week is forecast slightly lower than in January, meaning a small deviation from expectations or a move higher, may be enough to see the dollar edge higher again. The zone of resistance comprises of the 104.70 level and the 61.8% Fibonacci retracement of the 2023 major decline. This presents the next challenge for USD bulls. Downside levels to watch include the dynamic support provided by the 200 SMA followed by 103.00.

US Dollar Basket (DXY) Daily Chart

image3.png

If you’re puzzled by trading losses, why not take a step in the right direction? Download our guide, “Traits of Successful Traders,” and gain valuable insights to steer clear of common pitfalls:

Markets now envision a little over 75 basis points worth of cuts (82) this year, with the March meeting highly unlikely to provide the date of the very first cut.

Implied Rate Cuts Derived from the Fed Funds Futures Market

image4.png

US Dollar Event Risk for the Week Ahead: Services PMI, NFP

In the week to come, ISM services PMI data will attract an even greater focus after Friday’s manufacturing print weakened further into contractionary territory, with ‘new orders’ and ‘employment’ sub-indices declining. However, the manufacturing sector makes up roughly 10% of the economy so a strong services print is likely to allay any concerns from Friday.

Then, the ECB is scheduled to kick off the major central bank meetings for March which is likely to filter into the dollar index via its substantial weighting in the EUR/USD pair.

image5.png

Markets Week Ahead: Gold Breaks Out as EUR/USD Eyes ECB; Powell, BoC & NFP Loom

Tuesday: Eyes on U.S. Services Activity

The U.S. ISM Services PMI for February will offer an early glimpse into the health of the dominant services sector. While a modest decline to 53.0 is projected, any significant deviation from this estimate in the final result could spark large price swings in the U.S. dollar by shifting FOMC interest rate expectations.

image1.png

Gain access to an extensive analysis of gold‘s fundamental and technical outlook. Download our quarterly forecast now!

Bank of Canada (BoC): No change in interest rates is anticipated, with traders largely prepared for another dovish hold. The bank’s tone and guidance on future rate policy should be closely watched for clues as to when the easing cycle might begin. Surprises here could create waves for the Canadian dollar.

Fed Focus: Fed Chair Powell delivers the Semiannual Monetary Policy Report to Congress and later testifies before the House Financial Services Committee. This offers an opportunity for Powell to give further insight into policymakers’ current thinking, particularly the timing of future rate cuts.

image2.png

Want to know where the euro may be headed? Explore all the insights available in our quarterly outlook. Request your complimentary guide today!

ECB Decision: While no rate changes are anticipated from the ECB, recent weak European data could lead the institution to adopt a more dovish tone. Any signals that policymakers are starting to contemplate rate cuts in the near future should exert downward pressure on the euro.

Powell’s Testimony Redux: Powell is scheduled to present his Semiannual Monetary Policy Report to U.S. legislators, but this time, he’ll address the Senate Banking Committee. However, with his Wednesday testimony still fresh in memory, this event shouldn’t bring groundbreaking revelations.

image3.png

Curious about what lies ahead for the U.S. dollar? Explore all the insights in our quarterly forecast!

The week culminates with the February U.S. nonfarm payrolls report. Consensus forecasts point to 200K jobs added, but remember, employment data has a history of delivering upside surprises recently.

A significantly stronger-than-expected report could signal continued labor market strength, potentially delaying the Fed’s rate-cutting cycle. This would be bullish for the U.S. dollar, but bearish for gold and risk assets.

Conversely, weak job growth could fuel expectations of a more dovish Fed, sending interest rate expectations lower. In this scenario, gold could rise as the U.S. dollar slides.

For a comprehensive overview of the factors that could impact financial markets and contribute to volatility in the upcoming trading sessions, peruse the thoughtfully curated selection of key forecasts by the DailyFX team.

image4.png

Seeking actionable trading ideas? Download our comprehensive trading opportunities guide, filled with insightful strategies tailored for the first quarter!

Nigeria Lucky Ticket Draw with monthly prizes launched

Dear Client.

We are happy to announce the start of a new competition, Lucky Ticket Draw, for traders from Nigeria.

The competition runs from 1 March to 3 June 2024. Five money prizes will be raffled on the first work day every contest month:

  • $500 will be raffled at 12:00, 13:00, 14:00, and 15:00;
  • $1,000 will be raffled at 16:00.

*Lagos time, GMT +1.

How to participate in the competition:

  • Deposit at least $300 in one payment and activate the LUCKYNG promo code.
  • Receive a unique Lucky Ticket for each deposit of $300 or more.
  • Get a 40% deposit bonus and trade actively in your LiteFinance trading account.
  • Take part in the online prize draw automatically!

Upon activating the promo code, you will be emailed a unique Lucky ticket number. Five winners will be determined randomly using a transparent algorithm:

The last digits in EURUSD, GBPUSD, and USDJPY quotes will form lucky winning numbers at the time specified in the schedule. A participant whose lucky ticket fully coincides with a lucky number will be recognized as a winner and claim one of the five money prizes.

The number of tickets is not limited. The more lucky tickets you have, the more winning chances!

Best regards,

The team at LiteFinance

Nigeria Lucky Ticket Draw with monthly prizes launched