Gold Price Forecast – Gold Markets Continue to Rally

Gold Price Forecast – Gold Markets Continue to Rally

Gold Market Technical Analysis

Gold markets have rallied significantly during the course of the trading session on Monday, as it looks like we are trying to threaten the recent highs. If we can break above the recent peak in pricing, then the market could go on to threaten the $2100 level above. If we can break above there, then the market is likely to continue to go much higher.

Trading Derivatives carries a high level of risk to your capital and you should only trade with money you can afford to lose. Trading Derivatives may not be suitable for all investors, so please ensure that you fully understand the risks involved, and seek independent advice if necessary. A Product Disclosure Statement (PDS) can be obtained either from this website or on request from our offices and should be considered before entering into a transaction with us. Raw Spread accounts offer spreads from 0.0 pips with a commission charge of USD $3.50 per 100k traded. Standard account offer spreads from 1 pips with no additional commission charges. Spreads on CFD indices start at 0.4 points. The information on this site is not directed at residents in any country or jurisdiction where such distribution or use would be contrary to local law or regulation.

Underneath, the $2000 level will continue to attract a certain amount of attention, as it is a large, round, psychologically significant figure. If we break down below there, and we have a couple of times, market is likely to find plenty of support near the 50-Day EMA. All things being equal, I do think that gold looks very strong, as we had recently pulled back to the 50-Day EMA and the 38.2% Fibonacci were to level, both indicators that a lot of people will pay attention to.

Pay close attention to the interest rate situation in the United States, because quite frankly as the rates fall, that should continue to help the gold market. On the other hand, if we do see interest rates rise again, that could work against the value of gold. When I look at this chart, it would not take a lot of imagination to see some type of pullback come back into the picture. In general, this is a market that I think continues to try to find value, so those pullbacks will be attractive.

You can also keep an eye on the US dollar, because it has an inverse correlation most of the time, but not always against the gold market. Gold is also being used to preserve wealth in a very uncertain financial situation at the moment, so therefore I see plenty of reasons for it to be attractive. However, this does not mean that you need to chase the trade and start buying all the way up here, at least not until it shows that it can break through the significant resistance barrier that we are now facing. In general, I believe that in this market, it’s more of a “buy on the dips” type of scenario going forward.

Natural Gas and Oil Analysis: Market Trends Amidst OPEC+ Deliberations and Technical Indicators

Natural Gas and Oil Analysis: Market Trends Amidst OPEC+ Deliberations and Technical Indicators

Quick Fundamental Outlook

Oil prices experienced a decline on Monday, with Brent crude approaching $80 per barrel. This trend occurred as the market anticipated the upcoming OPEC+ meeting, where an agreement to limit supplies into 2024 is expected.

Trading Derivatives carries a high level of risk to your capital and you should only trade with money you can afford to lose. Trading Derivatives may not be suitable for all investors, so please ensure that you fully understand the risks involved, and seek independent advice if necessary. A Product Disclosure Statement (PDS) can be obtained either from this website or on request from our offices and should be considered before entering into a transaction with us. Raw Spread accounts offer spreads from 0.0 pips with a commission charge of USD $3.50 per 100k traded. Standard account offer spreads from 1 pips with no additional commission charges. Spreads on CFD indices start at 0.4 points. The information on this site is not directed at residents in any country or jurisdiction where such distribution or use would be contrary to local law or regulation.

Brent crude futures dropped by 0.5% to $80.16 a barrel, and U.S. West Texas Intermediate (WTI) crude futures decreased by 0.7% to $75.05 a barrel. Despite this decrease, both contracts had registered a slight increase last week, driven by expectations that Saudi Arabia and Russia might extend their supply cuts into early 2024.

The OPEC+ group, after initial delays in reaching consensus on production targets, appears to be moving towards a compromise. This development in oil prices could impact U.S. oil and natural gas markets, potentially influencing energy costs and investment decisions in these sectors.

Natural Gas Price Forecast

Natural Gas (NG) Chart
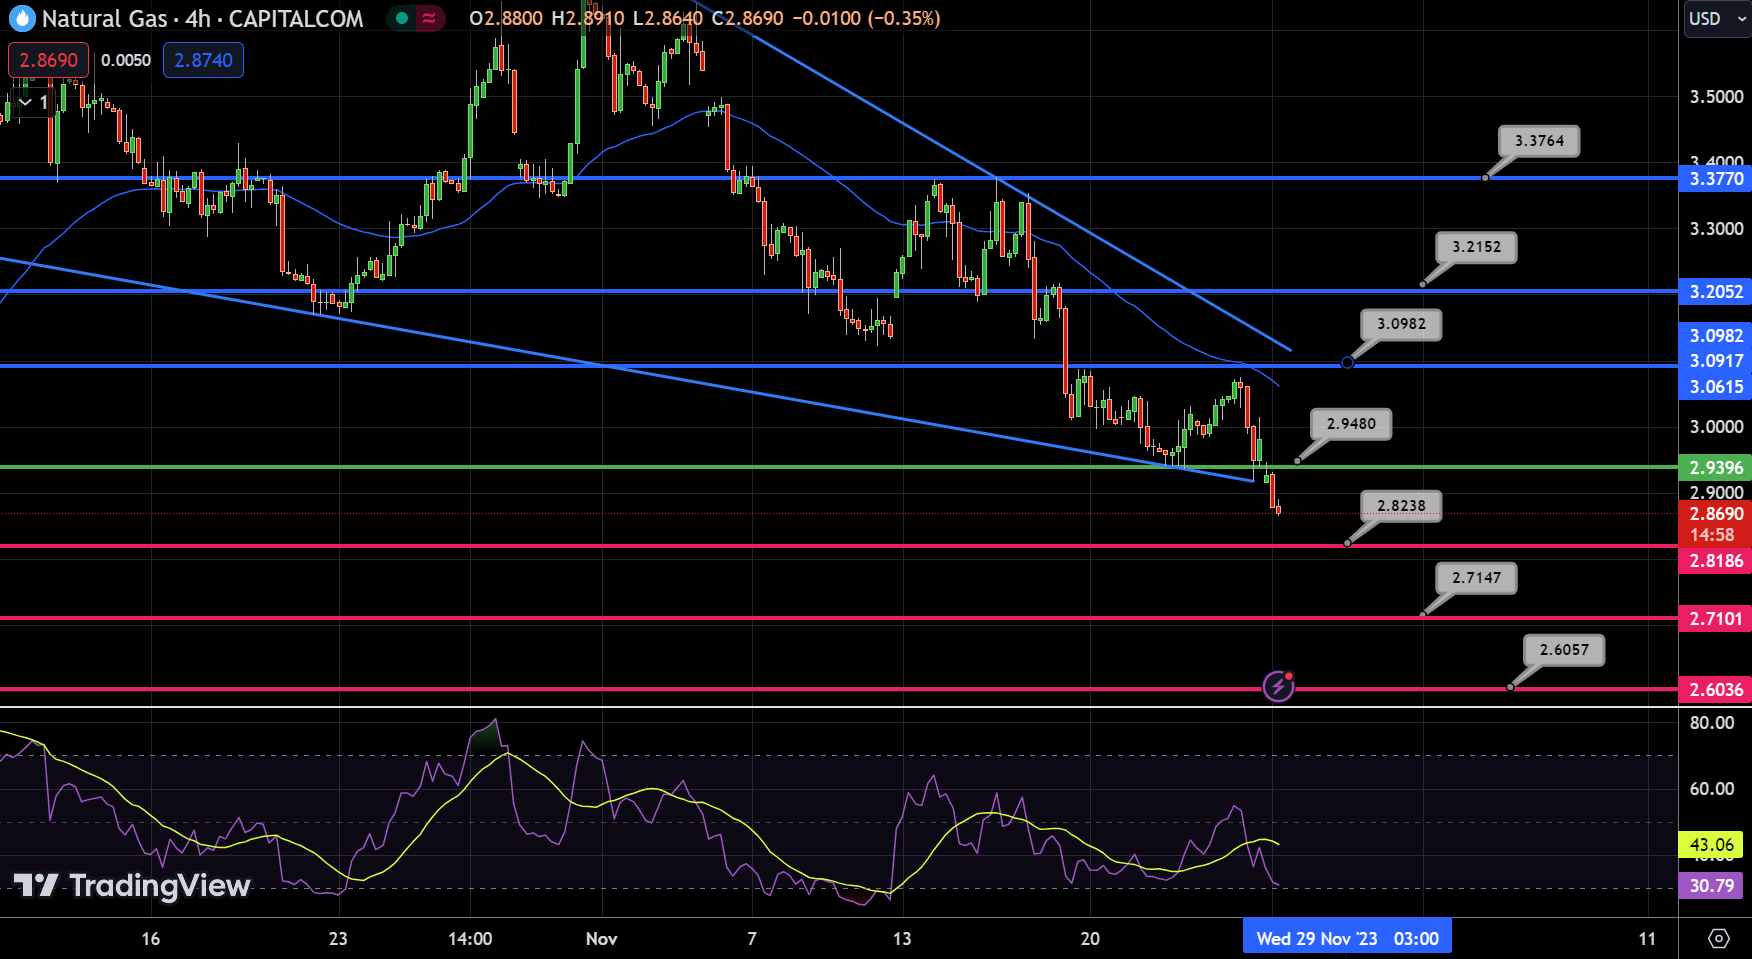
Natural Gas (NG) ChartAs of November 27, Natural Gas (NG) is experiencing a notable downtrend in the market, with its price falling to $2.86, a decrease of 3.82%. This movement positions NG below the key pivot point of $2.94, which is essential for interpreting future market movements.

Resistance levels are set at $3.09, $3.21, and $3.37, each posing a challenge for any bullish reversal. Support levels are found at $2.82, $2.71, and $2.60, critical for halting further declines.

The technical indicators reveal a bearish market sentiment. The Relative Strength Index (RSI) is at 30, hovering near the oversold threshold, indicating that the market could be due for a rebound or stabilization.

The Moving Average Convergence Divergence (MACD) shows a value of -0.010, which is below the signal line at -0.030, suggesting the prevailing downward momentum.

Furthermore, the price of Natural Gas is currently below the 50-Day Exponential Moving Average (EMA) of $2.94, reinforcing the bearish outlook. Chart analysis shows a downward trendline breakout at $2.95, indicating potential bearish momentum unless the price can surpass this level.

In summary, the overall trend for Natural Gas is bearish below the $2.95 mark. The short-term expectation is that NG will test the immediate resistance levels, especially at $3.09.

WTI Oil Price Forecast

WTI Crude Oil (WTI) Chart
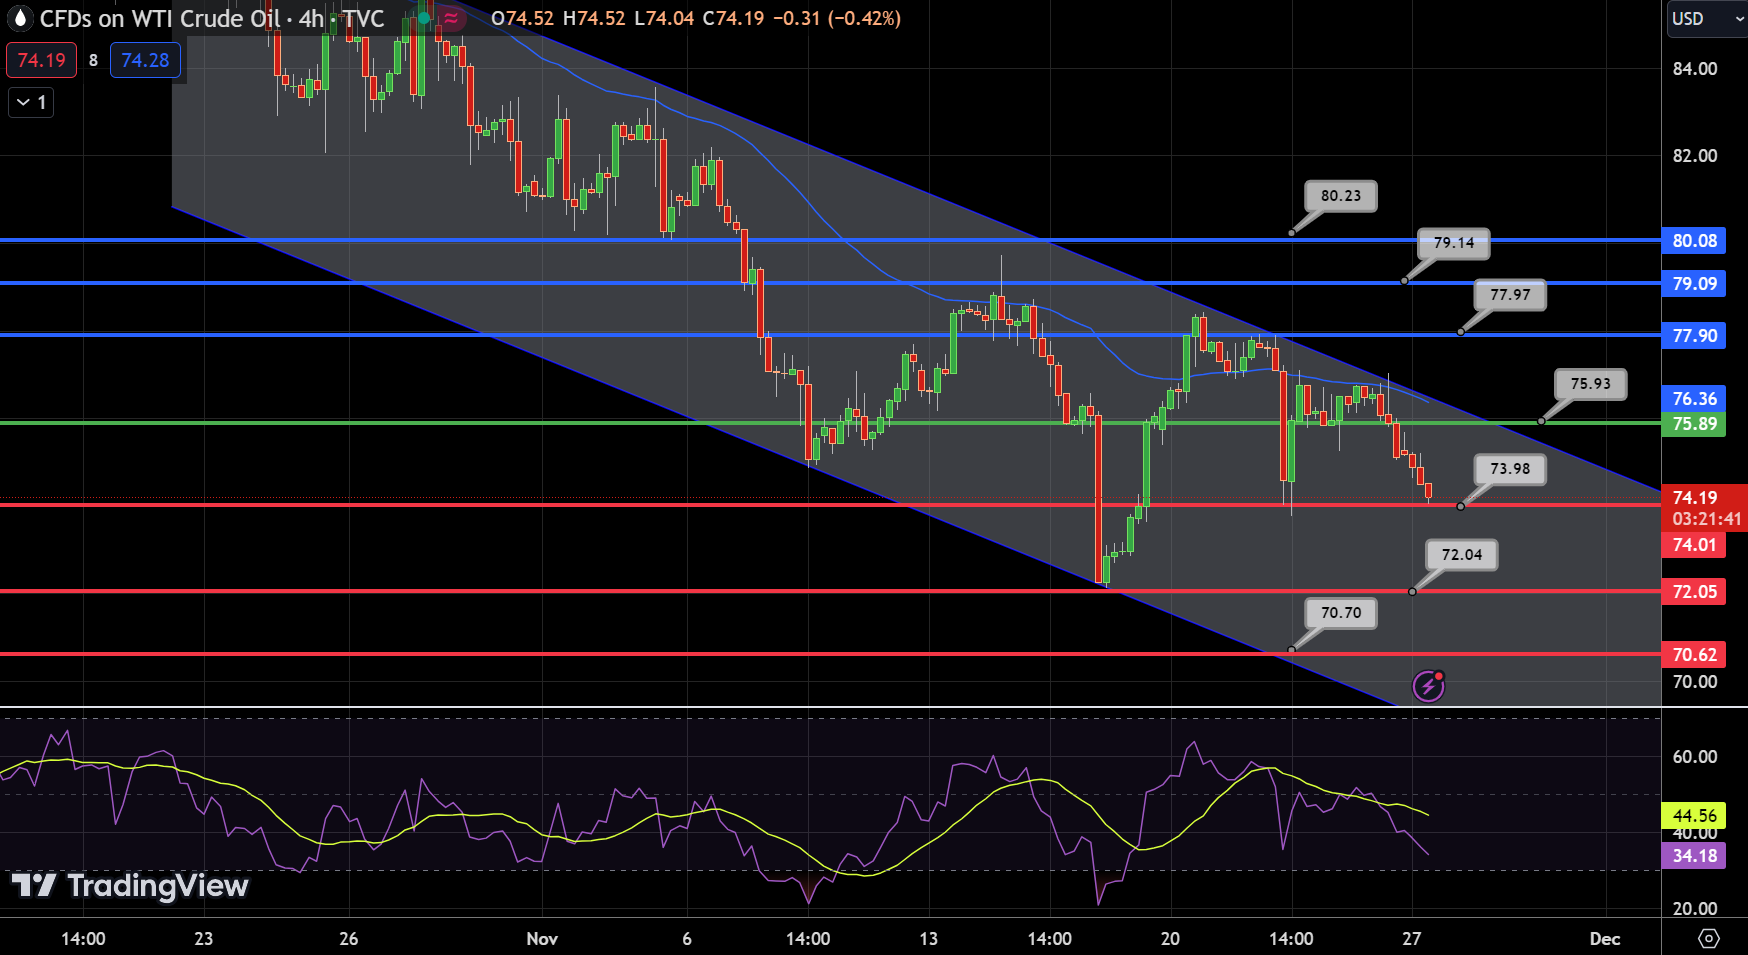
WTI Crude Oil (WTI) ChartAs of November 27, US Oil exhibits a downturn in its market performance, currently trading at $74.19, down by 1.42%. This decline positions the commodity below the pivot point of $75.93, a critical juncture for future price actions.

Technical resistances lie at $77.97, $79.14, and $80.23, challenging any upward momentum. Conversely, support levels are marked at $73.98, $72.04, and $70.70, providing potential floors for further drops.

The Relative Strength Index (RSI) is at 34, suggesting a bearish market trend without hitting the oversold territory. The Moving Average Convergence Divergence (MACD) presents a negative value of -0.230, diverging from its signal line at -0.500, indicating a downward momentum.

This is corroborated by the asset trading below the 50-Day Exponential Moving Average (EMA) of $75.17, further reinforcing the short-term bearish outlook.
Chart patterns reveal a downward trendline, suggesting a continuation of the bearish trend unless a significant reversal occurs. The overall sentiment for US Oil remains bearish below the crucial level of $75.95.

In summary, the short-term forecast for US Oil anticipates testing lower support levels, particularly at $73.98. The market appears to be in a cautious state, with potential for further declines unless a significant bullish stimulus emerges.

Brent Oil Price Forecast

Brent Oil Chart
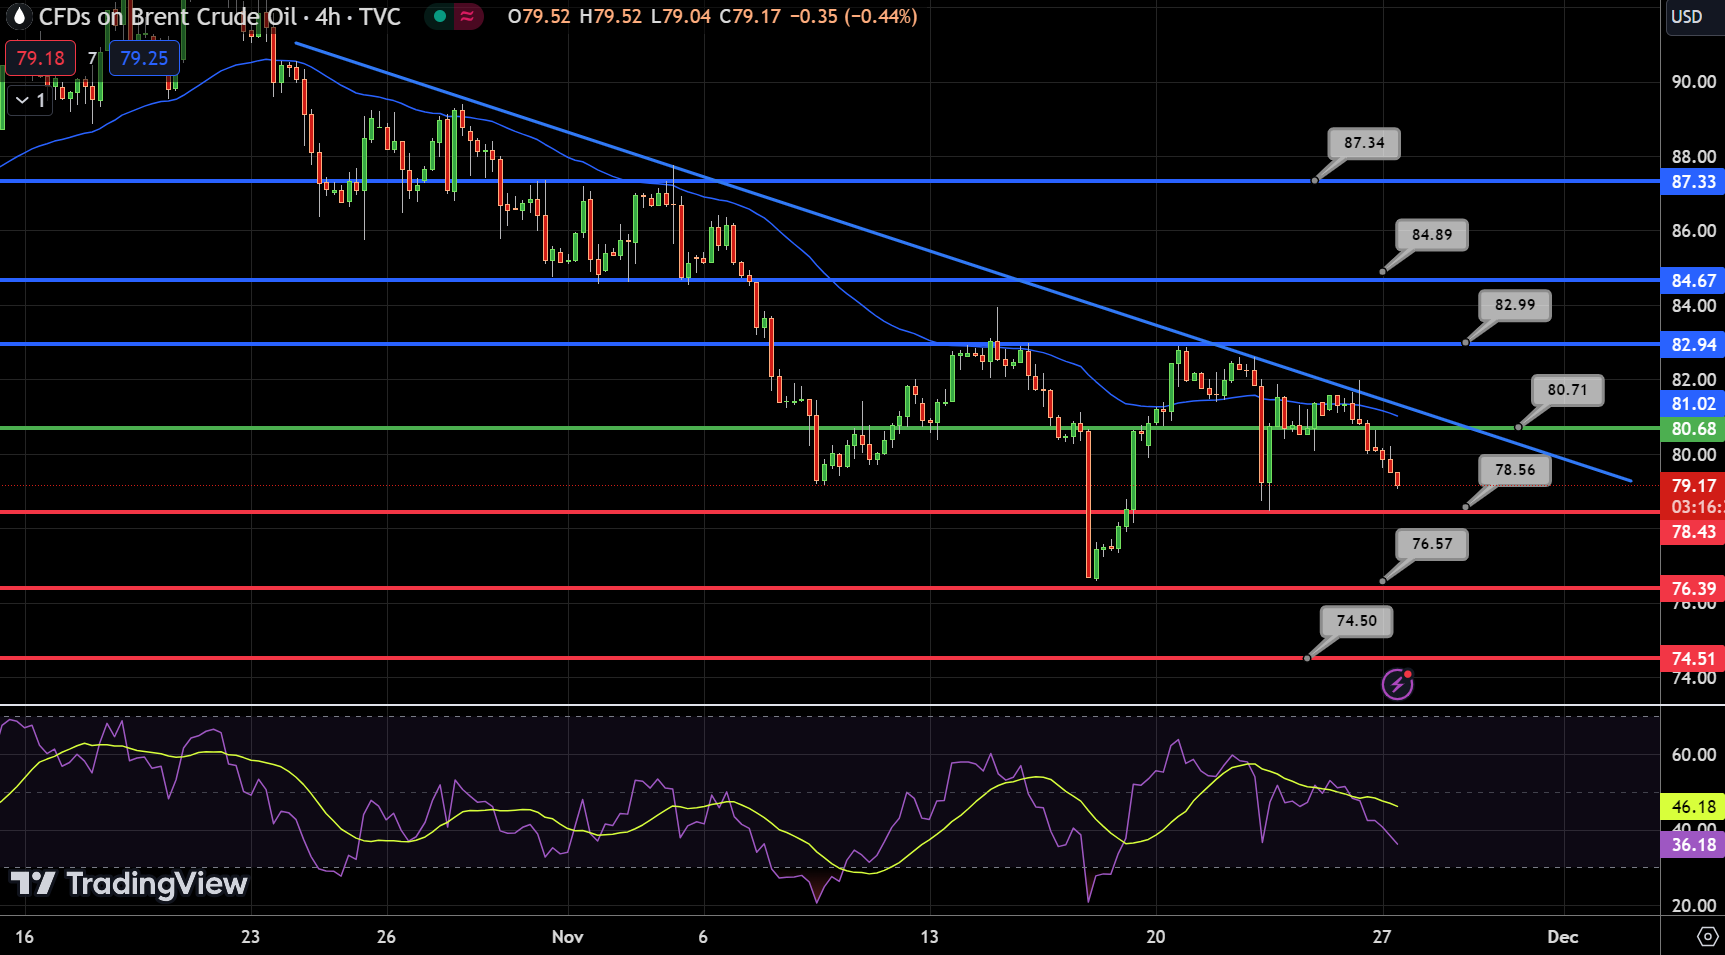
Brent Oil ChartUK Oil, as of November 27, is witnessing a downturn in the market, trading at $79.17, marking a 1.3% decrease. This current positioning places the commodity below the critical pivot point of $80.71, which is significant for future price dynamics.

The immediate resistance levels are identified at $82.99, $84.89, and $87.34, presenting substantial hurdles to any upward price movement. On the flip side, support levels are observed at $78.56, $76.57, and $74.50, crucial for halting any further declines in price.

The Relative Strength Index (RSI) stands at 36, indicating a bearish market sentiment without yet reaching oversold conditions. The Moving Average Convergence Divergence (MACD) shows a negative trend with a value of -0.22, suggesting a bearish momentum as it remains below the signal line of -0.39. Additionally, the current price is below the 50-Day Exponential Moving Average (EMA) of $80.09, reinforcing the bearish trend.

Chart analysis reveals a downward trendline extending resistance at $80.70, implying a sustained bearish outlook unless the price can breach this resistance.
In conclusion, the overall trend for UK Oil is bearish below the $80.70 level. The short-term forecast anticipates a test of the immediate resistance levels, particularly at $82.99.

Gold Prices Forecast: XAU/USD at 6-Month High Amid Weakening Dollar, Fed Speculation

Gold Prices Forecast: XAU/USD at 6-Month High Amid Weakening Dollar, Fed Speculation

Gold Prices Reach Six-Month High

Gold (XAU/USD) prices reached a six-month peak on Monday, driven by a weakening U.S. dollar and expectations that the Federal Reserve might halt its interest rate hikes. Spot gold increased by 0.4% to $2,010.87 per ounce, its highest since mid-May, while U.S. gold futures mirrored this rise.

Influence of U.S. Dollar and Economic Indicators

The softening U.S. dollar, influenced by recent economic data, has been a key factor propelling gold’s ascent. This week’s U.S. economic releases, particularly regarding growth and inflation, could further impact gold’s stability above the $2,000 mark. Additionally, the dollar index, slightly recovering but poised for a significant monthly loss, influences gold’s pricing for international buyers.

Trading Derivatives carries a high level of risk to your capital and you should only trade with money you can afford to lose. Trading Derivatives may not be suitable for all investors, so please ensure that you fully understand the risks involved, and seek independent advice if necessary. A Product Disclosure Statement (PDS) can be obtained either from this website or on request from our offices and should be considered before entering into a transaction with us. Raw Spread accounts offer spreads from 0.0 pips with a commission charge of USD $3.50 per 100k traded. Standard account offer spreads from 1 pips with no additional commission charges. Spreads on CFD indices start at 0.4 points. The information on this site is not directed at residents in any country or jurisdiction where such distribution or use would be contrary to local law or regulation.

Global Economic Events and Inflation Outlook

Global economic events, including the postponed OPEC+ meeting, inflation data from the euro zone and Australia, and policy decisions from the Reserve Bank of New Zealand and China’s PMI data, are poised to shape market sentiment. Investors are closely watching U.S. core PCE prices, the Federal Reserve’s preferred inflation metric, for hints on future policy direction.

Market Anticipation and Interest Rate Dynamics

Despite no immediate signs of rate cuts from the Federal Reserve, market pricing suggests a growing anticipation of policy easing in the near future. The possibility of a Fed rate reduction as early as next March currently stands at around 23%. Meanwhile, U.S. Treasury yields saw an uptick, and the upcoming U.S. GDP figures and PCE price index will be closely scrutinized for further indications of the economic trajectory.

Outlook for December and Beyond

The market largely expects the Fed to maintain current interest rates in December, with increasing speculation about a potential rate cut by May next year. This environment, where lower interest rates reduce the opportunity cost of holding gold, might continue to bolster gold prices in the short term.

Technical Analysis

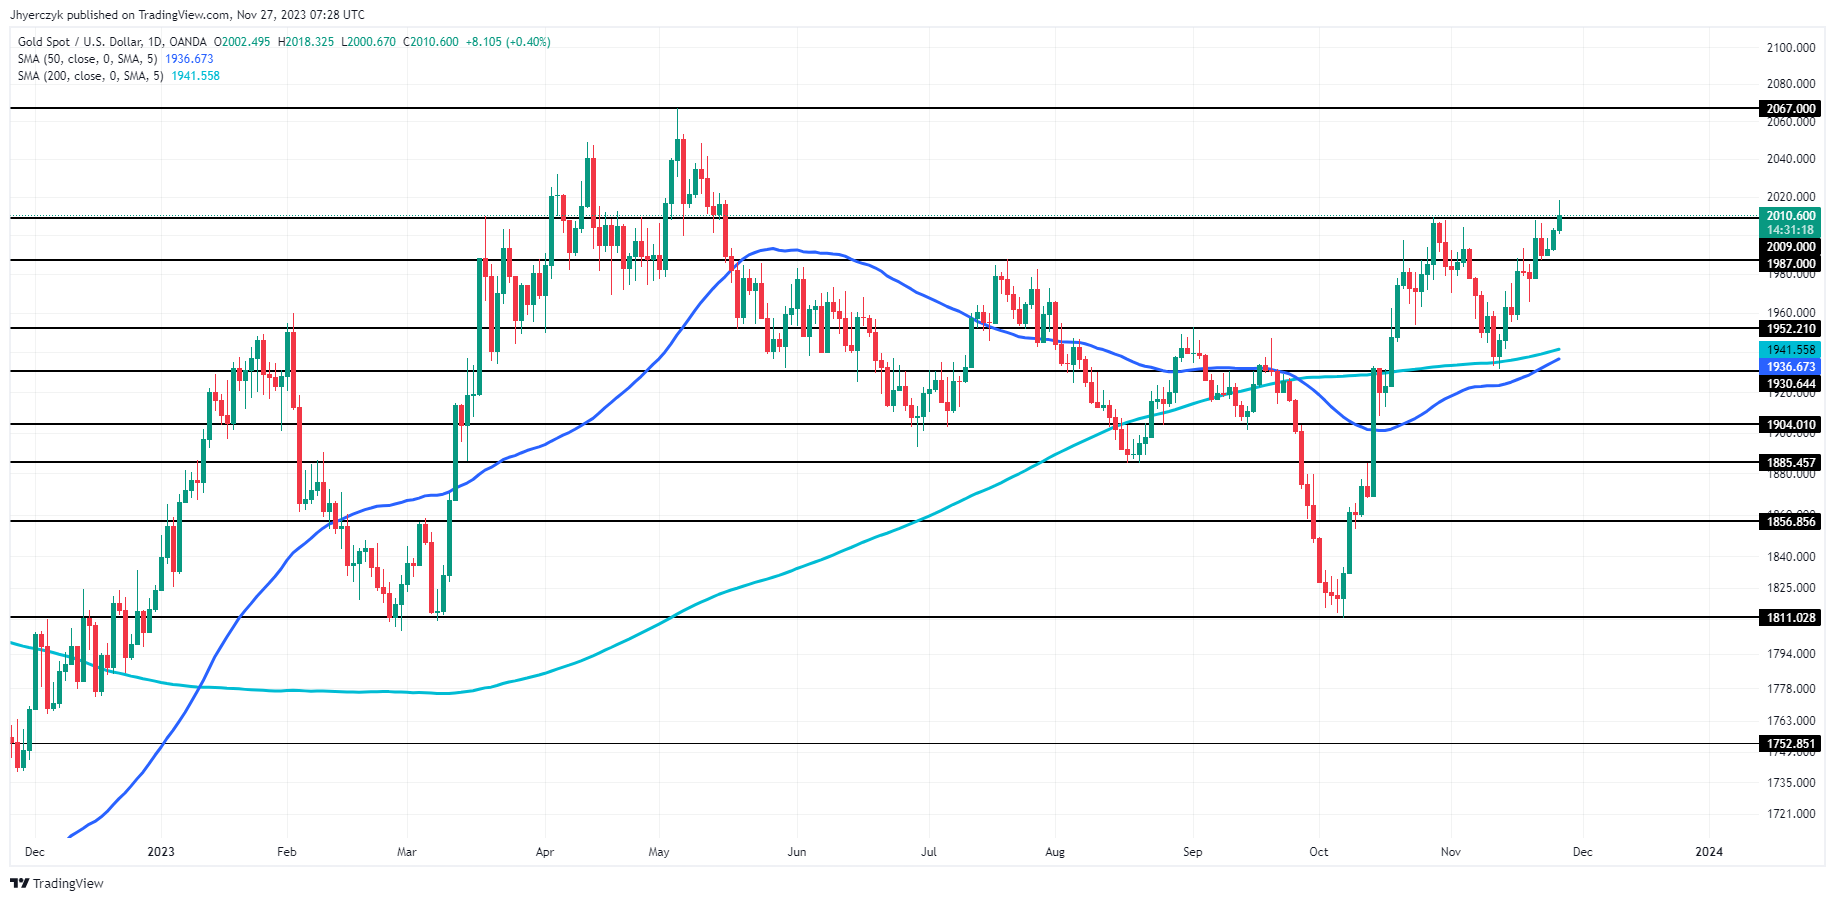
Daily Gold (XAU/USD)Gold (XAU/USD), trading at $2010.75, is currently above both the 200-day and 50-day moving averages of $1941.56 and $1936.68 respectively, signaling a bullish trend.

The asset’s price is hovering just above the minor support level of $2009.00, which, if sustained, could indicate continued bullish momentum. However, approaching the minor resistance at $2067.00, gold faces a crucial test. If it breaks through this resistance, it could signal further upside potential.

The current market positioning, above key moving averages and near minor support, suggests a positive sentiment among investors, leaning towards a bullish outlook for gold in the short term.

Shiba Inu (SHIB) Price Maintains Upward Momentum —But Who’s Buying?

Shiba Inu (SHIB) Price Maintains Upward Momentum —But Who’s Buying?

Shiba Inu Price Insights:

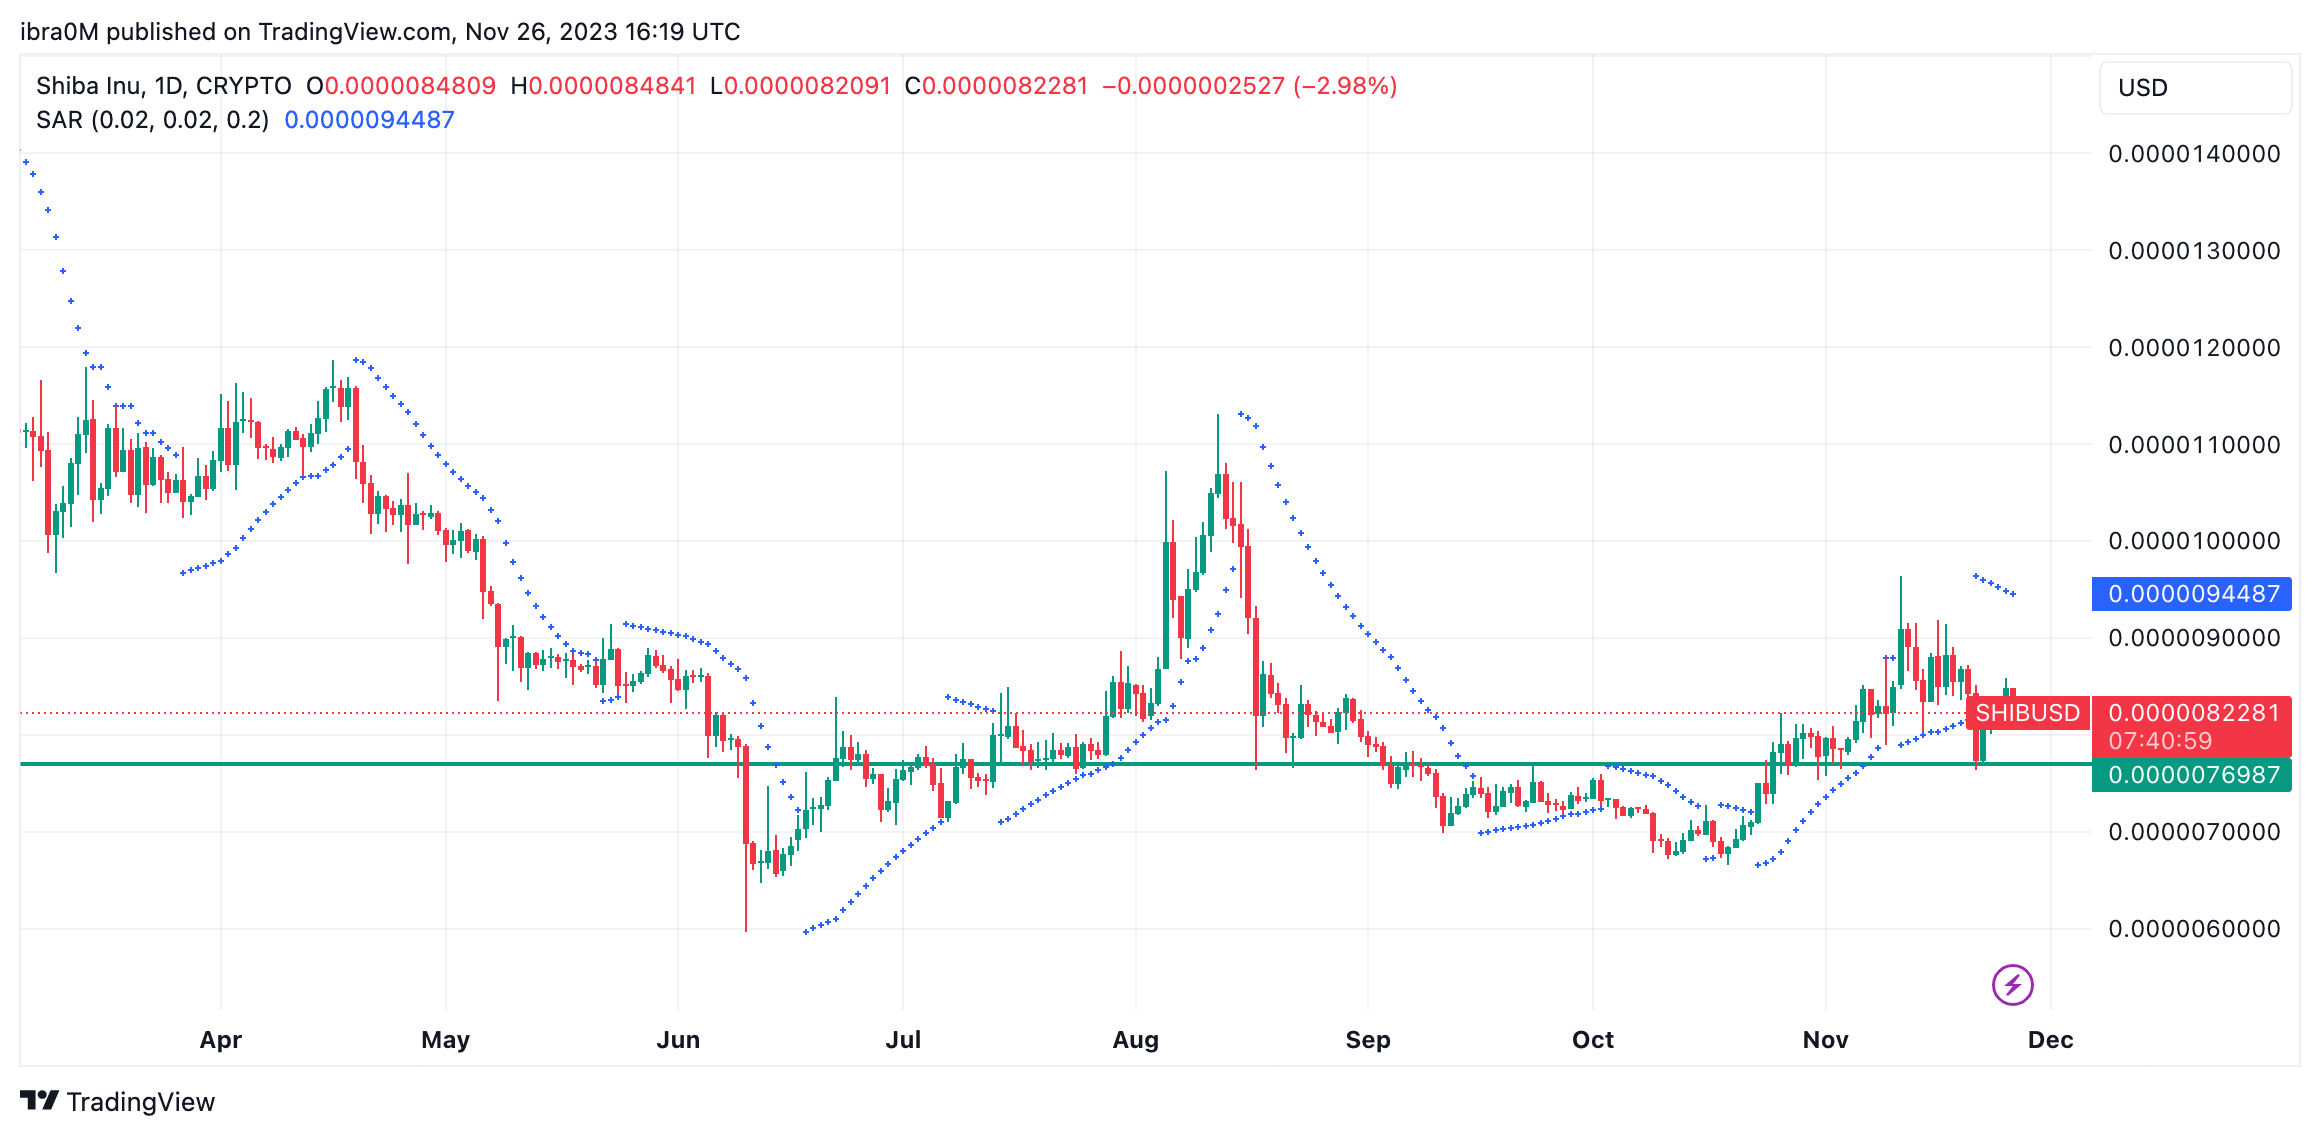
  • Shiba Inu (SHIB) price has increased from $0.0000076 to $0.0000086 between November 1 and November 26, bringing its monthly gains above the 10% mark.
  • While maintaining the upward price trajectory, on-chain data has revealed that Large Investors are growing disinterested in the SHIB token.
  • Critical technical indicators also affirm that the next major SHIB price action in the coming week could be bearish.

Shiba Inu (SHIB) has delivered a fairly positive 10% growth performance in November 2023 so far, despite the intense volatility in the broader crypto markets. However, a critical on-chain metric suggests that the SHIB token is gradually losing traction among crypto whales and corporate investors.

Is it time for strategic bullish traders to exit their SHIB short-term positions?

Trading Derivatives carries a high level of risk to your capital and you should only trade with money you can afford to lose. Trading Derivatives may not be suitable for all investors, so please ensure that you fully understand the risks involved, and seek independent advice if necessary. A Product Disclosure Statement (PDS) can be obtained either from this website or on request from our offices and should be considered before entering into a transaction with us. Raw Spread accounts offer spreads from 0.0 pips with a commission charge of USD $3.50 per 100k traded. Standard account offer spreads from 1 pips with no additional commission charges. Spreads on CFD indices start at 0.4 points. The information on this site is not directed at residents in any country or jurisdiction where such distribution or use would be contrary to local law or regulation.

Crypto Whales are Losing Interest in the SHIB Token

The memecoin sector made a blistering start to November, with the top 3 meme tokens, Dogecoin (DOGE), PEPE, and Shiba Inu (SHIB), all racing to historic price peaks in the second week of the month.

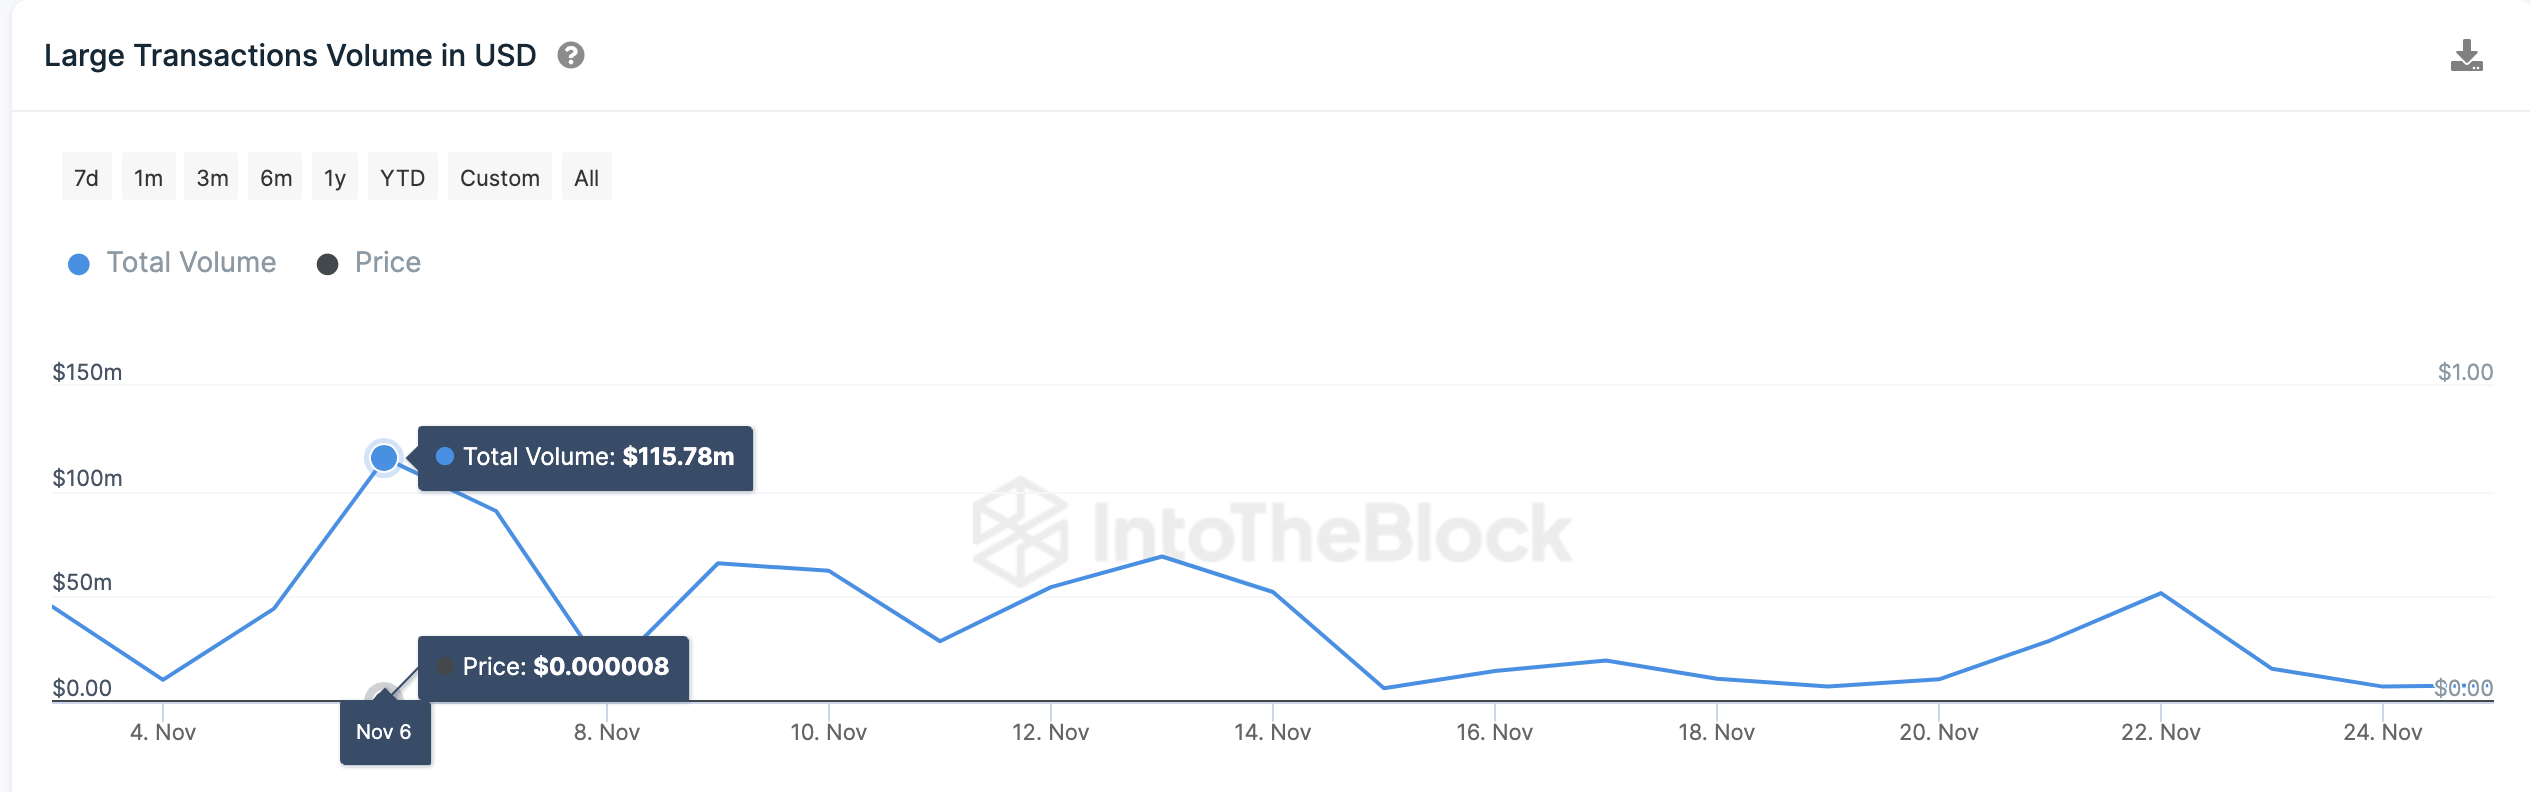
However, on-chain data now shows that since Shiba Inu price reached a 3-month peak of $0.00001 on Nov 11, crypto whales have significantly dialed down their interest. The large transactions data pulled from on-chain data tracker IntoTheBlock clearly depicts the decline in whale demand.

As seen in the chart below, the Shiba Inu network recorded a total of $115.78 million worth of large transactions on Nov 6. And as expected, that whale demand drove SHIB price to a 3-month peak barely a week later.

But worryingly, the volume of SHIB whale transactions has flattened since then. The latest reading at press time shows that the Shiba Inu network recorded just $7.96 million worth of whale transactions on November 25. This is a staggering 93% decline from the monthly peak recorded on Nov 6.

Shiba Inu (SHIB) Large Transactions vs. Price | Source: IntoTheBlock
Shiba Inu (SHIB) Large Transactions vs. Price | Source: IntoTheBlockIn crypto parlance, large transactions, alternatively called whale transactions, are a financial metric that tracks corporate investors and high net-worth investors’ trading activity on a blockchain network. Essentially, it sums up the daily volume of unique transactions that exceed $100,000 in value.

This 93% drop in large transactions over the past two weeks is a significant bearish indicator for a few reasons.

  • Firstly, it shows that whale investors are buying less of the SHIB token, which could spook eagle-eyed retail traders to also take bearish positions.
  • More importantly, without the much-needed liquidity and market depth that these whale transactions provide, Shiba Inu holders could struggle to execute trades at favorable prices in the week ahead.

SHIB Price Forecast: Can the Bears Breakdown the $0.00007 Support?

From an on-chain perspective, there is an indication that crypto whales appear to be shifting focus away from Shiba Inu and the broader mega-cap memecoins.  This could result in a negative SHIB price performance as November draws to a close.

The Parabolic SAR identifies vital reversal points in an ongoing price trend. When it points below an asset’s current price, it signals a short-term bearish sentiment.

Currently, the SHIB Parabolic SAR indicator dots point toward $0.0000095, which is well above the current price of $0.0000082. This alignment is a strong indication of a bearish Shiba Inu price momentum.

However, the SHIB bears must clear the initial support level around $0.000077 to seize control of the market. If they can break down that buy-wall, it could open the door to a larger downswing toward $0.000006.

Shiba Inu (SHIB) Price Forecast   | Source: TradingView
On the flip side, the Dogecoin bears could invalidate that prediction if they successfully force a downswing below $0.07. However, the bulls will likely mount a major buy wall around the Parabolic SAR point at $0.071 price range.If that support territory holds firm, Elon Musk’s “favorite” memecoin will likely avoid a major bearish reversal.

Market Week Ahead: Gold Tests $2k, GBP/USD, EUR/USD Pop, USD Sags

Market Week Ahead: Gold Tests $2k, GBP/USD, EUR/USD Pop, USD Sags

Market Week Ahead: Gold Tests $2k, GBP/USD, EUR/USD Pop, USD Sags

Markets remain risk-on with a range of US equity markets posting fresh multi-month highs. The VIX ‘fear gauge’ is at lows last seen at the start of 2020 and has fallen in excess of 46% from its late-October spike high. The growing feeling that interest rates have peaked around the globe is fueling the feel-good feeling and with rate cuts expected at the end of Q2 2024, the move higher may have more to go in the coming months.

VIX Daily Chart

image1.png

The US dollar remains on the backfoot and is within touching distance of making a fresh multi-month low, despite US Treasury yields edging higher. Next week there is a large sale of 2-, 5-, and 7-year US Treasuries and it seems that the market is pushing for higher yields before the $148 billion of paper hits the street.

image2.png

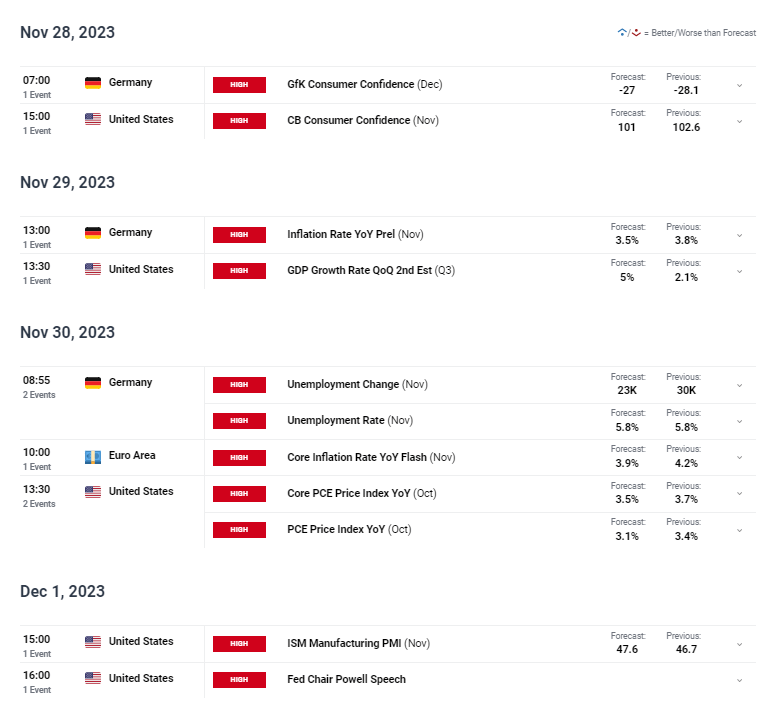
There are a few high-impact economic data releases on the calendar next week with the 2nd look at US GDP and Euro Area and US inflation the standouts. Fed Chair Jerome Powell also speaks at the end of the week.

image3.png

British Pound (GBP) Weekly Forecast: Data and Monetary Policy Align, Doubts Remain

The British Pound is back at highs not seen since early September against the United States Dollar. Indeed, it looks perhaps surprisingly comfortable above $ .1.25 on its twin pillars of monetary support and, as rarely of late, economic data.

Gold (XAU/USD), Silver (XAG/USD) Hold the High Ground as Oil Prices Eye a Recovery

Gold and Silver prices enjoyed a positive week as buyers kept both metals supported with a struggling US Dollar helping as well. Both Gold and Silver threatened a selloff this week, but buyers kept prices steady for the majority of what was a shortened trading week. Looking at Gold though and the failure to find acceptance above the $2000/oz mark could leave the precious metal vulnerable heading into next week.

Euro (EUR) Forecast: EUR/USD and EUR/GBP Week Ahead Outlooks

FX markets have been relatively quiet overall in a holiday-shortened week, with the British Pound the notable exception. The Euro has edged higher against the US dollar, consolidating its recent gains, while the single currency has struggled against the British Pound and is back at lows last seen over two weeks ago.

US Dollar Forecast: Growth and Inflation to Extend the USD Sell-Off?

The dollar has been moving lower, in a similar fashion to US yields and US economic data as the world’s largest economy appears to be feeling the effects of tight financial conditions. Labor data has eased since the October NFP report, retail sales, and CPI data dropped and overall sentiment data has been revised lower too.

USD/JPY Weekly Forecast: BoJ Policy Change Reinforced by Japanese CPI

The Japanese Yen ended the trading week on a muted tone due to the US Thanksgiving Day hangover but Friday held some key information to factor into the Bank of Japan’s (BOJ) analysis. Once again, headline inflation held above 2% whilst beating estimates and remaining above 3%

Trading is all About Confidence – Download our Free Guide to Help You Build your Confidence

US Dollar Forecast: Growth and Inflation to Extend the USD Sell-off?

US Dollar Forecast: Growth and Inflation to Extend the USD Sell-off?

Dollar May Drift Lower Alongside Incoming Economic Data

The dollar has been moving lower, in a similar fashion to US yields and US economic data as the world’s largest economy appears to be feeling the effects of tight financial conditions. Labour data has eased since the October NFP report, retail sales and CPI data dropped and overall sentiment data has been revised lower too.

In the coming week, High impact US data includes the second estimate of Q3 GDP as well as US Personal Consumption Expenditure (PCE) data – the Fed’s preferred measure of inflation.

image1.png

C

The initial estimate for Q3 GDP (annualized) revealed an impressive 4.9%, however, the second estimate will test the remaining resilience of the economy as general activity data has worsened.

One data point closely watched by the Fed is ‘core services excluding housing and energy’, which provides an indication of widespread prices within the services sector where prices have proven to be sticky. The graph below reveals the sideways movement in price pressures which are yet to show a concerted move to the downside. Progress in this measure could contribute towards another leg lower in the dollar as markets look ahead to next year when at least three 25 basis point hikes are priced in.

PCE Services Excluding Energy and Housing

image2.png

Source: Federal Reserve, prepared by Richard Snow

US Treasury Yields Rise Ahead of Sizeable Auction

The US Treasury is scheduled to auction a decent chunk of US debt next week to fund the US government and its operations. Almost in anticipation, the bond market has propped up yields of the 2-year note in the hopes of acquiring the securities at an attractive yield. While yields have come down from the peak above 5%, levels are still attractive considering it is essentially viewed as a ‘risk free’ asset. Elevated yields may actually see the dollar supported until the major event risk enters the fray from Wednesday.

US 2-Year Treasury Yields

image3.png

US Dollar Basket (DXY) Tests Crucial Long-Term Trend Indicator

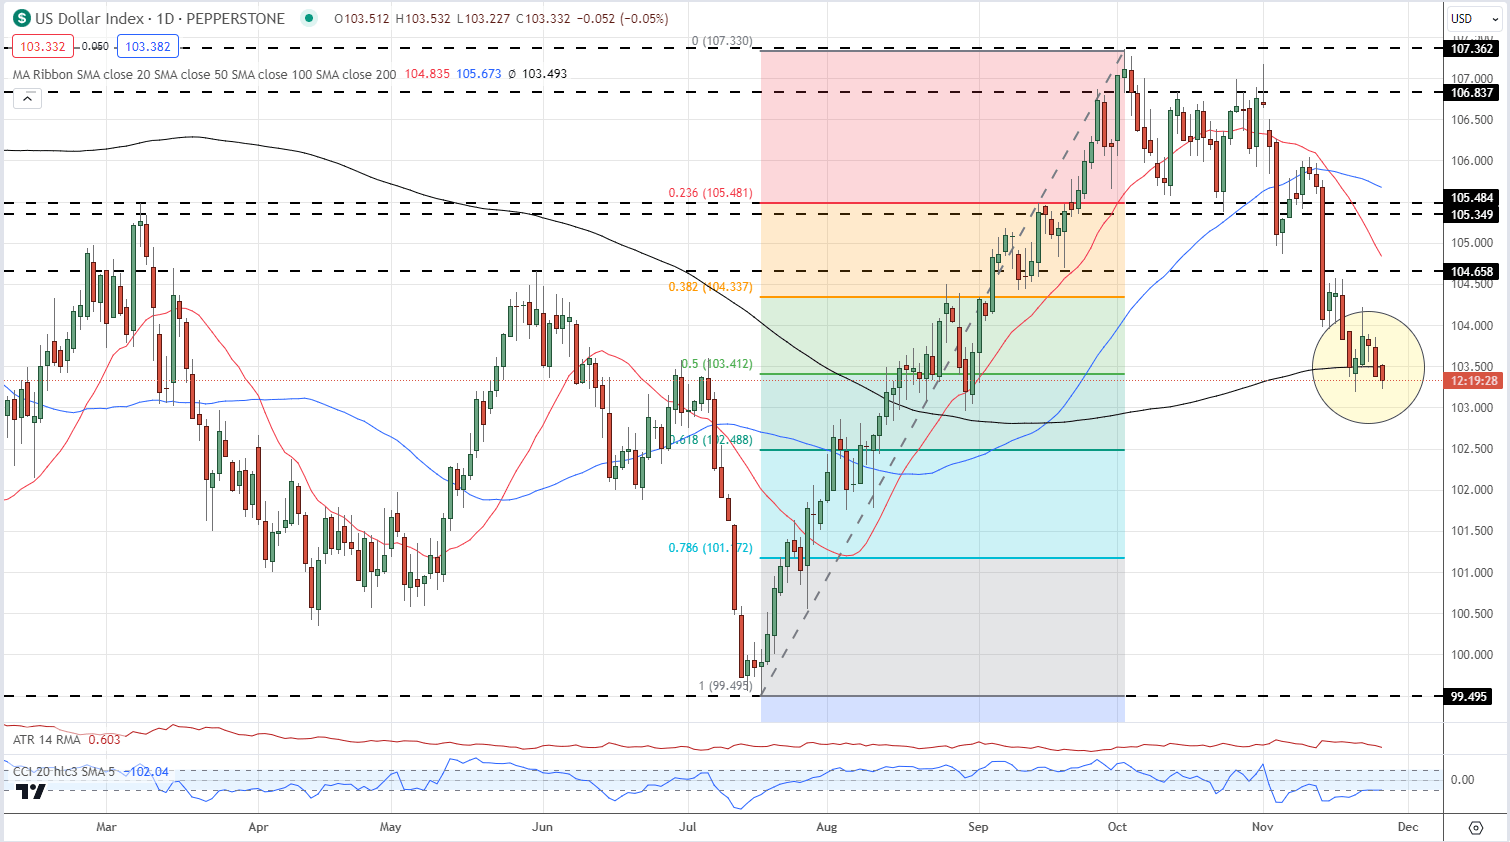
The dollar tested the 200-day simple moving average (SMA) late on Friday after is struggled to build on the bearish momentum after trading below the dynamic level of support previously. A daily close below the 200 SMA could see DXY test 103 flat in the week to come, especially if GDP and inflation data underwhelm. Thereafter, 101.92 comes into view as a level of consideration on the downside. The RSI shows that the bearish move could soon run out of momentum as the indicator approaches oversold territory.

Stronger than anticipated data particularly on the inflation front, could revitalise the dollar and see it recover some of the recent losses. Resistance appears all the way up at 104.70 which poses a tall order.

US Dollar Basket (DXY) Daily Chart

image4.png

Markets have also reigned in reactionary expectations of 100 basis points of cuts next year when CPI came out lower than anticipated for the month of October. Currently, markets expect three full interest rate cuts next year with the possibility of a fourth before December 2024. Any relief from the slight reduction in rate cut expectations may prove to be short lived.

Implied US Interest Rate Probabilities

image5.png

If you’re puzzled by trading losses, why not take a step in the right direction? Download our guide, “Traits of Successful Traders,” and gain valuable insights to steer clear of common pitfalls that can lead to costly errors.

USD/JPY Weekly Forecast: BoJ Policy Change Reinforced by Japanese CPI

USD/JPY Weekly Forecast: BoJ Policy Change Reinforced by Japanese CPI

JAPANESE YEN FUNDAMENTAL BACKDROP

The Japanese Yen ended the trading week on a muted tone due to the US Thanksgiving Day hangover but Friday held some key information to factor into the Bank of Japan’s (BOJ) analysis. Once again, headline inflation held above the 2% whilst beating estimates and remaining above 3%. Remember the BoJ consistently reinforces the fact that they want to see sustained +2% inflation thus increasing the likelihood of a policy shift. A hawkish move will aid the yen and conclude negative interest rates policy.

The Israel-Hamas war needs to be closely monitored as the JPY could find additional support should the situation escalate – safe haven demand. The week ahead (see economic calendar below) will be more focused on US economic data with the core PCE deflator the dominating report as it is the Fed’s preferred measure of inflation. From a Japanese perspective, BoJ officials are scattered throughout alongside retail sales and unemployment data.

USD/JPY ECONOMIC CALENDAR (GMT +02:00)

image1.png

Source: DailyFX economic calendar

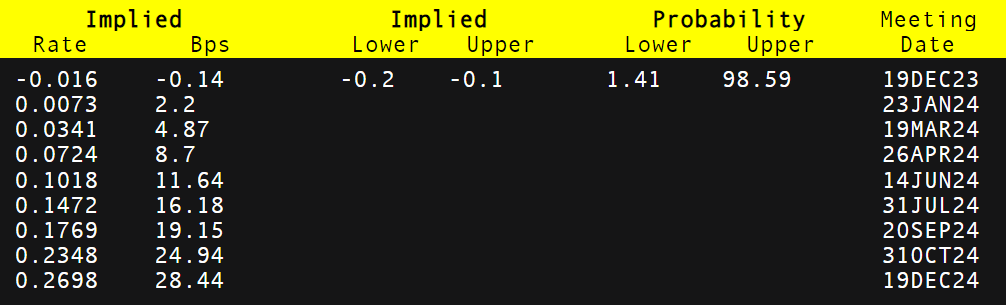
Money market pricing (see table below) forecasts a rate hike towards the latter part of 2024 as but incoming data will remain highly influential and could drastically change expectations as we have seen with many central banks this year.

BANK OF JAPAN INTEREST RATE PROBABILITIES

image2.png

Source: Refinitiv

USD/JPY TECHNICAL ANALYSIS

USD/JPY DAILY CHART

image3.png

Chart prepared by Warren Venketas, IG

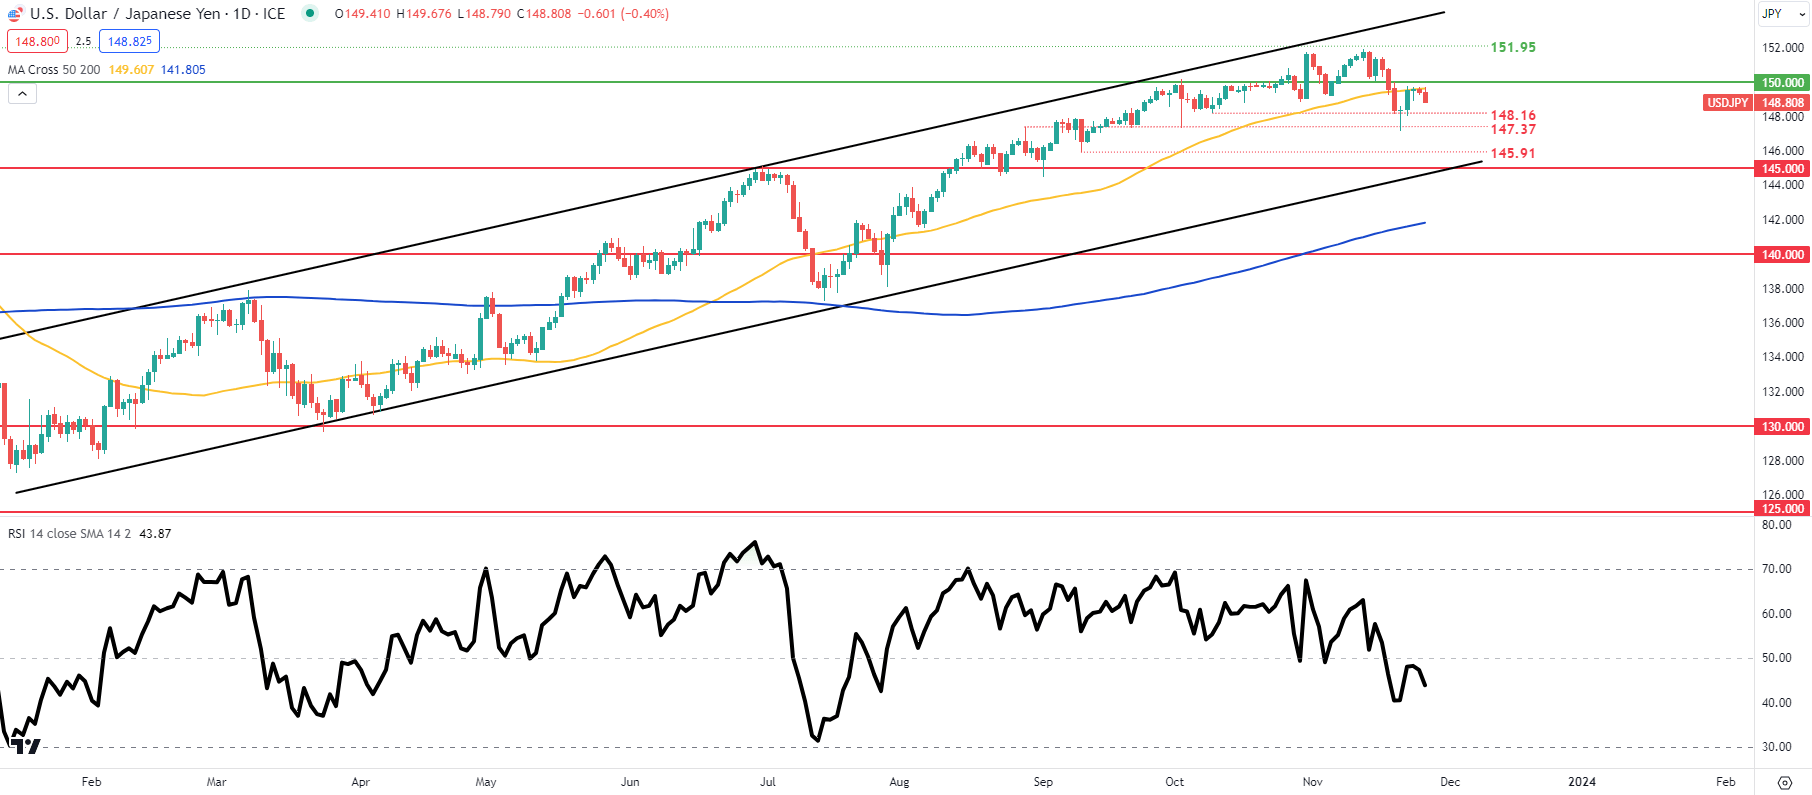
Daily USD/JPY price action has been respectful of the 50-day moving average (yellow) of recent with the Relative Strength Index (RSI) now favoring bearish momentum short-term. That being said, last week’s weekly candle close formed a hammer-like candlestick that could suggest a longer-term bullish preference. The last few daily candles now resemble an ascending triangle type pattern – another bullish advocate.

Key resistance levels:

  • 151.95
  • 150.00

Key support levels:

  • 148.16
  • 50-day moving average (yellow)
  • 147.37
  • 145.91
  • 145.00
Gold (XAU/USD) and Silver (XAG/USD) Continue to Rally as Buyers Take Charge

Gold (XAU/USD) and Silver (XAG/USD) Continue to Rally as Buyers Take Charge

The US dollar is moving back to lows last seen in late August and this is giving the precious metal sector another boost higher. A weaker dollar is seen as a positive for both gold and silver, with demand for the precious metals increasing as gold becomes cheaper in dollar-denominated terms. The US dollar is testing support off its longer-dated simple moving average ( black line) and if this breaks, further losses look likely.

US Dollar Index Daily Chart

image1.png

Retail trader data shows 57.43% of traders are net-long Gold with the ratio of traders long to short at 1.35 to 1.The number of traders net-long is 3.18% higher than yesterday and 1.18% lower than last week, while the number of traders net-short is 5.00% lower than yesterday and 18.10% higher from last week.

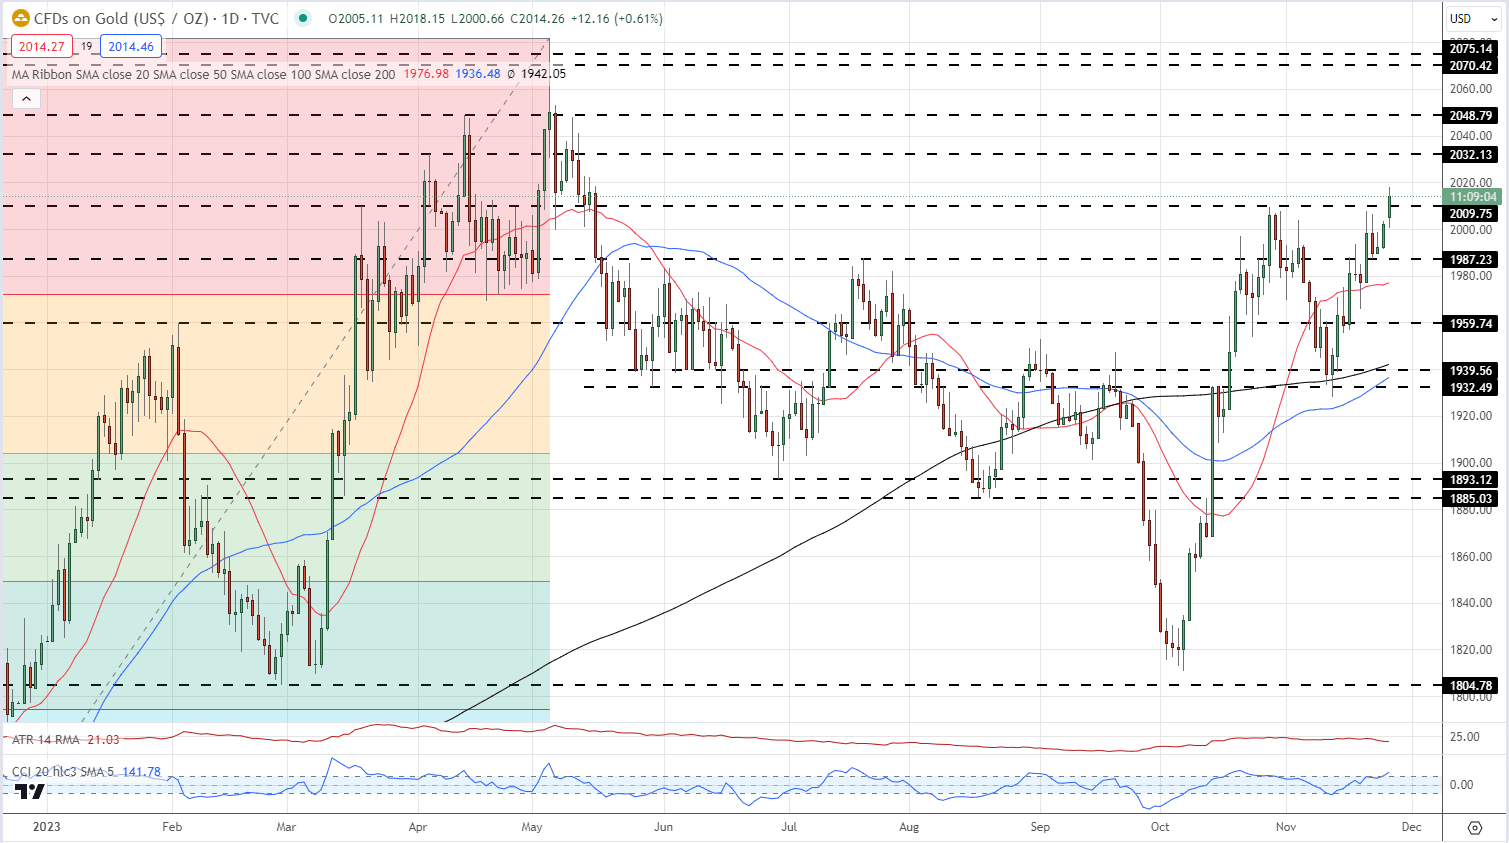
Gold is testing a prior level of resistance at $2,009/oz. and looks set to push higher. A prior level of note at $1,987/oz. is acting as first-line support, with the 20-day simple moving average, currently at $1,976/oz. the next level of interest. A close and open above $2,009/oz. should open the way to $2,032/oz. and $2,049/oz.

Gold Daily Price Chart – November 27, 2023

image2.png

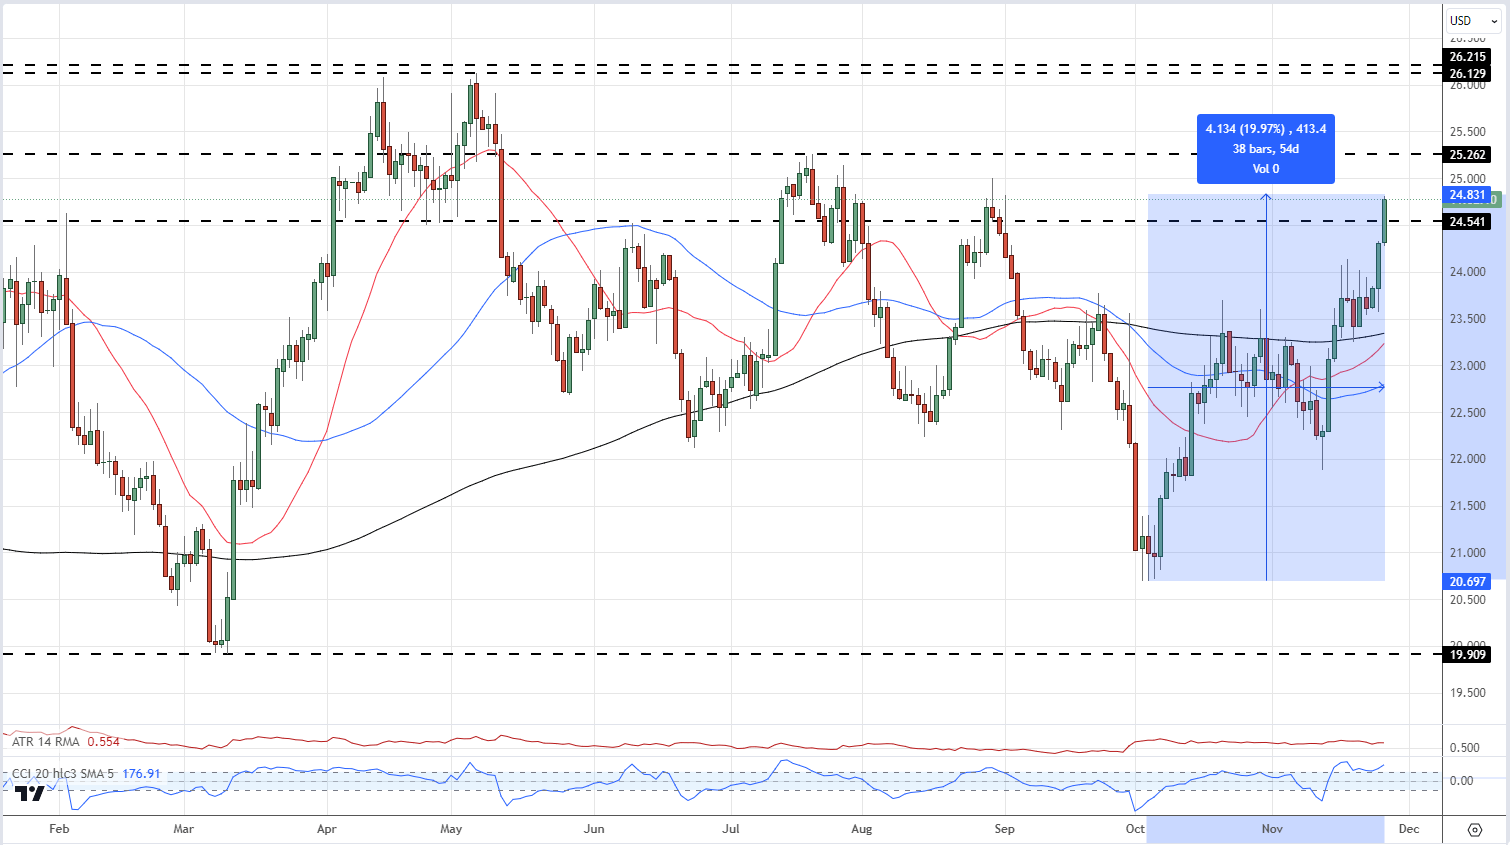
Silver is also moving higher again and is outperforming gold over the last two weeks. Silver has rallied nearly 20% over the last two months and is currently trading at its highest level since late August. The technical setup remains positive and a break above $25.26 will bring $26.13 and $26.21 into play.

Silver Daily Price Chart – November 27, 2023

image3.png

Trading the Gap: What are Gaps & How to Trade Them?

Trading the Gap: What are Gaps & How to Trade Them?

What is a gap?

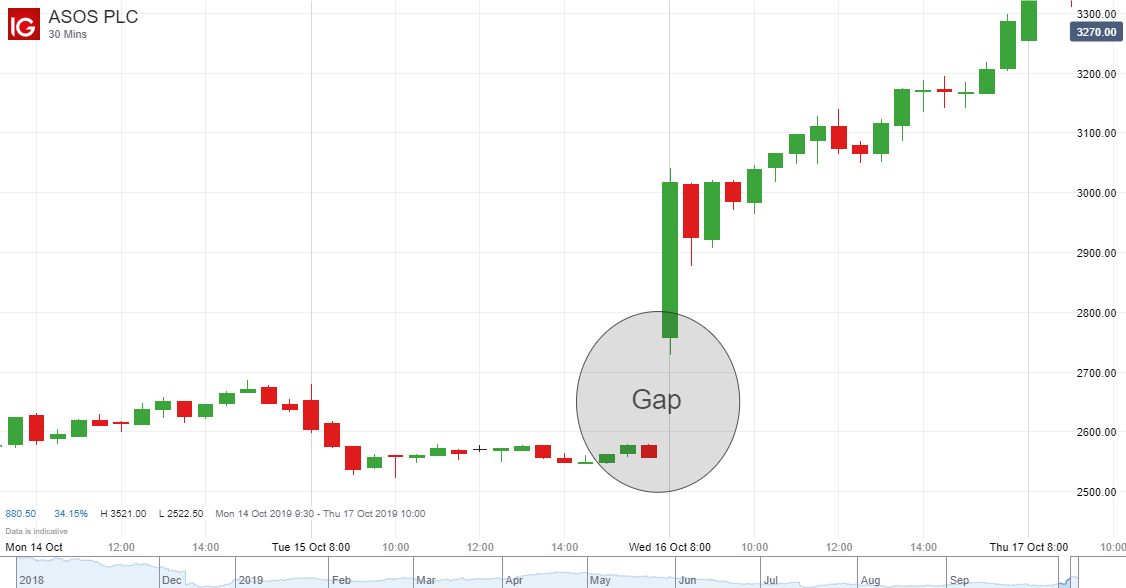
A gap refers to the area on a chart where no trading activity has taken place. This will appear as an asset’s price moves sharply up or down with nothing in between, meaning the market has opened at a different price to its prior close.

Example of a gap shown on candlestick chart

Why does the gap occur? The most frequent cause is fundamental factors. For example, in the chart above, ASOS stock rallied overnight as the company’s full year results showed it avoided another profit warning – along with traders showing confidence in the company’s ability to fix critical operational issues.

Other news such as product announcements, analyst upgrades and downgrades, and new senior appointments can lead to gaps. This is because they can move the market significantly between trading sessions in either direction.

Gap down stocks vs Gap up stocks

Gap down stocks and gap up stocks refer to the direction of the price movement either side of the gap. A full gap down is when the opening price is lower than the prior low price, while a full gap up (as shown above) occurs when the opening price is greater than the prior high price.

The four types of gaps in trading

Aside from gap down and gap up, there are four main types of gap, dependent on where they show up on a chart: common gaps, breakway gaps, continuation or runaway gaps, and exhaustion gaps.

1. Common gaps simply show a gap in price action independent of price patterns and usually don’t provide exciting trading opportunities.

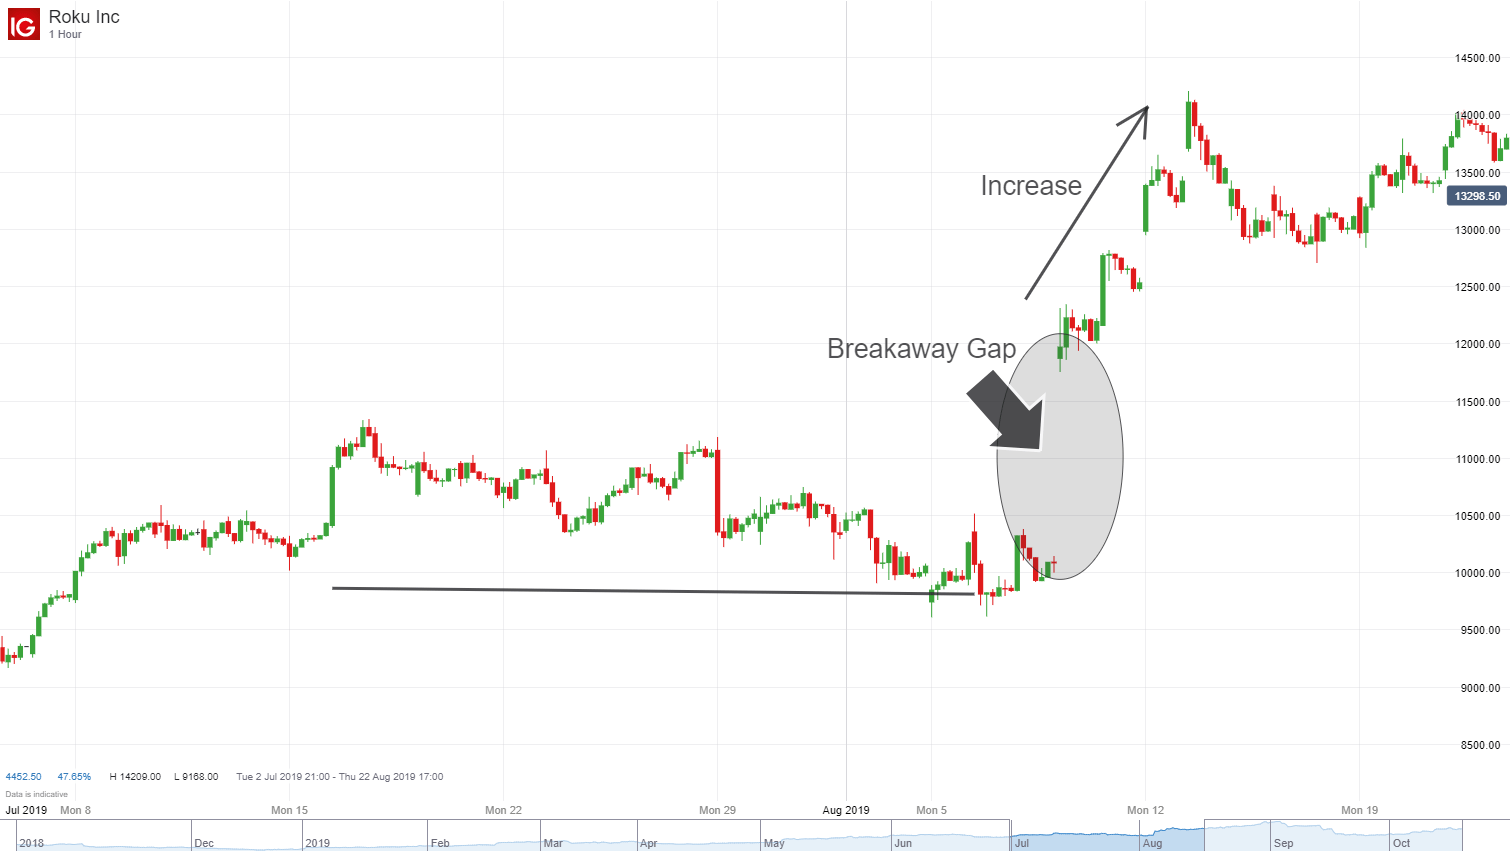
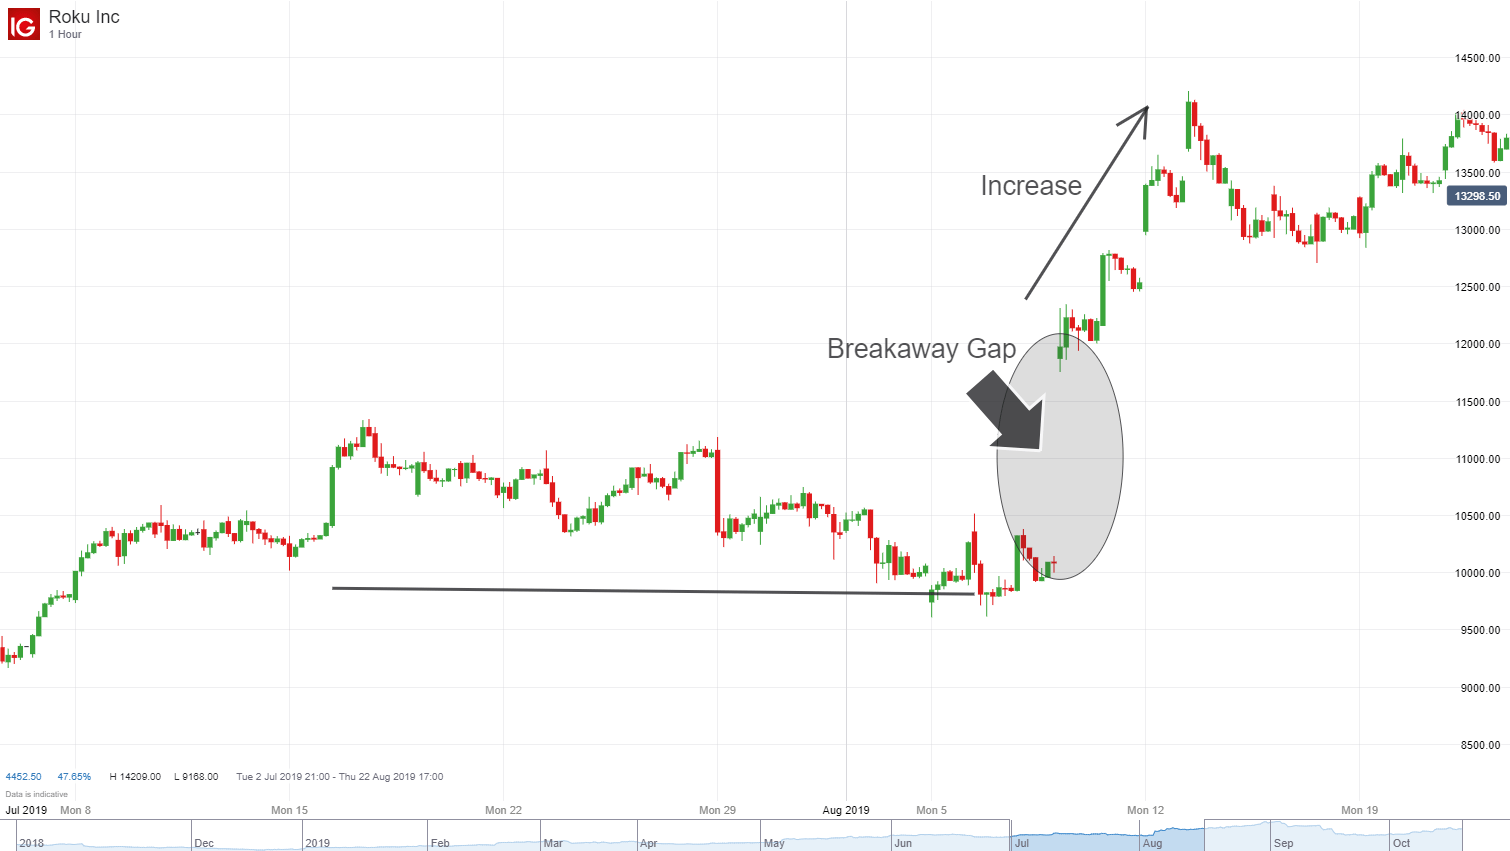
2. Breakway gaps signal a new trend where the asset ‘gaps away’ from the price pattern, as can be seen below where the gap triggers a breakout. If a breakaway gap is accompanied by higher trading volume, it may be worth taking a position long for a breakaway gap up, and short for a breakaway gap down, on the candle following the gap. (see our gap trading example below).

A breakaway gap shown on a candlestick chart

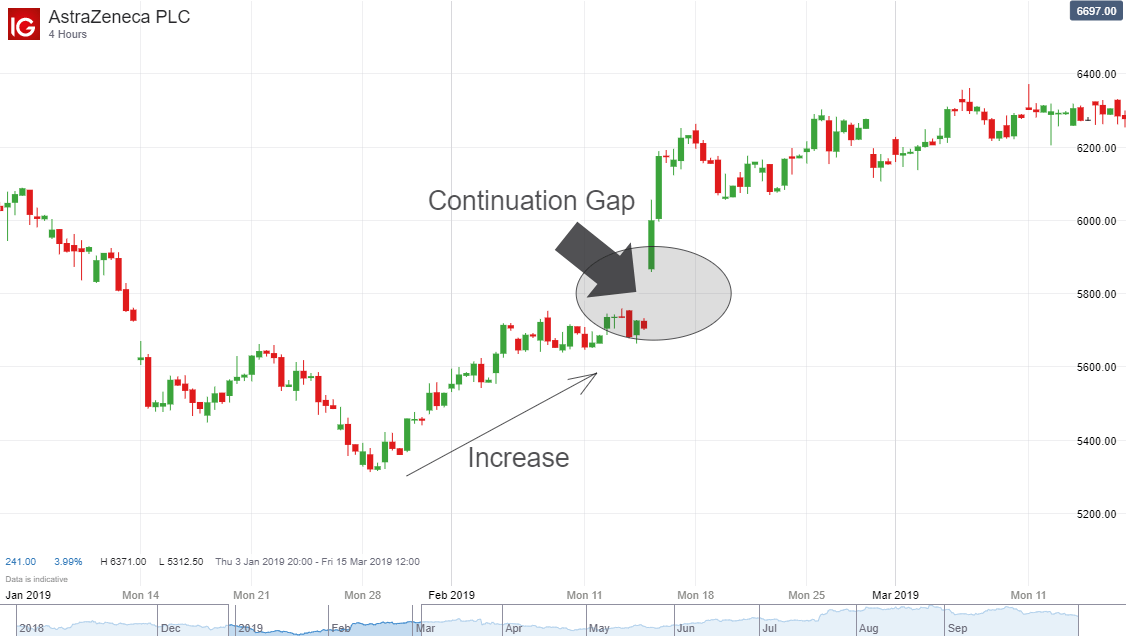
3. Continuation or runaway gaps show an acceleration of an already bullish or bearish pattern in the same direction. This can be caused by a news event that confirms the sentiment and furthers the trend. Traders might look to follow the trend and place a stop just below the gap for a bullish runaway gap and just above for a bearish runaway gap.

A continuation gap shown on a candlestick chart

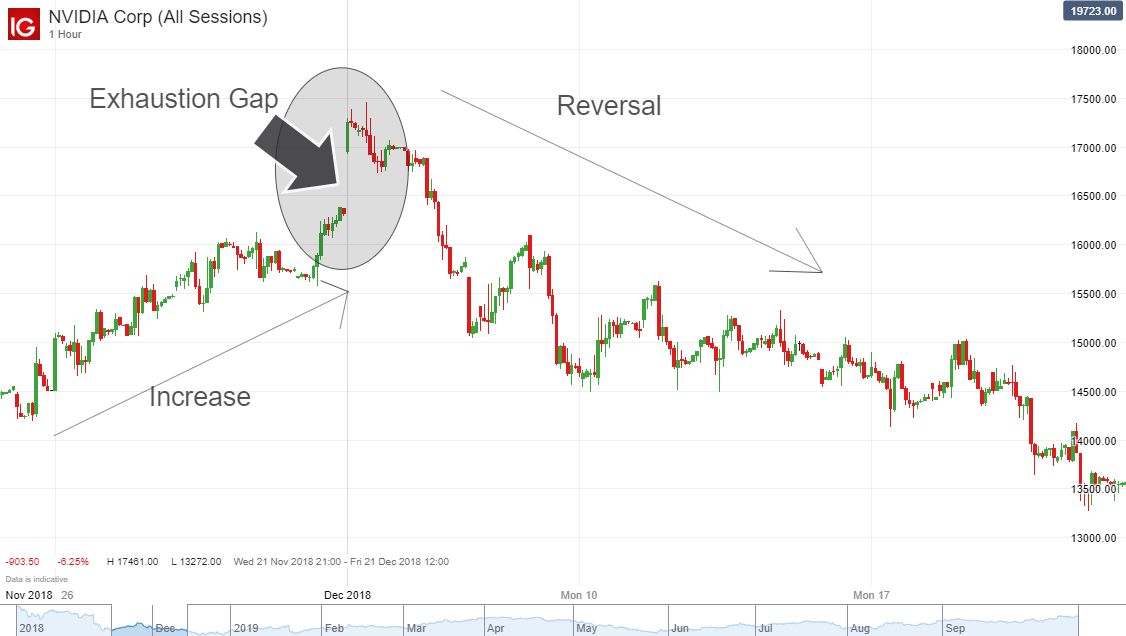
4. Exhaustion gaps are, conversely to continuation gaps, where price makes a final gap in the trend direction, but then reverses. This is often caused by a herd mentality of traders rushing to the trend and moving the stock into overbought territory. Therefore, experienced traders will be watching for the reversal and take the contrary position to the prior trend.

What does it mean when a gap has been ‘filled’?

A gap being ‘filled’ refers to the price returning to the original level before the gap happened. This usually means the price action, in the following days or weeks, retraces to the last day before a gap.

There are a range of factors that come into play with gap fill stocks:

  • Price corrections: An overly optimistic or pessimistic initial spike may invite a correction.
  • Support and resistance isn’t left behind when a price moves up or down sharply.
  • Patterns: Price patterns dictate the likelihood of a gap being filled. For example, price reversals seen with exhaustion gaps are likely to be filled as this type of gap signals the end of a price trend.

Trading the gap: Gap trading strategies & tips

There are a range of gap trading techniques to explore,from fading and predicting gaps to using indicators to help you gauge price action.

Fading the gap

‘Fading the gap’ is when gaps are filled within the trading day they occur. Let’s say a stock gapped up at the open with a higher price than the previous close, on a positive earnings report. Now let’s say, as the day progresses, tradersdelve deeper into the company’s presentation deck, see things they don’t like, and start selling. Eventually, the price hits yesterday’s close, and the gap is filled.

Irrational exuberance from less experienced traders can be particularly advantageous for more seasoned market practitioners when it comes to fading the gap, as the volume that causes the gap is often caused by FOMO in trading .

Predicting a gap

If technical or fundamental factors point to the potential for a gap on the next trading day, it may be time to enter a position. For example, having detailed knowledge of a given company and its operations can help a trader predict a gap for that stock ahead of an earnings report.

Using indicators

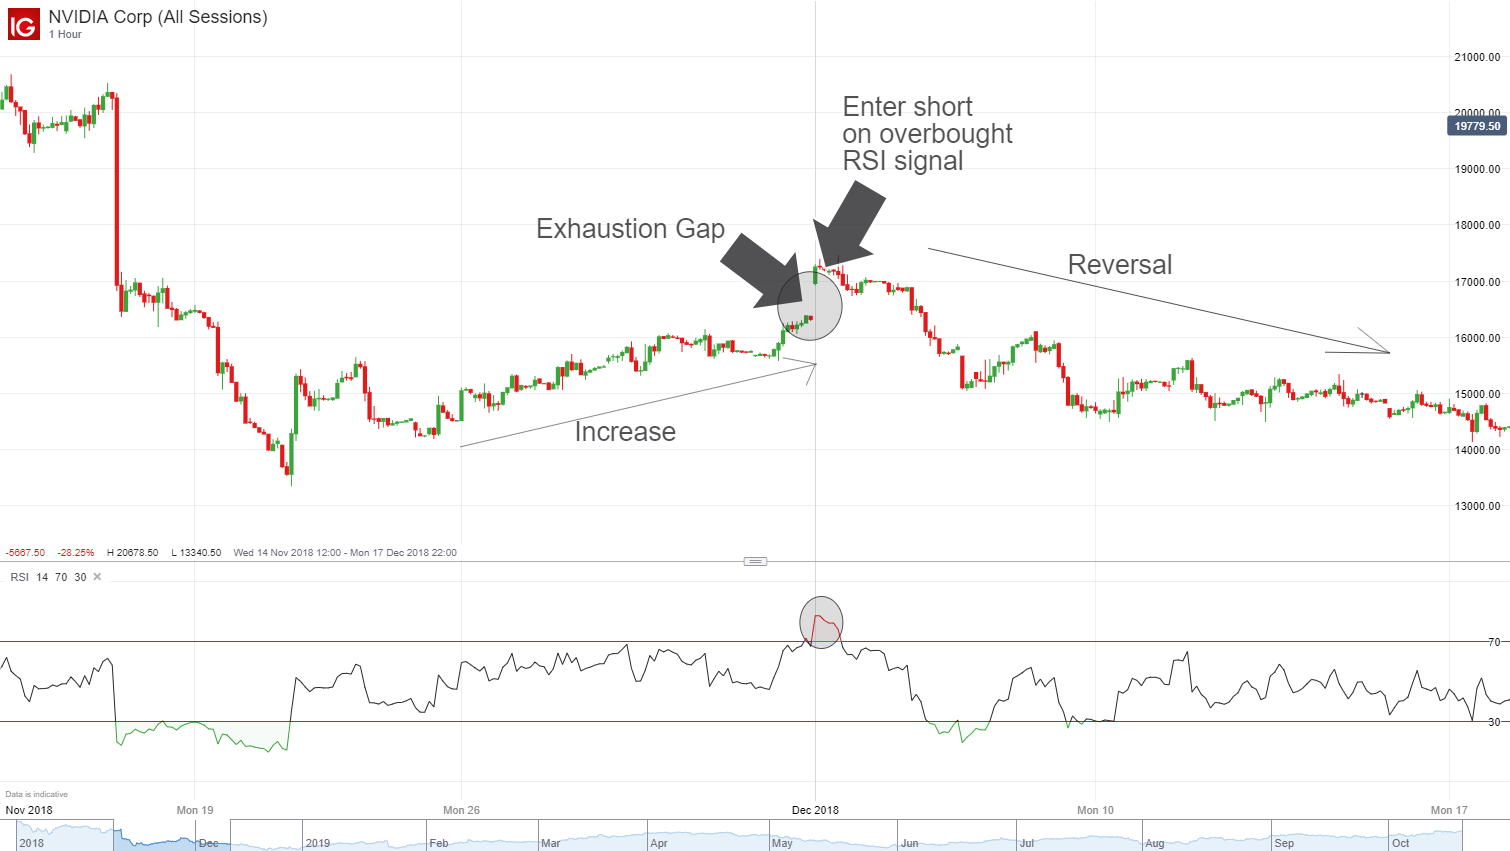
Traders can use tools such as the Exponential Moving Average and RSI to ascertain key price points and inform their decisions. For example, the below chart shows how an overbought RSI signal can be used to enter short after an exhaustion gap.

Chart showing how to trade exhaustion gap

The next chart shows an aggressive approach to the breakaway gap example. It reveals where a long position is entered in response to increased trading volume following the gap, and a possible initial stop loss level to protect against the higher risk.

A more conservative approach to this breakaway gap would be to enter on a pullback , which gives the opportunity to test the gap. While it may offer smaller upside, this approach means traders can get away with a much tighter initial stop loss order.

Chart to show how to trade a breakaway gap

Gap Trading Rules: Key things to consider

  • Classify the gap you are going to play : It’s important to know which of the four types of gap you have identified. A continuation gap will prolong a trend while an exhaustion gap is set to reverse it – two very different outcomes.
  • When a gap has started filling, it will rarely stop due to there often being no immediate support or resistance.
How to Trade Bullish Flag Patterns

How to Trade Bullish Flag Patterns

What is a bull flag?

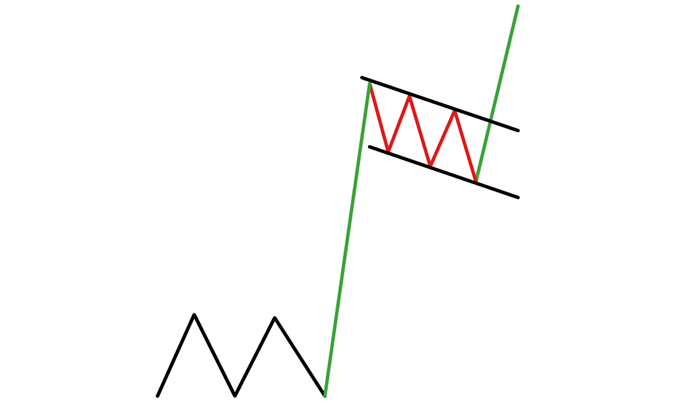
A bull flag is a continuation pattern that occurs as a brief pause in the trend following a strong price move higher. The bull flag chart pattern looks like a downward sloping channel/rectangle denoted by two parallel trendlines against the preceding trend.

During this period of consolidation, volume should dry up through its formation and resolve to push higher on the breakout. The actual price formation of the bull flag resembles that of a flag on a pole hence its namesake.

Bull flag pattern:

Please add a description for the image.

How to identify a Bullish Flag on Forex Charts

It can be complex identifying a bull flag on a chart because the pattern entails several different components. Traders will need to correctly identify and understand these components to trade this pattern successfully. Key things to look out for when trading the bull flag pattern are:

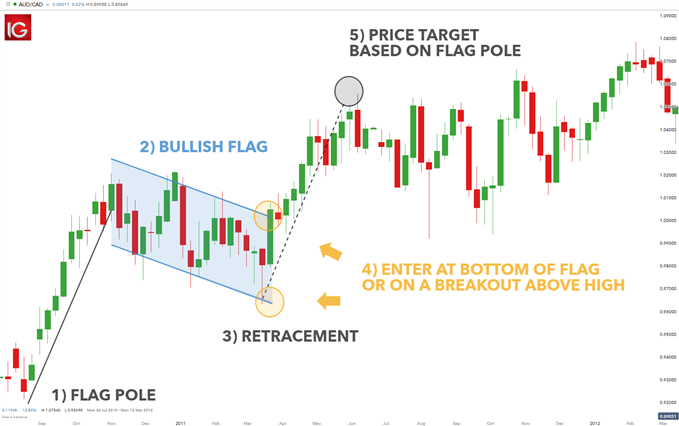
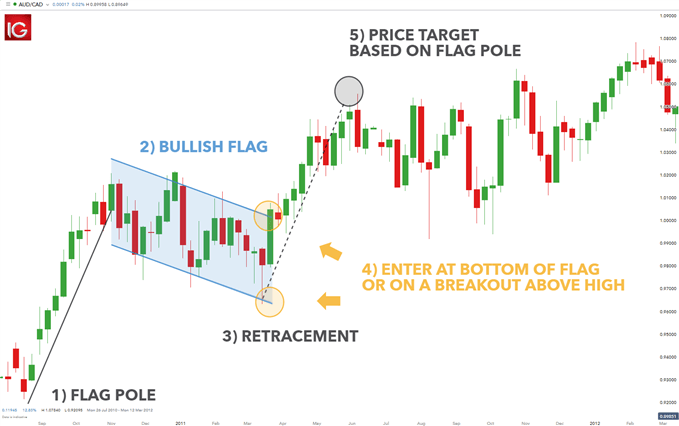
  1. Preceding uptrend (flag pole)
  2. Identify downward sloping consolidation (bull flag)
  3. If the retracement becomes deeper than 50%, it may not be a flag pattern. Ideally, the retracement ends at less than 38% of the original trend
  4. Enter at bottom of the flag or on the breakout above the high of the upper channel boundary
  5. Look for price to break higher with a length potentially equal to the size of the flag pole

Bull Flag Trading Strategy

The following trading example shows the bull flag on a forex chart.

AUD/CAD bull flag pattern

Please add a description for the image.

As shown by the bull flag chart pattern above, traders have been buying risk through commodities, the stock market, and risk-based currencies. As a result, the AUD performed well against most other currencies in part because it offers a higher rate of return owing to its interest rate. Hence, traders have a fundamental back drop to support the technical picture for additional strength in AUD.

The AUD/CAD is no stranger to the flag pattern. The previous uptrend (flag pole) is noted in black. Prices consolidated in a gently downward sloping channel (blue). To trade the flag, traders can time an entry at the lower end of the price channel or wait for a break above the upper channel (yellow). Traders then look to take profits by projecting the length of the flag pole preceding the flag (black dotted line).

How reliable is the Bull Flag in forex trading?

The reliability of the bull flag pattern depends on the success of the checklist mentioned above. When all components of the bull flag are identified and present within the chart, the bull flag pattern is considered to be a formidable pattern to trade.

The table below identifies the advantages and limitations of the bull flag pattern:

ADVANTAGES LIMITATIONS
Works in all financial markets Can be complex for novice traders
Pattern helps determine entry and limit levels
Good risk-reward ratio

Bull Flag vs Bear Flag

The bull flag and bear flag represent the same chart pattern however, just mirrored.

  • The bear flag appears in a downtrend as opposed to the bull flag which occurs in an uptrend
  • The bear flag pattern will breakout from the consolidation once price breaks the lower channel
  • Both the bear and bull flag chart patterns measure the target price as a projection using the length of the flagpole