Big Mistake Leads Technical Trader to Top Three Tools

Big Mistake Leads Technical Trader to Top Three Tools

The 116 Death Trap

Developing your strategy comes at a cost –often a lot of time, money and frustration. I came to this realization in 2003 as USD/JPY was pulling back from multi-year highs. The ‘116 death trap,’ as I’ve dubbed it, was a seemingly rock solid zone of support. It had caught the lows since 2001 with numerous defenses suggesting a perfect opportunity for me to ‘catch the lows’ and cost average in. Even when price broke, my hope was that every rebound was the low. Not quite. In September of 2003, the death trap began with a drop of more than 12% over the next year, taking USD/JPY to lows not seen since the late-90s. Even a glimmer of hope offered by a multi-week rally in early 2004 reversed. With the pain finally too hard to tolerate, I exited at the lows. So much for cost averaging into a loser. That was my hard lesson learned.

USD/JPY Daily Price Chart

Where did I go wrong?

Well, there was a lot, but for starters, emotions are not your friend. Most of all, my error was not having a plan and not recognizing market conditions. Knowing the style of trading that works best for your personality, risk tolerance and goals is critical and without a plan you are on a ship without a rudder.

Everyone comes to this realization differently. I learned through years of managing market flow for one of the first brokers to offer online retail FX trading. It was through close observations of retail market flow and tracking near-term price-action that Ideveloped three basic principles for my technical trading strategy. It boils down to assigning a value for price, time and momentum.

Price Value – Key reversals, Fibonacci, High/Low-day Closes

It’s all about the levels – identifying support / resistance is a critical part of being able to create actionable trade ideas targeting or countering key levels in price. These lateral levels can be identified using various methods. The three I rely on most are key reversals (outside-day reversals), high and low-day closes and Fibonacci.

The word “Fibonacci” often appears in trading and it is likely that you have already seen or heard of it — for good reason. It is a simple measurement based on the golden ratio of 61.8%. This ratio can be observed everywhere in nature from trees to galaxy formations and is also very relevant to buying and selling behavior in markets. It is a tool you can implement in both trending and range-bound markets to help identify areas of possible support / resistance. We have a lot more in the education section: Fibonacci Application in Financial Markets (dailyfx.com)

Time value indicator – Slope and Trend lines

One discipline I rely heavily on is pitchfork and median-line analysis. The goal of this style of analysis is to identify the slope or gradient of a given market in an attempt to highlight when a price level may be significant. It is this time value that adds another dimension to the lateral levels identified earlier – these “confluence zones” are often points in price and time that can offer major pivots in near-term price-action. Trading into / off these inflection points todayform the basis of my favored technical trade setups.

Momentum value – RSI

The speed of a market can tell The Relative Strength Index (RSI). The RSI is an oscillator that is used as a measure of momentum — the speed of the recent price movement in either direction. While all oscillators are inherently backward looking, they can still be of value when you are trying to asses when the market maybe overextended in either the overbought or oversold conditions. The ability to assess the inertia of a given market is critical for near-term swing and trend trading as it offers a window into the possible longevity and strength of a given move as well as ideas on when it may expire.

Bottom line

Having a multi-faceted approach that takes into account price value, momentum value and time value could help steer you not only to possible opportunities, but also help you avoid failure. Knowing the condition of the market using price, time and momentum has been a major philosophy of my trading.

Breaking Down the Santa Claus Rally Using the VIX, MOVE, GVZ and EVZ Indices

Breaking Down the Santa Claus Rally Using the VIX, MOVE, GVZ and EVZ Indices

Market conditions tend to dramatically change at the end of each year, producing seasonality. These factors include thinning liquidity, year-end rebalancing and to a certain extent, a lack of notable economic event risk. Of course, fewer market participants also raise volatility risk. So, if an acute economic or geopolitical shock occurs during this period, wild price swings can happen.

You might have come across the so-called “Santa Claus Rally” theory, which is typically defined as a push higher in equities that occurs leading into the Christmas holiday on December 25th. The latter brings up disagreements between traders and financial intuitions about which specific days/weeks such a rally could occur.

Then, as we get past the holidays, volatility should theoretically come back online, producing a “U-“ or “V-” shaped pattern”. At least, this is the general idea that most traders may have in mind. As we are about to find out, however, there is more to it than that. In fact, data over the past few decades seems to suggest that there is more of a “double-dip” or “W-shaped” phenomenon going on.

This analysis looks at popular gauges of ‘market fear’ such as the VIX, MOVE, GVZ and EVZ for equities, bond markets, precious metals and currencies, respectively. This is not a piece dedicated to explaining the intricacies of these indices. To make a long story short, if they are rising, that tends to mean there is more volatility going on and vice versa.

VIX Index Christmas Analysis

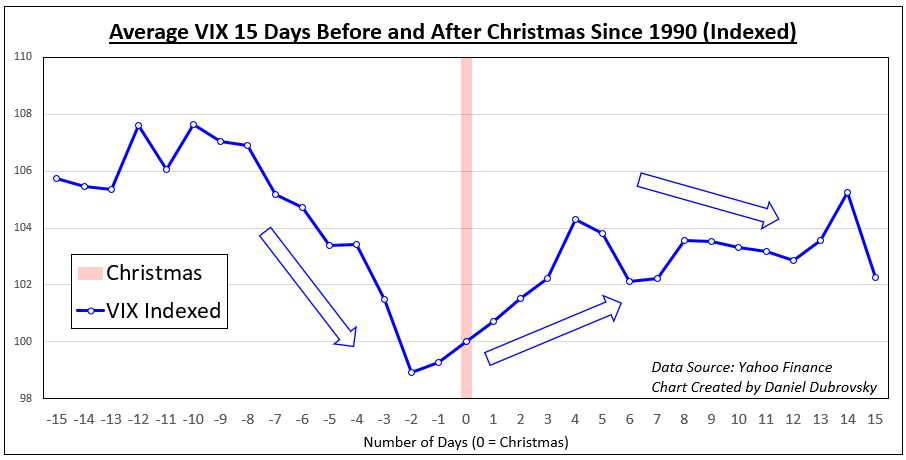
Let us begin with the most popular gauge of volatility, the VIX Index. The latter is specifically following the S&P 500, which is often used to look at general risk appetite. In the chart below, the VIX’s average performance 15 days before and after Christmas since 1990 is displayed. There seems to be a 3-step pattern that occurs each year.

The first step seems to confirm the “Santa Claus Rally” theory, and it shows the VIX cooling in the weeks leading to Christmas. Then, the second step shows volatility rising in the days after. Finally, about 4 days after Christmas, or around New Year’s, volatility cools down again, but it is very slight. What about other markets?

VIX Index Christmas Analysis

MOVE Index Christmas Analysis

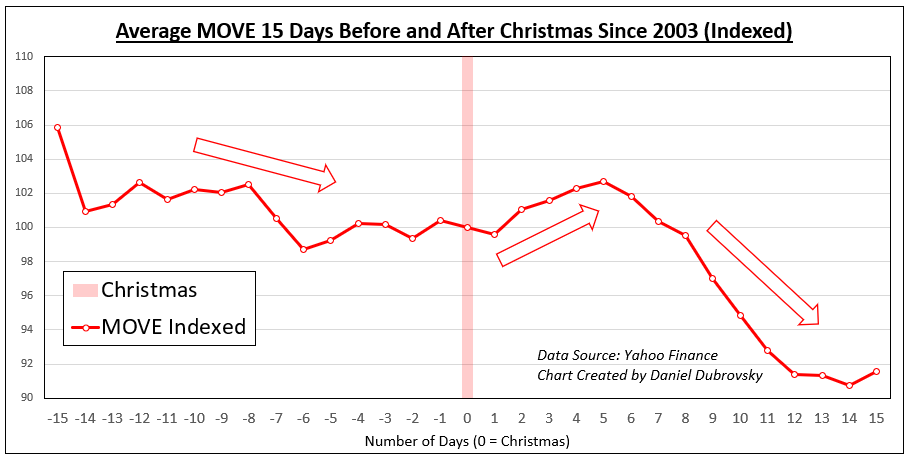
The MOVE index is essentially the bond market equivalent of the VIX, used to measure US interest rate volatility. Similarly to the VIX, MOVE tends to decline in the days leading into Christmas, on average. But, the decline is not as pronounced as the VIX. After the holiday, we see an uptick in volatility for a few days. Finally, around the 5th day, we see a second dip in volatility. The latter is more pronounced than what is seen in the VIX.

MOVE Index Christmas Analysis

GVZ Index Christmas Analysis

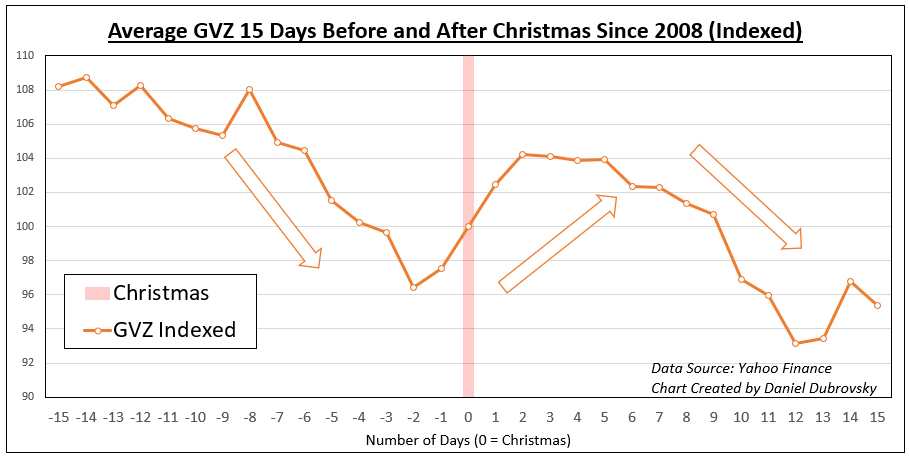
Turning to the GVZ index, which is the gold market equivalent of the VIX, the index follows an almost exact path as the MOVE. Volatility cools leading into Christmas, then there is a slight boost ending with a notable second dip in the days after New Year’s. This is not terribly surprising. Gold is an anti-fiat instrument that is closely tied to the Federal Reserve’s policy, the Treasury market, and the US Dollar.

GVZ Index Christmas Analysis

EVZ Index Christmas Analysis

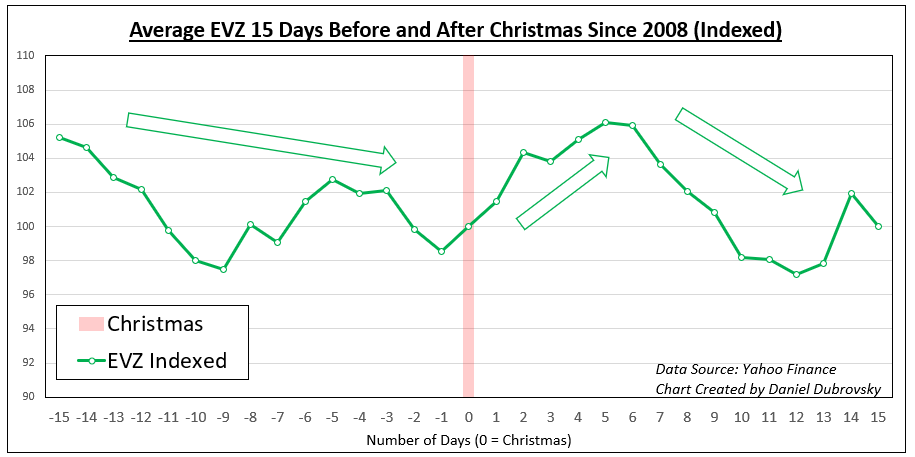
Finally, let’s look at the EVZ Index, which is the Euro exchange rate equivalent of the VIX. Similarly to the MOVE and GVZ indices, the EVZ starts with a cautious dip in volatility heading into Christmas. Then, momentum picks back up before a second dip occurs in the days around New Year’s. This also makes sense as the exchange rate would typically be tied to the same dynamics impacting bond markets.

EVZ Index Christmas Analysis

The Double Dip in Market Volatility Around Christmas

As we saw, there is more to it than just a “V” or “U” pattern in market volatility around Christmas. Between stock, Treasury, precious metal and currency markets, we tended to see a second round of price action cool in the week or so following Christmas. That produced a “W” pattern. In some cases, it was as profound, or stronger, than the cooldown before Christmas. Keep in mind that past performance is not indicative of future outcomes, but this seasonality seems to hold over time.

Trend Trading: Pros & Cons

Trend Trading: Pros & Cons

All trading strategies have their positives and negatives that a trader must get comfortable with in order to execute a strategy confidently and efficiently. At the end of the day a trader should have strategies that allow them to take advantage of various market conditions, but typically there will be a bias towards one approach and market environment versus another. For example, some favor high volatility over lower volatility or breakout vs range. In this piece, we’ll discuss the pros and cons of trend trading, a discipline I tend to gravitate towards.

One of the biggest advantages of trading trends is the potential reward relative to risk. Strong trends are known for lasting much longer than most participants think is possible. In the past two decades alone, there have been a vast number of trends that far exceeded what was “reasonably justified” by the factors driving it, and the expectations of most market participants.

Risk/reward ratios for good trend-following strategies are much higher than those typically found in other strategies, such as mean reversion or range-trading. This is because trends by nature are expansive and generally unbound, while strategies geared towards mean reversion and ranges have finite expectations.

Higher risk/reward ratios do come at a cost, however. Trend trading strategies typically have lower winning percentages, but this is offset by the positive skew in reward relative to risk. As long as the math works out where the risk/reward relative to the win% provides an edge, then it doesn’t matter. For example, if you are winning at a clip of only 40%, but are making 3x more on your winners than losers, it doesn’t matter that you are wrong 60% of the time. The math works. Just as if you were right 60% of the time, but making 1.5x your risk on trades. Again, the math works.

Let’s say out of a sample of 10 trades, 40% of traders are winners and your average win is 3x your average loss: 4 x 3 units of reward = 12 units, 6 x 1 unit of risk = 6 units lost. This nets out to 6 units of reward.

40% w/l @ 3:1 r/r over 10 trades equates to: 12 units gained – 6 units lost = +6 units

And if you were running a strategy that has a winning percentage of 60% with a risk/reward ratio of 1.5, the math would look like this; 6 x 1.5 units of reward = 9 units of reward, 4 x 1 unit of risk = 4 units lost. In this scenario you would net out +5 units.

60% w/l @ 1.5:1 r/r over 10 trades equates to: 9 units gained – 4 units lost = +5 units

The reason for the lower win percentage is that that markets tend to range or behave in a choppy manner more often than they trend, and as a result there are a lot of trends that stop as quickly as they begin to form. Which, again, is fine because when a good trend does form, if properly taken advantage of, it should provide plenty of reward to offset the times when there are false breakouts that create losses. The downside for many traders is that this requires a lot of patience and willingness accept frequent losses, something that can take some getting used to. As humans we don’t like to lose, and so to accept losing frequently in favor of an infrequent winner, even if it is outsized, can create an internal struggle.

Trend forming after false breakout (USD/JPY 2021/22)

Chart, histogram  Description automatically generated

Trends form on a time-frames, so whether you are looking to take advantage of them for short-term trades lasting a few days or less, or longer such a few weeks or longer, there are opportunities to be found. What is an uptrend on a short-term time-frame may very well be occurring within the context of a longer-term trend. The key here is to understand which time-frame you are focusing on, so you don’t mix yourself up getting caught between trends on different time-frames. Pick a couple and stick to them. Trying to catch trends on too many time-frames is likely to lead to sloppy and inconsistent trading.

Trend on Daily Chart of S&P 500

Chart, line chart  Description automatically generated

S&P 500 Chart

Trend unfolding on 1-hour chart of EUR/USD

Chart  Description automatically generated

EUR/USD Chart

Summary:

  • Like any trading style trend trading has its positives and negatives
  • High risk/reward ratios is a positive with trend trading, but it does come at the expense of a lower win percentage (something a trader has to learn to accept)
  • Markets are often caught between trends, so patience is required to find good trends that will offer up good reward relative to risk
  • Trends can be traded on any time-frame – the key is to stick to only a couple so you don’t get the execution on the time-frames mixed up