Untitled

Gold steadies as traders look for direction on Trump tariffs

Gold’s price (XAU/USD) stabilizes and consolidates within a tight range near the $2,900 level at the start of the week. Traders are mulling over comments from United States (US) President Donald Trump after an interview on Fox News over the weekend. When asked about the US economy, President Trump said that the economy is in a ‘transition’ phase, while markets have already floated the idea that the US economy is in a recession scenario.

Meanwhile, Federal Reserve (Fed) Chairman Jerome Powell issued some remarks on Friday before the Fed’s blackout period started. That blackout period precedes the actual policy rate decision on March 19, where expectations are for keeping the policy rate steady. Powell said that the central bank does not need to do anything at this point and that the price for keeping its policy rate steady comes with a very small price against the chances of a policy mistake by changing interest rates preemptively.

Technical Analysis: Time to come off the boil

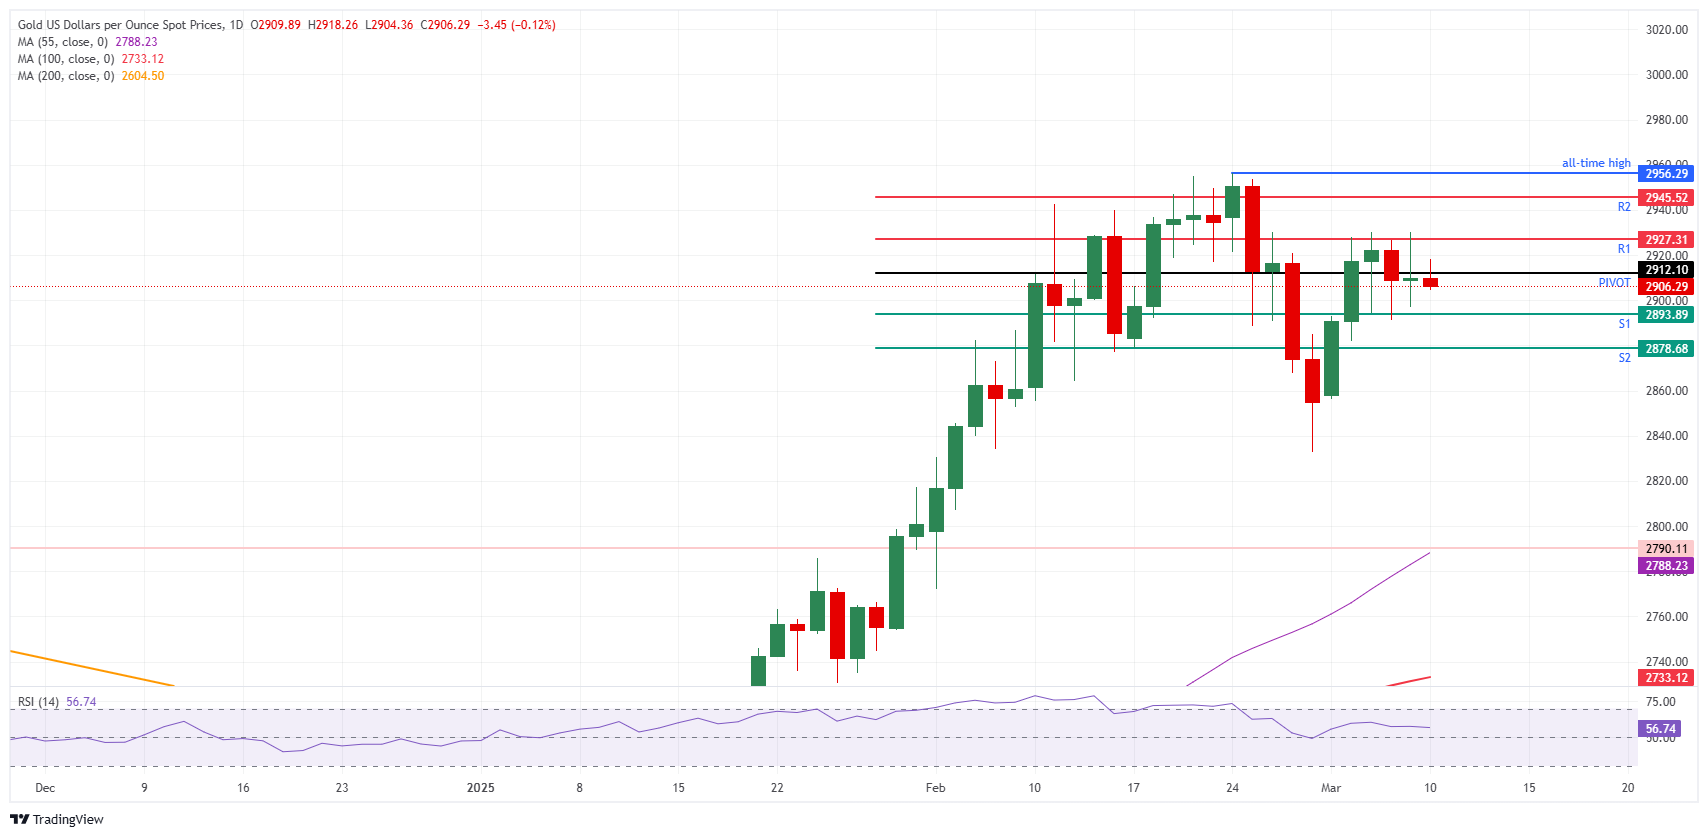
It is time for markets to settle down and see a pullback after stretched positions and moves on the charts. The same goes for Bullion, where the precious metal would benefit from a pullback. Should President Trump remain relatively quiet on any additional tariffs, the nervousness would start to settle and would see Gold dipping towards the S2 support of the daily Pivot Point near $2,878 or even lower, ideal for bulls to get back in before reciprocal tariffs are set to hit by next month.

While Gold trades near $2,905 at the time of writing on Monday, the daily Pivot Point at $2,912 and the daily R1 resistance at $2,927 are the key levels to watch for. In case Gold sees more inflows, the daily R2 resistance at $2,945 will possibly be the final cap ahead of the all-time high of $2,956 reached on February 24.

On the downside, the $2,900 psychological big figure and the S1 support at $2,893 acts as a double support barrier. If Bullion bulls want to avoid another leg lower, that zone must hold. Further down, the daily S2 support at $2,878 should be able to catch any additional downside pressure.
XAU/USD: Daily Chart


XAU/USD: Daily Chart

mun

EUR/USD: Likely to trade sideways between 1.0800 and 1.0890

Euro (EUR) is likely to trade sideways between 1.0800 and 1.0890 vs US Dollar (USD). In the longer run, uptrend remains intact, but it is unclear for now if EUR can reach 1.0945, UOB Group’s FX analysts Quek Ser Leang and Peter Chia note.

Uptrend remains intact

24-HOUR VIEW: “We highlighted last Friday that ‘the current price movements are likely part of a range trading phase, probably between 1.0740 and 1.0840.’ We did not expect the continued advance in EUR, as it rose to 1.0888 during the NY session and then pulled back to close at 1.0832 (+0.45%). Despite the rise, there has been no clear increase in upward momentum. Today, instead of continuing to rise, EUR is more likely to trade sideways between 1.0800 and 1.0890.”

1-3 WEEKS VIEW: “We shifted our view to positive early last week (as annotated in the chart below). Tracking the subsequent sharp rally, we indicated last Friday (07 Mar, spot at 1.0790) that ‘while the uptrend remains intact, at this stage, it is unclear for now if EUR can reach 1.0945.’ Although EUR subsequently rose to 1.0888, conditions are deeply overbought, and it remains unclear for now if it can reach 1.0945. Overall, only a breach of 1.0690 (‘strong support’ level previously at 1.0640) would suggest that the sharp rally is ready to take a breather.”

Pound Sterling grips gains against US Dollar as investors doubt US economic strength

Pound Sterling grips gains against US Dollar as investors doubt US economic strength

The Pound Sterling (GBP) clings to gains slightly above 1.2900 against the US Dollar (USD) in Monday’s European session. The GBP/USD pair strengthens as the US Dollar struggles to gain ground amid growing concerns over the United States (US) economic outlook. The US Dollar Index (DXY), which tracks the Greenback’s value against six major currencies, trades cautiously near the four-month low of 103.50.

Market participants have become increasingly worried over US economic prospects after comments from US President Donald Trump on Friday indicated that his “American First” policies could lead to economic turbulence in the near term.

US President Trump refrained from guiding the impact of his policies on the economy but said in the interview with Fox News that there is a “period of transition”, because what we are doing is very “big”. His comments came after being asked whether his policies could lead to a recession in the economy.

Donald Trump reiterated that reciprocal tariffs will be announced on April 2. Last week, Trump imposed 25% tariffs on imports from Canada and Mexico but exempted many products that come under the purview of the United States-Mexico-Canada Agreement (USMCA) for a month. He also increased surcharges on Chinese imports to 20% by imposing an additional 10%.

Market experts continue to believe that Trump’s tariff policies would be inflationary for the economy, but they have changed their perception of its impact on the economic outlook. At one point when Trump’s agenda was expected to accelerate economic expansion, it is now anticipated to fracture the economy. This has led to global brokerages revising their growth forecasts for the US economy. Goldman Sachs has downgraded its Q4 2025 Gross Domestic Product (GDP) growth forecast to 1.7%, from 2.2% previously anticipated, and raised its 12-month recession probability to 20% from 15%.

Investors also expect the Federal Reserve (Fed) would be forced to resume the policy-easing cycle as early as June. However, Fed Chair Jerome Powell reiterated in an economic forum at the University of Chicago Booth School on Friday that the interest rate policy is in “good shape” and the central bank wants clarity on Trump’s policies before making any monetary policy adjustment.

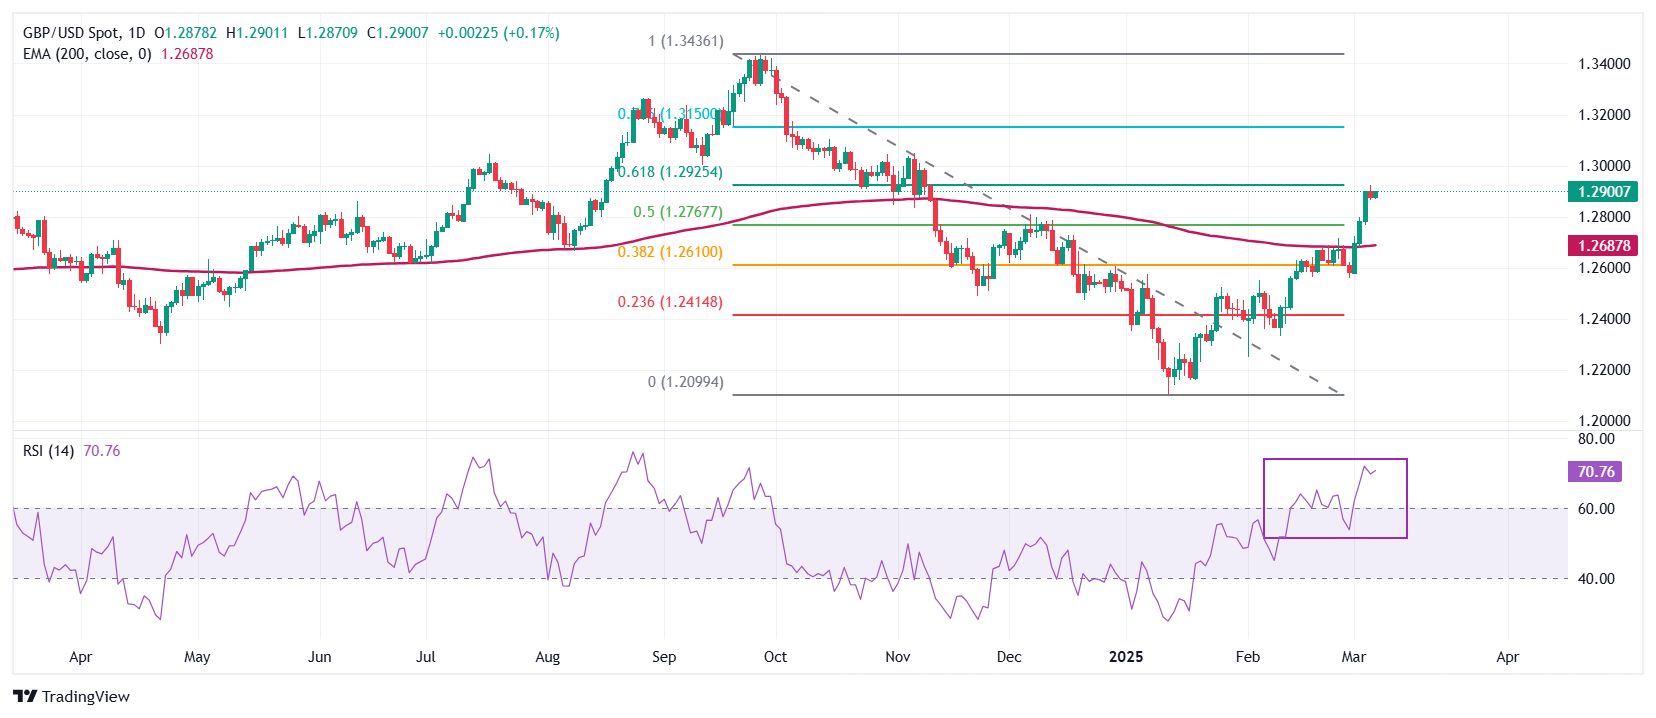
Technical Analysis: Pound Sterling stays above 200-day EMA

The Pound Sterling strives to break above the 61.8% Fibonacci retracement plotted from the late September high to mid-January low around 1.2930 on Friday. The long-term outlook of the GBP/USD pair has turned bullish as it holds above the 200-day Exponential Moving Average (EMA), which is around 1.2690.

The 14-day Relative Strength Index (RSI) climbs above 70.00, suggesting a strong bullish momentum.

Looking down, the 50% Fibo retracement at 1.2767 and the 38.2% Fibo retracement at 1.2608 will act as key support zones for the pair. On the upside, the psychological 1.3000 level will act as a key resistance zone.

mmty

US: An underwhelming jobs report with government shrinkage featuring in Feb payrolls

The latest US Employment Situation report by the Bureau of Labor Statistics (BLS) last Fri (7 Mar) was weaker than expected as jobs creation came in below projections with a surprise uptick in the unemployment rate while wage growth was within estimates, UOB Group’s Senior Economist Alvin Liew notes.

US reports a slightly weaker-than-expected jobs creation

“The US reported a slightly weaker-than-expected jobs creation at 151,000 in Feb (versus Bloomberg est 160,000) while unemployment rate also surprised with an uptick to 4.1% (from 4.0% in January). Job creation was still broad-based, but surprisingly, professional services and leisure recorded back-to-back losses, while government hiring slowed visibly as BLS reported that federal employment fell by -10,000 in February.”

Untitled

Gold price slips below $2,900 as USD rebounds from multi-month low

Gold price (XAU/USD) slips below the $2,900 mark during the first half of the European session on Monday and moves back closer to the lower end of a nearly one-week-old trading range. As investors look past Friday’s weaker US jobs report, the US Dollar (USD) stages a modest bounce from its lowest level since November and turns out to be a key factor undermining the precious metal.

However, bets that the Federal Reserve (Fed) will cut interest rates multiple times this year and a steep intraday decline in the US Treasury bond yields might hold back the USD bulls from placing fresh bets. Furthermore, worries about the economic fallout from US President Donald Trump’s trade tariffs and global trade war fears could offer some support to the safe-haven Gold price and help limit losses.

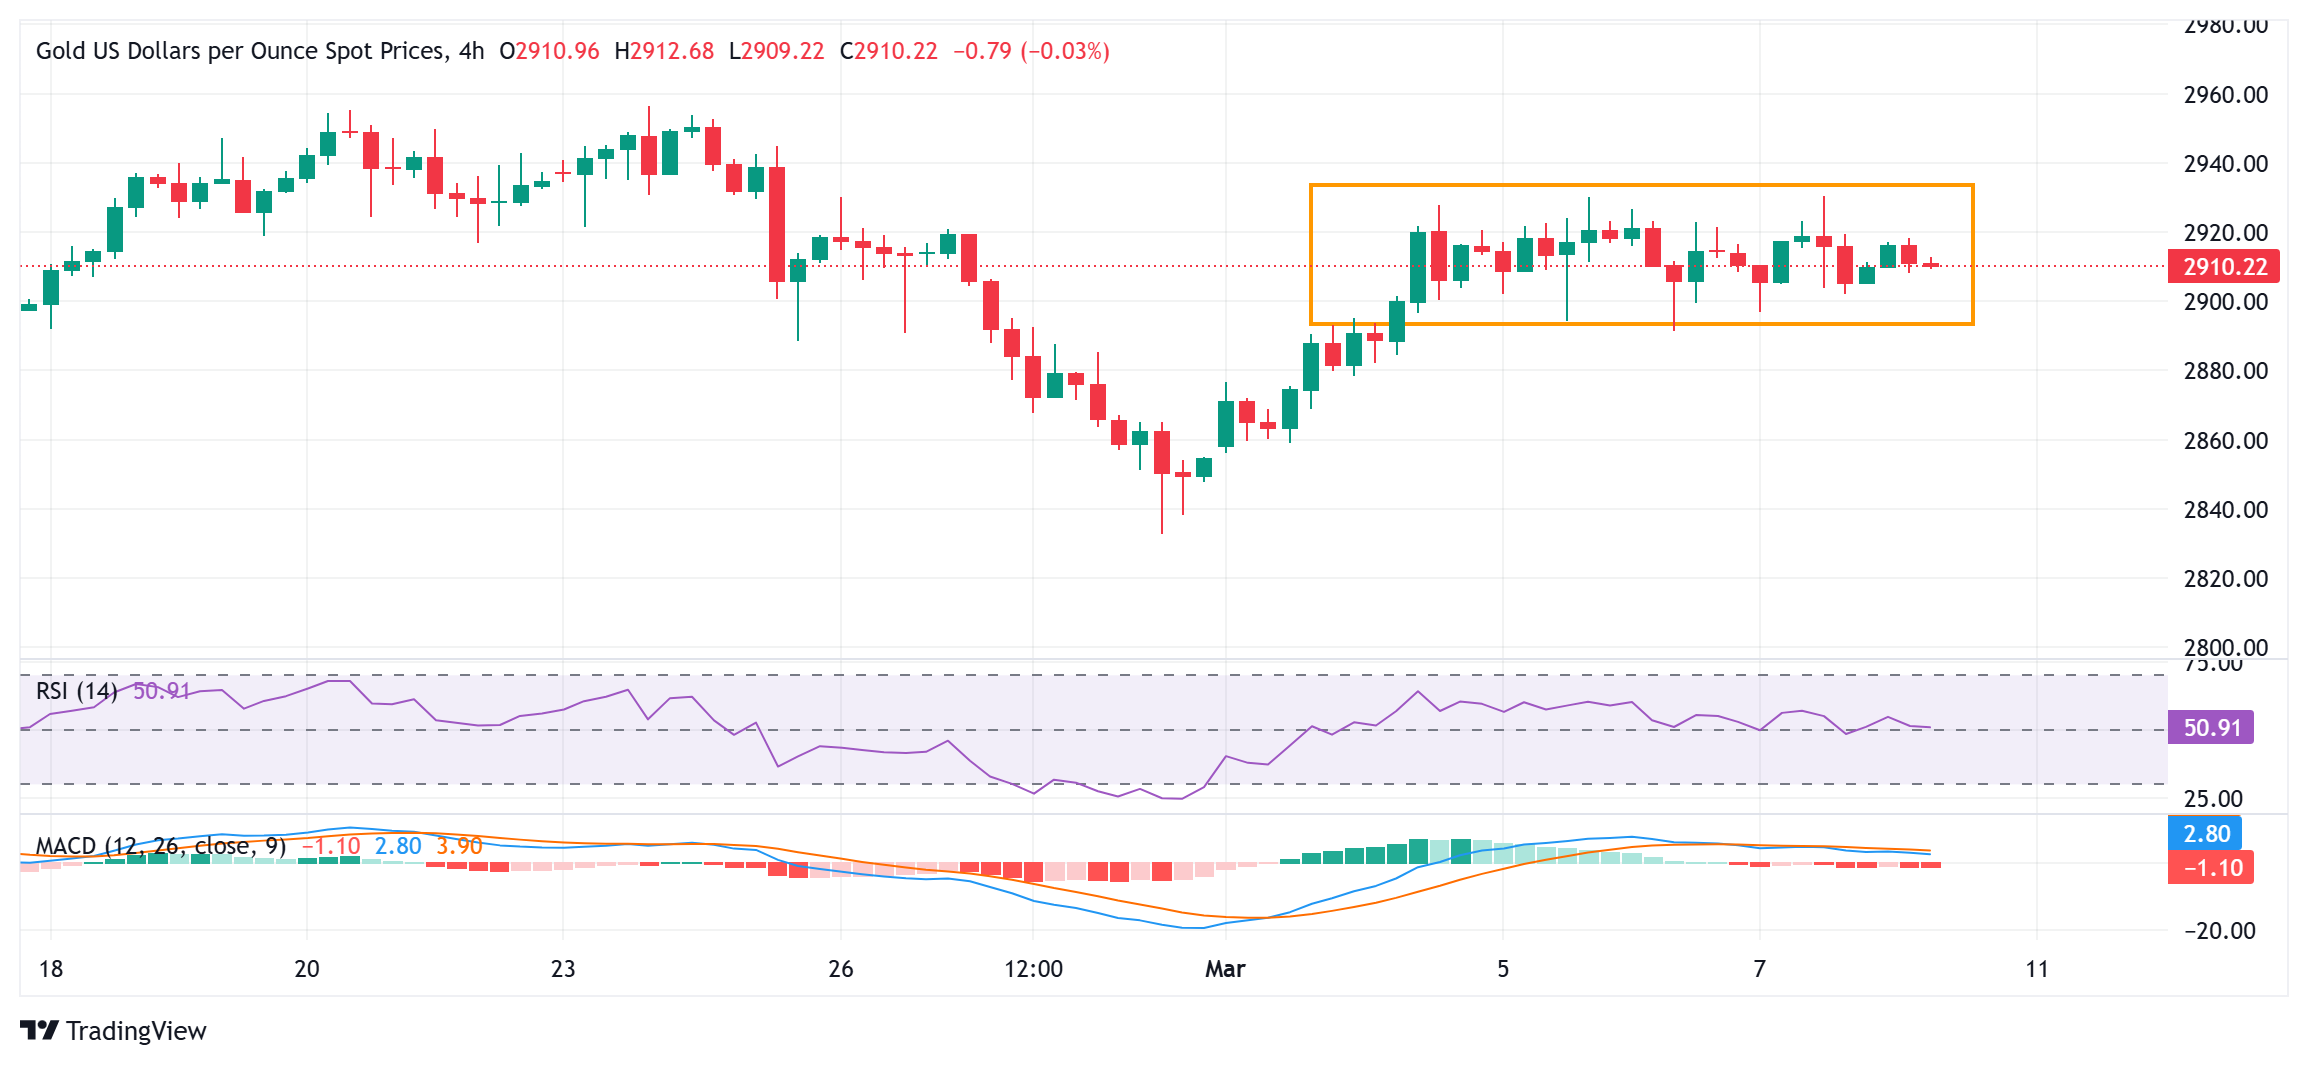
Gold price could accelerate the intraday slide once the trading range support, around the $2,893 area is broken decisively

fxsoriginal

From a technical perspective, the Gold price has been showing some resilience below the $2,900 mark. Moreover, oscillators on the daily chart – though they have been losing traction – are still holding in positive territory. That said, the recent repeated failures to make it through the $2,925-2,930 supply zone make it prudent to wait for strong follow-through buying before placing fresh bullish bets. The XAU/USD might then aim to challenge the all-time peak, around the $2,956 region touched on February 24.

On the flip side, acceptance below the $2,900-2,895 horizontal zone might prompt some technical selling and drag the Gold price to the $2,860-2,858 horizontal zone. The downward trajectory could extend further towards the February 28 swing low, around the $2,833-2,832 area, before the XAU/USD eventually drops to the $2,800 round-figure mark.

arr

NZD/USD: Set to trade in a range of 0.5710/0.5760

Further range trading in New Zealand Dollar (NZD) vs US Dollar (USD) seems likely; probably in a range of 0.5710/0.5760. In the longer run, current price movements are likely part of a recovery phase that could reach 0.5775, UOB Group’s FX analysts Quek Ser Leang and Peter Chia note.

Current price movements are likely part of a recovery phase

24-HOUR VIEW: “While we expected NZD to ‘rise further’ yesterday, we indicated that ‘overbought conditions suggest the major resistance at 0.5775 is out of reach for now.’ However, NZD did not quite ‘rise further,’ as it traded in a higher range of 0.5721/0.5760, closing modestly higher by 0.13% at 0.5734. Further range trading seems likely today, probably in a range of 0.5710/0.5760.”

1-3 WEEKS VIEW: “Our update from yesterday (06 Mar, spot at 0.5720) remains valid. As highlighted, the ‘current price movements are likely part of a recovery phase that could reach 0.5775.’ Our view will be invalidated if NZD breaks below 0.5660 (‘strong support’ level was at 0.5640 yesterday).”

usdchef

Pound Sterling gains further against US Dollar ahead of US NFP report

The Pound Sterling (GBP) refreshes an almost four-month high near 1.2930 against the US Dollar (USD) in the European trading session on Friday. The GBP/USD pair exhibits strength ahead of the United States (US) Nonfarm Payrolls (NFP) report for February, which will be published at 13:30 GMT.

Investors will pay close attention to the US official employment report as it will influence market expectations for the Federal Reserve’s (Fed) monetary policy outlook. Economists expect the US economy to have added 160K fresh workers, higher than 143K recorded in January. The Unemployment Rate is seen steady at 4%.

Market participants will also focus on the US Average Hourly Earnings data, a key measure of wage growth, which is anticipated to have risen steadily by 4.1% year-over-year. On month, the wage growth measure is estimated to have grown by 0.3%, slower than the 0.5% growth seen in January.

Signs of strong labor demand and wage growth momentum would boost expectations that the Fed will keep interest rates in the current range of 4.25%-4.50% for longer. On the contrary, soft numbers would diminish them. According to the CME FedWatch tool, the central bank is almost certain to keep borrowing rates unchanged in the March meeting, but there is a 50% chance that it could cut them in May.

On Thursday, Atlanta Fed Bank President Raphael Bostic said at an event hosted by the Birmingham Business Journal that interest rates should stay in their current range before late spring or summer amid uncertainty over the economy due to US President Donald Trump’s economic agenda. Bostic warned that Trump’s tariffs could fuel inflationary pressures.

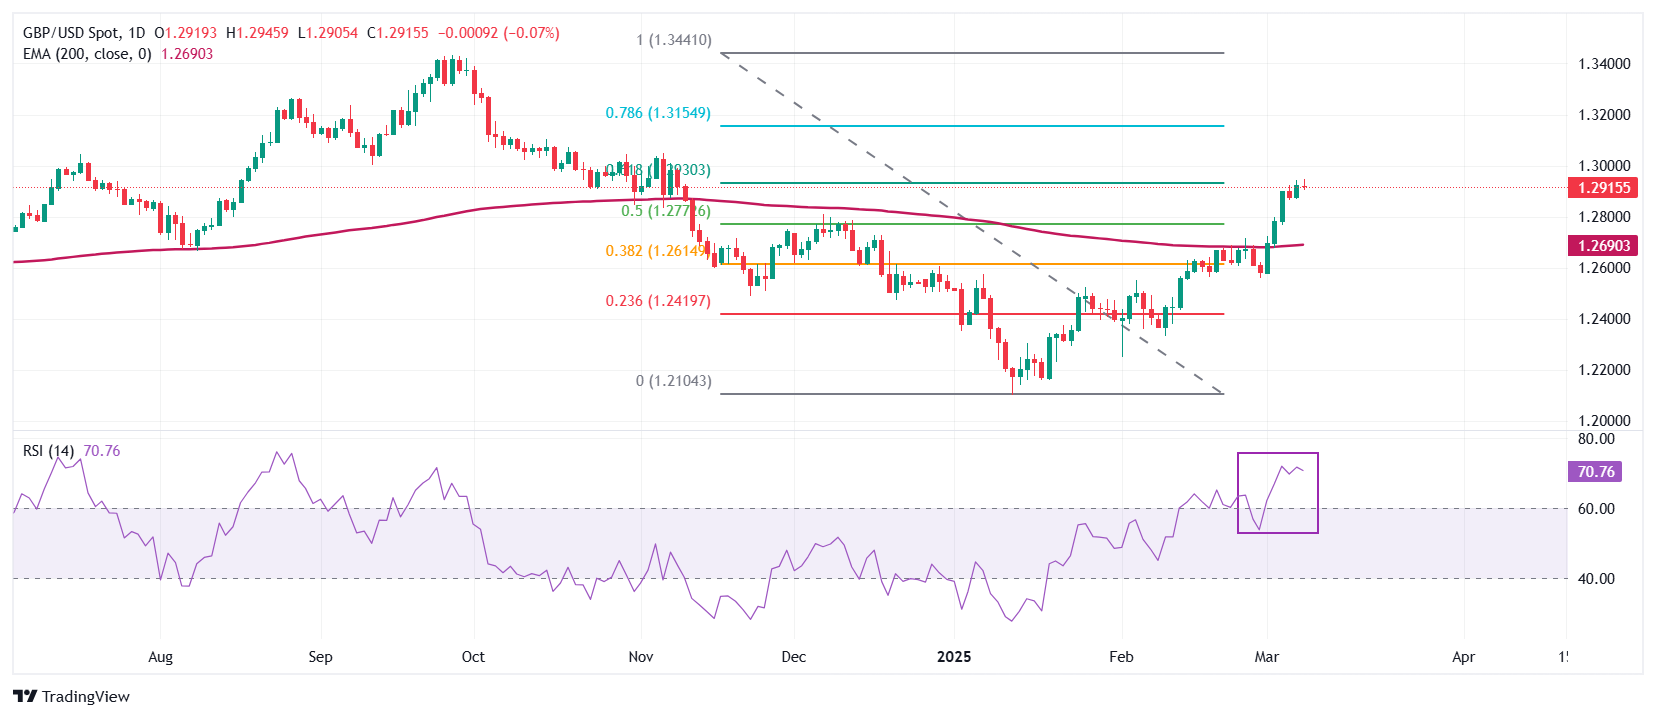
Technical Analysis: Pound Sterling aims to break above above 61.8% Fibo retracement at 1.2930

The Pound Sterling gathers strength to break above the 61.8% Fibonacci retracement plotted from the late September high to mid-January low around 1.2930 on Friday. The long-term outlook of the GBP/USD pair has turned bullish as it holds above the 200-day Exponential Moving Average (EMA), which is around 1.2688.

The 14-day Relative Strength Index (RSI) climbs above 60.00, suggesting a strong bullish momentum.

Looking down, the 50% Fibo retracement at 1.2767 and the 38.2% Fibo retracement at 1.2608 will act as key support zones for the pair. On the upside, the psychological 1.3000 level will act as a key resistance zone.

EUR/USD advances as US Dollar slumps ahead of US NFP

EUR/USD advances as US Dollar slumps ahead of US NFP

EUR/USD jumps above 1.0850 in Friday’s European session and revisits a four-month high. The major currency pair exhibits strength as the US Dollar (USD) weakens ahead of the United States (US) Nonfarm Payrolls (NFP) data for February, which will be published at 13:30 GMT. The US Dollar Index (DXY), which tracks the Greenback’s value against six major currencies, extends its losing streak for the fifth trading day and slumps to a four-month low of around 103.60.

The Greenback has remained on the backfoot as investors have become increasingly concerned over the United States (US) economic outlook due to uncertainty over President Donald Trump’s tariff agenda. Market participants believe that the pressure of higher tariffs will be borne by US importers, who would pass on the impact to consumers. Such a scenario would diminish their purchasing power and, eventually, the domestic demand.

On Thursday, Trump announced tariff relaxations on a number of products, which come under the purview of the United States-Mexico-Canada Agreement (USMCA) until April 2, the same day when he is expected to introduce reciprocal tariffs. The US President imposed 25% levies on Canada and Mexico on Tuesday but provided a one-month exemption on automobiles after discussing with the big three US carmakers on Wednesday.

The US NFP report is expected to show that the economy added 160K fresh workers, higher than the 143K recorded in January. The Unemployment Rate is seen steady at 4%. Meanwhile, Average Hourly Earnings, a key measure of wage growth, is anticipated to have risen steadily by 4.1% year-on-year. Month-on-month wage growth measure is estimated to have grown at a slower pace of 0.3%, compared to 0.5% in January. The official labor market data will significantly influence market expectations for the Federal Reserve’s (Fed) monetary policy outlook.

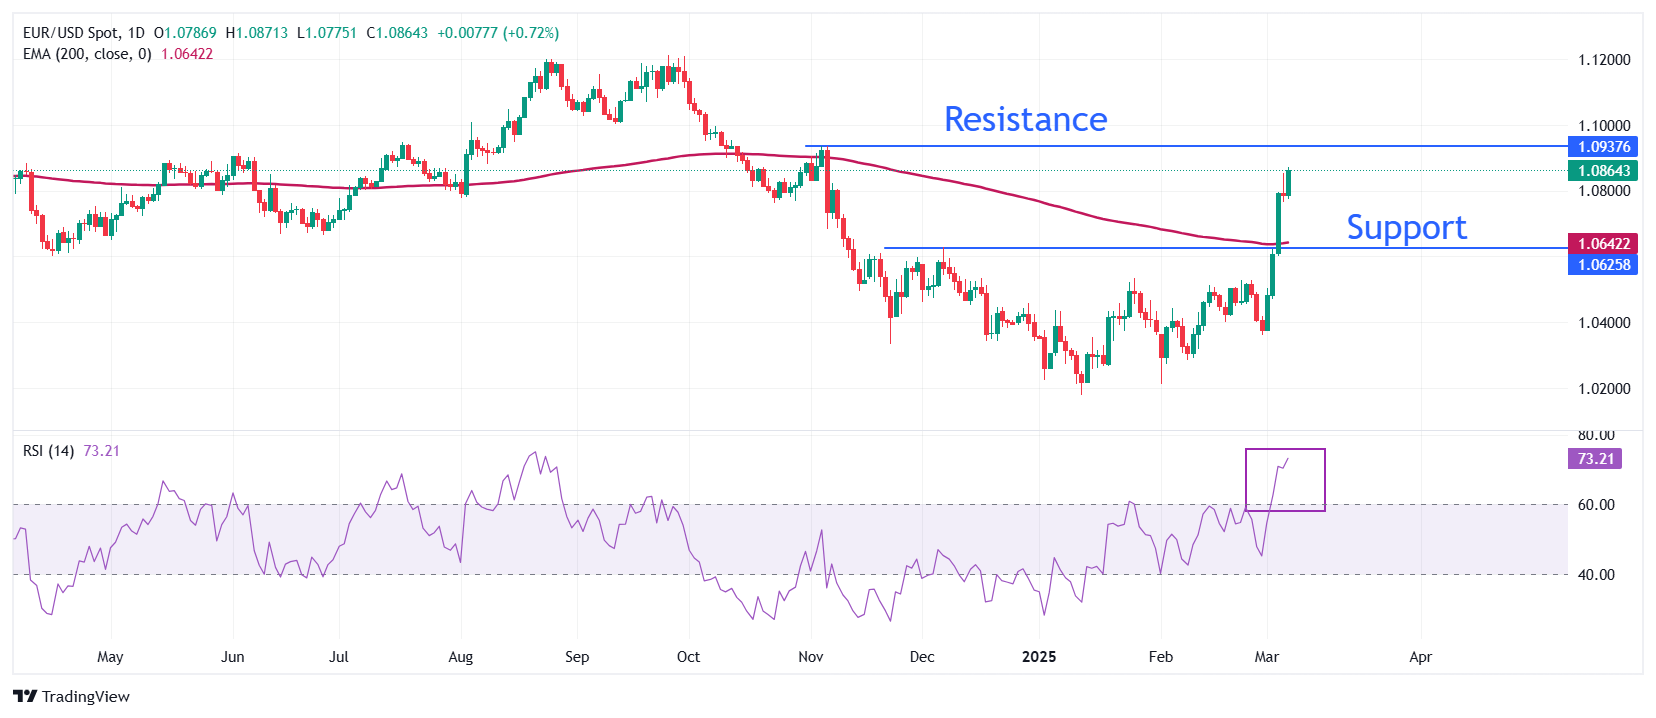
Technical Analysis: EUR/USD rallies above 1.0850

EUR/USD surges to over 1.0850 on Friday after a decisive breakout above the December 6 high of 1.0630 earlier this week. The long-term outlook of the major currency pair is bullish as it holds above the 200-day Exponential Moving Average (EMA), which trades around 1.0640.

The 14-day Relative Strength Index (RSI) jumps above 70.00, indicating a strong bullish momentum.

Looking down, the December 6 high of 1.0630 will act as the major support zone for the pair. Conversely, the November 6 high of 1.0937 and the psychological level of 1.1000 will be key barriers for the Euro bulls.

gold-bar-and-dollar-bills-42586628_XtraLarge

Gold consolidates further while weekly gains look to be set

Gold’s price (XAU/USD) ticks up slightly and consolidates for the third day in a row this week. The rally in Bullion stalls after US President Donald Trump shielded off all goods from Mexico and Canada that fall under the USMCA trade agreement from its freshly baked tariffs that got implemented earlier this week. Meanwhile, US equity markets trade below where they were on President Trump’s inauguration day.

On the rates side, traders got some support from Federal Reserve (Fed) official Christopher Waller, who said on Thursday that he wouldn’t support lowering interest rates in March but sees room to cut two, or possibly three, times this year. This coincides with what markets expected, with June being the first pivotal moment for the Fed to cut interest rates this year.

Technical Analysis: Small pause

Bets on interest rate cuts by the Federal Reserve are now starting to get support from the central bank’s policymakers. This should support Gold’s price throughout the year, though it might not be enough to push Gold to fresh all-time highs for now. For that, a fresh catalyst, such as new tariffs or another page in the trade war book, would need to occur.

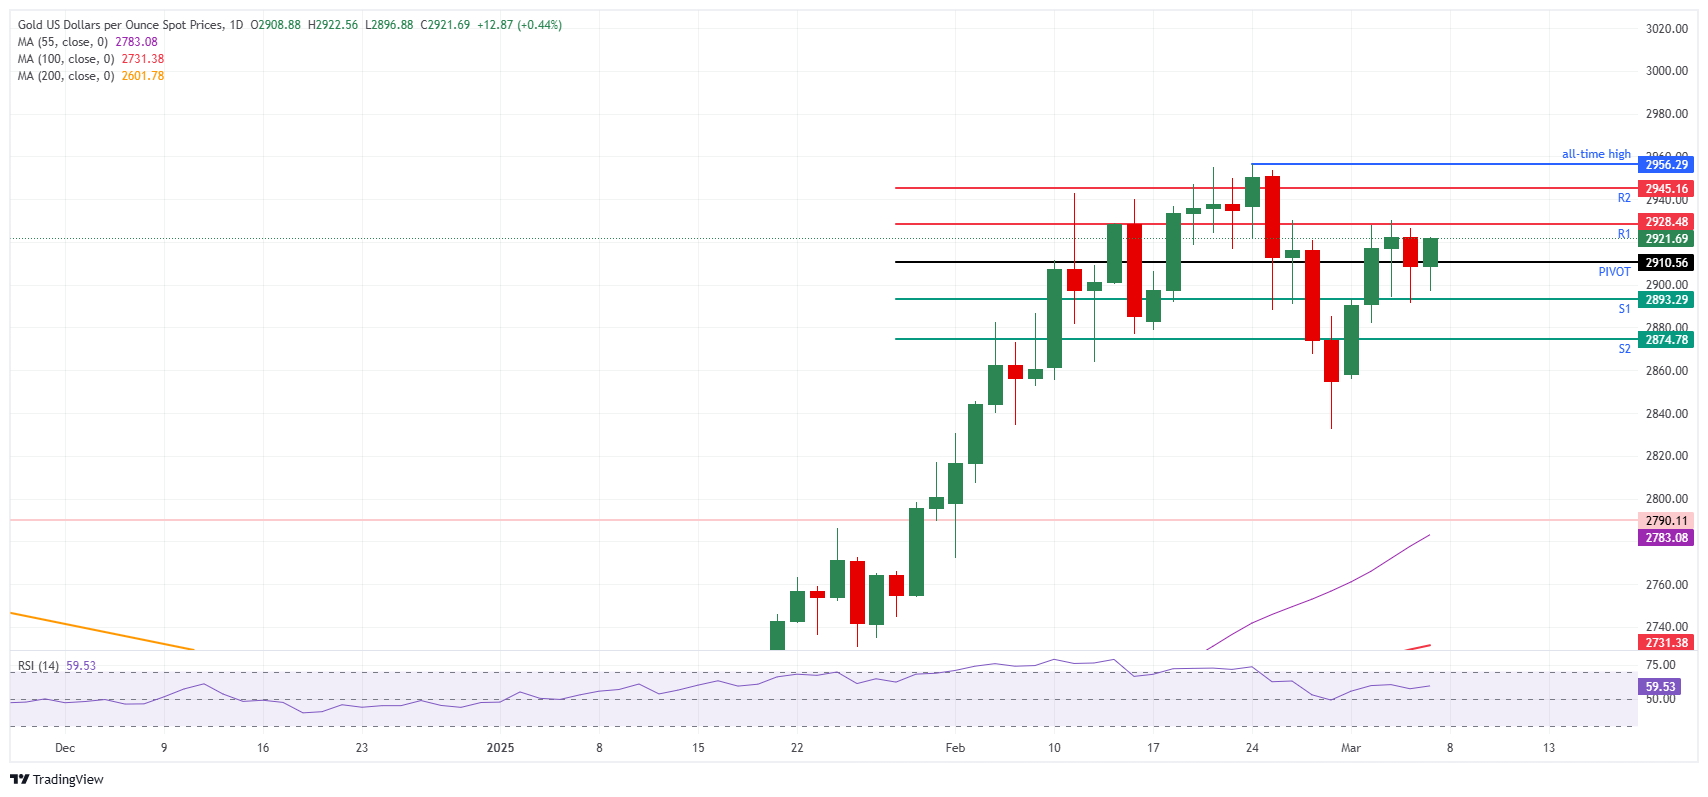
While Gold trades near $2,917 at the time of writing, the daily Pivot Point at $2,910 and the daily R1 resistance at $2,928 are the key levels to watch for on Friday. In case Gold sees more inflows, the daily R2 resistance at $2,945 will possibly be the final cap ahead of the all-time high of $2,956 reached on February 24.

On the downside, the $2,900 psychological big figure and the S1 support at $2,893 acts as a double support barrier. If Bullion bulls want to avoid another leg lower, that zone must hold. Further down, the daily S2 support at $2,874 should be able to catch any additional downside pressure.

XAU/USD: Daily Chart

XAU/USD: Daily Chart