Gold Prices Bounce Likely Short-Lived As US Rates, China Import Move Both Weigh

Gold Prices Bounce Likely Short-Lived As US Rates, China Import Move Both Weigh

Gold Prices managed a little bounce in Friday’s European trade but remain on course for their worst monthly showing since February of this year as a range of fundamental and technical factors make life very tough for the bulls.

As always these days, the most obvious of those factors is monetary. United States interest rates are set to remain ‘higher for longer’ as the Federal Reserve battles inflation. The latest data suggest it seems to be winning the fight, but there’s no sign of any premature retreat from the field. Indeed, the markets’ base case is that rates will rise by another quarter-percentage-point this year and probably remain above 5% for all of next.

Other central banks are also apparently set to keep their benchmark rates around current levels. Given that, it’s not difficult to find some comparatively tempting risk-free yields in the government bond markets. Of course holding gold yields you nothing, and usually incurs costs, so it’s not hard to see why investors might exit their metal holdings in favor of paper.

The general strength of the US Dollar has been a great feature of the foreign exchange market this year. But that very strength makes Dollar-denominated gold and gold proxies more expensive for those forced to buy them with other currencies.

China Acts To Curb Local Gold Premium

There was some more bad news for gold on Friday as Beijing reportedly opened the door to more gold imports. That move saw Chinese gold prices fall the most in one day since 2020 as the premium on an ounce of gold in China slipped dramatically. From as high as $120 per ounce, that premium slipped to $10. Chinese investors have been very keen to hold gold in the face of strong, specific headwinds in other domestic investment markets- most notably real-estate which had been a previously enticing investment option.

As these headwinds aren’t abating, China looks likely to remain a bright spot for the gold market, but Beijing’s actions have certainly dimmed that light a bit.

Another bright spot could be further signs that inflation in the US is relaxing its grip. Should those start to see intertest-rate forecasts reassessed, and the possible timing of rate cuts brought forward, gold would likely stand to benefit.

The markets will get another important look at US price pressures later in the session with the release of August inflation numbers in the Personal Consumption and Expenditure series. This is known to be one of the Fed’s own preferred indicators, so it will surely draw a crowd.

Gold Prices Technical Analysis
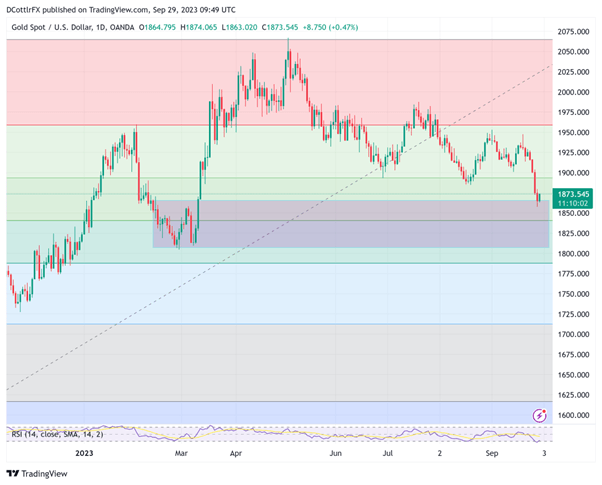
Chart Compiled Using TradingView

A broad meander lower from May’s peaks well above the psychological $2000 mark has become something more urgent in the last two weeks, with gold sliding below the 200-day moving average which had been very closely watched.

Even so, prices are still slightly higher than they were at the start of this year, even if that state doesn’t seem very likely to last. The last three days’ heavy declines have seen support give way at the last significant low, which was August 21’s intraday low of $1884.52.

Prices have also fallen below the second Fibonacci retracement of the rise up to those May peaks from the lows of November last year. That came in at $1893.52, and was broken below on Wednesday. Focus is now back on the broad trading band from the period between February 10 and March 9 into which prices have now retreated. That contains the third retracement at $1840.66, which may struggle to contain the bears in the event that key support around $1850 decisively gives way

Oil Prices Forecast: WTI Surges Amid Tight Supplies & Chinese Demand

Oil Prices Forecast: WTI Surges Amid Tight Supplies & Chinese Demand

Overview

Oil prices witnessed a 2% weekly surge, buoyed by robust holiday demand from China and tight U.S. supply, even as the market speculates on potential supply increments from Saudi Arabia.

Chinese Demand Surge

China’s Golden Week holiday, which started on Friday, has fueled an uptick in oil prices. The boost is attributed to both international and domestic travel. Recent data reveals that the daily flights booked domestically for this year’s Golden Week have increased by 20% compared to 2019 figures, pre-COVID era. Additionally, with the stabilization signs in China’s factory activity as per recent polls, the world’s second-largest economy is likely to experience an uptick in oil demand, reinforcing the bullish sentiment.

Trading Derivatives carries a high level of risk to your capital and you should only trade with money you can afford to lose. Trading Derivatives may not be suitable for all investors, so please ensure that you fully understand the risks involved, and seek independent advice if necessary. A Product Disclosure Statement (PDS) can be obtained either from this website or on request from our offices and should be considered before entering into a transaction with us. Raw Spread accounts offer spreads from 0.0 pips with a commission charge of USD $3.50 per 100k traded. Standard account offer spreads from 1 pips with no additional commission charges. Spreads on CFD indices start at 0.4 points. The information on this site is not directed at residents in any country or jurisdiction where such distribution or use would be contrary to local law or regulation.

U.S. Fundamentals & Market Dynamics

The U.S. has exhibited consistent economic growth, suggesting sustained fuel demand. Simultaneously, tight U.S. supplies, especially with Cushing storage at its lowest since July 2022, offer price support. Notably, with U.S. oil production expected to decelerate, a potential market deficit of over 2mb/d might emerge in the final quarter, given the global demand of 103mb/d.

OPEC+ Anticipation

All eyes are set on the upcoming OPEC+ meeting, scheduled for Oct. 4, for cues on Saudi Arabia’s potential move to enhance oil supply. The recent near-30% price spike this quarter raises speculation on early easing of cuts, particularly by Saudi Arabia.

Short-Term Forecast

Given the current demand-supply dynamics, the market sentiment leans bullish. However, traders are cautious, considering the overbought market scenario and the pivotal OPEC+ meeting’s impending outcome.

Technical Analysis

Daily Light Crude Oil FuturesThe current Daily price of Light Crude Oil Futures stands at $91.73, marginally above its previous close of $91.71. When evaluated against the 200-Day moving average of $77.30, it is trading significantly higher, showcasing a prevailing bullish momentum. This sentiment is further reinforced when comparing it to the 50-Day moving average of $84.25.

The 14-Day RSI reading of 66.48, while leaning towards the overbought territory, still reflects a strong momentum.

In terms of support and resistance, the commodity is trading between the minor support level of $88.21 and minor resistance at $92.49. Given these metrics, the current market sentiment leans bullish for Light Crude Oil Futures.

DAX Index: U.S. and Eurozone Data Propel DAX Stocks; What’s Next?

DAX Index: U.S. and Eurozone Data Propel DAX Stocks; What’s Next?

DAX Thursday Overview

On Thursday, the DAX gained 0.70%. Reversing a 0.25% loss from Wednesday, the DAX ended the day at 15,324.

Crude Oil and US Treasury Yields Offer Respite

On Thursday, the European markets ignored a slump in the Hang Seng Index and the Nikkei. After a pre-European session spike, falling US Treasury yields and a pullback in crude oil prices supported buyer appetite.

Trading Derivatives carries a high level of risk to your capital and you should only trade with money you can afford to lose. Trading Derivatives may not be suitable for all investors, so please ensure that you fully understand the risks involved, and seek independent advice if necessary. A Product Disclosure Statement (PDS) can be obtained either from this website or on request from our offices and should be considered before entering into a transaction with us. Raw Spread accounts offer spreads from 0.0 pips with a commission charge of USD $3.50 per 100k traded. Standard account offer spreads from 1 pips with no additional commission charges. Spreads on CFD indices start at 0.4 points. The information on this site is not directed at residents in any country or jurisdiction where such distribution or use would be contrary to local law or regulation.

Investors also responded favorably to softer-than-expected German inflation numbers.

However, US jobless claims beat forecasts, pushing 10-year US Treasury yields to a session high before reversing. US GDP numbers for Q2 also supported the brief spike in yields. The US economy expanded by 2.1% in the second quarter.

The US equity markets responded to the economic indicators, falling crude oil prices, and the pullback in US Treasury yields.

On Thursday, the NASDAQ Composite Index gained 0.83%. The S&P 500 and the Dow ended the day up 0.59% and 0.35%, respectively.

The Thursday Market Movers

Tech and auto stocks rose on the pullback in US Treasury yields and softer German inflation figures.

MTU Aero led the way, jumping 3.85%, and Infineon Technologies ended the session up 1.93%.

Continental AG rallied 2.74%, with Daimler Truck Holding gaining 1.59%.

Eurozone Inflation

German retail sales and unemployment figures will garner interest early in the Friday session. A pickup in retail sales and steady unemployment numbers may offer early support.

However, Eurozone inflation figures must align with the German inflation numbers from Thursday. Hotter-than-expected Eurozone inflation figures would spook investors before the US session.

Economists forecast the core annual inflation rate to soften from 5.3% to 4.8% in September.

With inflation in the spotlight, ECB President Christine Lagarde is on the calendar to speak today. A reiteration of higher for longer would need consideration but shouldn’t surprise the markets.

While economic indicators will provide direction, crude oil prices and government bond yields need monitoring. An upswing in crude oil prices and government bond yields will likely test buyer appetite.

US Core PCE Price Index and Personal Spending in Focus

After the better-than-expected labor market numbers on Thursday, the focus will shift to the Personal Income & Outlays report.

Sticky inflation, a pickup in consumption, and an uptrend in personal income may fuel bets on a December Fed rate hike. US Treasury yield responses to the numbers will likely dictate the direction of the DAX.

Economists forecast personal income to rise by 0.4% in August (July: +0.2%). However, economists predict the Core PCE Price Index to increase by 3.9% year-over-year (July: +4.2%) and personal spending to rise by 0.4% (July: +0.8%).

The DAX and NASDAQ mini were up 40 and 24 points this morning.

Short-Term Forecast

Near-term trends hinge on the Eurozone and US inflation figures out today. Softer inflation numbers will likely support a pullback in government bond yields. However, investors must consider further spikes in crude oil prices, which would test the appetite for riskier assets.

DAX Technical Indicators

Daily Chart

The DAX remained below the 50-day and 200-day EMAs, affirming bearish price signals. A break below the 15,245 support level would give the bears a look at the 15,058 support level.

Hotter-than-expected Eurozone and US inflation numbers will likely weigh on DAX stocks.

However, a DAX rise to 15,400 would support a move to the 15,459 resistance level and the 200-day EMA. Selling pressure will intensify in the 15,450 – 15,460 range. The 200-day EMA is confluent with the 15,459 resistance level.

The 14-Daily RSI reading of 36.79 indicates a DAX fall through the 15,245 support level before entering oversold territory.

DAX Daily Chart sends bearish price signals.
DAX 290923 Daily Chart

4-Hourly Chart

The DAX, remaining below the 50-day and 200-day EMAs, reaffirms bearish price signals. A DAX fall through the 15,245 support level would bring the 15,058 support level into view.

However, a DAX return to 15,400 would support a break above the 15,459 resistance level to target 15,500.

The 38.63 RSI reading supports a DAX fall through the 15,245 support level before reentering the oversold territory.

4-Hourly Chart affirms bearish price signals.
DAX 290923 4-Hourly Chart
DAX Index, FTSE 100, STOXX 600: Equities Higher as Investors Await Euro Zone Inflation Data

DAX Index, FTSE 100, STOXX 600: Equities Higher as Investors Await Euro Zone Inflation Data

European Markets Respond to Inflation and Sectoral Shifts

European equities experienced a boost this Friday, buoyed by strong performances in the luxury and tech sectors. The close of a tumultuous quarter has seen investors keenly eyeing critical economic data, notably from Germany and France. Despite the gains, the STOXX 600 is on track to shed nearly 2% this quarter, and Germany’s DAX faces a sharper decline.

Central to this quarter’s narrative are Germany’s lackluster retail figures for August, impacted by mounting inflation. Contrasting this, France’s inflation pressures eased unexpectedly in September. As the day progressed, market analysts keenly await the Eurozone’s inflation data, which could further illuminate the ECB’s future strategy.

Trading Derivatives carries a high level of risk to your capital and you should only trade with money you can afford to lose. Trading Derivatives may not be suitable for all investors, so please ensure that you fully understand the risks involved, and seek independent advice if necessary. A Product Disclosure Statement (PDS) can be obtained either from this website or on request from our offices and should be considered before entering into a transaction with us. Raw Spread accounts offer spreads from 0.0 pips with a commission charge of USD $3.50 per 100k traded. Standard account offer spreads from 1 pips with no additional commission charges. Spreads on CFD indices start at 0.4 points. The information on this site is not directed at residents in any country or jurisdiction where such distribution or use would be contrary to local law or regulation.

In the corporate arena, luxury giants like LVMH and Richemont registered significant gains, propelling early trading. Furthermore, Adidas’ stock performance, encouraged by Nike’s robust earnings report, painted an optimistic picture. The tech sector, having grappled with concerns over prolonged high-interest rates, witnessed a rebound, offering a silver lining to its quarterly narrative.

Across the Channel, the UK basked in positive sentiment. Friday’s economic data revision underscored Britain’s commendable post-pandemic recovery, outpacing European mainstays Germany and France. With sectors such as consumer staples leading the rally, and strategic corporate moves like those from Aston Martin and Severn Trent shaping market sentiment, the UK’s resilience seems to shine in an otherwise mixed European scenario.

DAX Index Technical Analysis

The DAX Index, presently priced at 15443.60, sits below both the 50-Day and 200-Day moving averages, positioned at 15807.70 and 15578.58 respectively, indicating a bearish short-term sentiment.The 14-Day RSI stands at 42.28, suggesting a weakened momentum but not yet in oversold territory. In terms of support and resistance levels, the DAX is currently nestled between minor support at 15264.23 and minor resistance at 15472.44.

Given these technical observations, the DAX Index portrays a short-term bearish sentiment, as it remains constricted below pivotal moving averages.

FTSE 100 Technical Analysis

In the latest assessment of the FTSE 100, the index currently stands slightly above its 50-Day moving average of 7535.99 and is just shy of the 200-Day moving average, positioned at 7640.39.The 14-Day RSI, clocking in at 58.75, indicates moderately strengthened momentum but hasn’t yet ventured into overbought territory.

While there’s no explicit trend line support mentioned, the FTSE 100 is nudging close to the trend line resistance of 7703.55. Navigating between minor and main resistance levels, the index portrays a bullish tilt. Given these technical readings and its proximity to key resistances, the market sentiment leans bullish for the FTSE 100 in the short term.

Eurostat Reports: Eurozone Faces Sharp Inflation Decline in September

Eurostat Reports: Eurozone Faces Sharp Inflation Decline in September

Eurozone Inflation Slows in September 2023

In a notable downturn, Eurozone’s annual inflation rate is projected to decrease to 4.3% in September 2023, a significant drop from August’s 5.2%. This recent data stems from a preliminary report by Eurostat, the European Union’s chief statistical authority.

Diving into the inflation’s primary components, the food, alcohol, and tobacco segment is anticipated to record the steepest yearly rate in September, standing at 8.8%, albeit lower than the previous month’s 9.7%. The services sector follows closely, projected at 4.7%, down from August’s 5.5%. Similarly, the non-energy industrial goods category is estimated at 4.2%, falling from 4.7% in the preceding month. Contrastingly, the energy sector depicts a decline of 4.7%, a steeper drop compared to August’s 3.3%.

Both the Core CPI Flash Estimate y/y and the broader CPI Flash Estimate y/y underperformed, falling short of pre-report forecasts. This downward trend suggests cooling economic pressures in the Eurozone.

Conclusively, the slowdown in the inflation rate, particularly in pivotal sectors, indicates a potential easing of economic heat. For investors and policymakers alike, these figures could signal a shift in the Eurozone’s financial landscape, leaning towards a more bearish short-term outlook.

Silver Prices Forecast: Strong Short-covering Rally Ahead of US PCE Data

Silver Prices Forecast: Strong Short-covering Rally Ahead of US PCE Data

Silver’s Interest Rate Dilemma

Silver (XAG/USD) is soaring on Friday. Nonetheless, the market remains in a position to post its most dramatic monthly decline since February, primarily due to the looming prospect of enduring high interest rates. This anticipation builds up as market players await an important U.S. inflation metric, expected later today.

The Dollar, Treasury Yields, and Fed’s Messaging

The XAG/USD trajectory points toward a monthly slump, concurrent with the dollar and 10-year Treasury yields aiming for their most commendable quarterly results in four years. Silver traders are keenly attuned to the Federal Reserve’s communication hinting at a protracted rate stability. Richmond Fed’s President, Thomas Barkin, recently highlighted the uncertainty surrounding future monetary policy shifts.

Trading Derivatives carries a high level of risk to your capital and you should only trade with money you can afford to lose. Trading Derivatives may not be suitable for all investors, so please ensure that you fully understand the risks involved, and seek independent advice if necessary. A Product Disclosure Statement (PDS) can be obtained either from this website or on request from our offices and should be considered before entering into a transaction with us. Raw Spread accounts offer spreads from 0.0 pips with a commission charge of USD $3.50 per 100k traded. Standard account offer spreads from 1 pips with no additional commission charges. Spreads on CFD indices start at 0.4 points. The information on this site is not directed at residents in any country or jurisdiction where such distribution or use would be contrary to local law or regulation.


Economic Data and Inflation Outlook

Recent data underscores the U.S. economy’s unwavering growth momentum in Q2. Market strategists are bracing for the August personal consumption expenditures (PCE) price index – the Fed’s favored inflation yardstick. The overarching investor sentiment revolves around understanding the economic health and the potential trajectory for interest rates. Notably, Neel Kashkari of Minneapolis Fed conveyed his uncertainty on whether the current rate adjustments are sufficient to counter inflation effectively.

Short-Term Silver Outlook

For silver to surpass the $24.00 benchmark, a combination of a subdued dollar and relaxed bond yields is vital. However, given current market dynamics, such a positive twist seems distant.

Technical Analysis

Daily Silver XAG/USDSilver’s (XAG/USD) current predicament in the financial market landscape hinges on several technical indicators.

The metal’s daily price of 23.03 is precisely at its minor support level and has marginally surpassed its recent closing price, indicating a mild upward momentum. However, the current valuation coincides with the 50-Day moving average of 23.46, highlighting a neutral stance.

The 14-Day RSI stands at 46.93, suggesting a slightly weakened momentum.

Notably, with the current price closer to the trend line support of 22.32 than the resistance of 24.83, downside risks seem evident. Given these dynamics, the market sentiment for Silver currently leans bearish.

Gold Prices Forecast: XAU/USD Faces Headwinds Amid Rising Interest Rates

Gold Prices Forecast: XAU/USD Faces Headwinds Amid Rising Interest Rates

Gold’s Prospective Decline Amid Interest Rate Shifts

Gold (XAU/USD) remains steady, teetering on the edge of its most significant monthly drop since February, primarily influenced by the anticipation of prolonged higher interest rates. This sentiment comes ahead of a crucial U.S. inflation report expected later today.

Spot Gold and U.S. Futures

As of 06:40 GMT, spot gold was priced at $1,869.40 per ounce. In contrast, U.S. gold futures witnessed a slight increase, rising by 0.42% to stand at $1,886.00. This movement places gold on the path to experience nearly a 4% decrease for the month.

Trading Derivatives carries a high level of risk to your capital and you should only trade with money you can afford to lose. Trading Derivatives may not be suitable for all investors, so please ensure that you fully understand the risks involved, and seek independent advice if necessary. A Product Disclosure Statement (PDS) can be obtained either from this website or on request from our offices and should be considered before entering into a transaction with us. Raw Spread accounts offer spreads from 0.0 pips with a commission charge of USD $3.50 per 100k traded. Standard account offer spreads from 1 pips with no additional commission charges. Spreads on CFD indices start at 0.4 points. The information on this site is not directed at residents in any country or jurisdiction where such distribution or use would be contrary to local law or regulation.

Dollar, Treasury Yields, and Fed’s Messaging

The dollar and 10-year Treasury yields are steering towards their most impressive quarters in the last four years. The gold market’s response reflects its reception of the Federal Reserve’s indication of extended rate plateaus. Richmond Fed’s President, Thomas Barkin, further added ambiguity by hinting at the uncertainty of monetary policy shifts in the upcoming months.

Economic Growth and Inflation Expectations

Recent data highlighted the U.S. economy’s consistent growth rate in the previous quarter. The financial markets are now aligning their strategies in anticipation of the Fed’s upcoming inflation metric – the August PCE price index.

Short-Term Gold Outlook

For gold to ascend past the $1,900 mark, a combination of a weaker dollar, reduced bond yields, and potentially disappointing inflation results would be necessary. However, given the current financial landscape, such an upward shift seems improbable.

Technical Analysis

Daily Gold XAU/USDGold’s (XAU/USD) current daily price of 1870.16 sits below both its 200-Day and 50-Day moving averages, indicating a potential bearish momentum.

The 14-Day RSI at 30.75 confirms this sentiment, hinting at an oversold market.

With the daily price below the minor support of 1889.37 , there’s a tangible risk of further declines.  Additionally, trend line support is positioned at 1912.41, acting as a critical threshold. Considering these metrics, the prevailing sentiment leans bearish for Gold.

UK GDP Report Offered Relief, with the UK Economy Growing by 0.2% in Q2

UK GDP Report Offered Relief, with the UK Economy Growing by 0.2% in Q2

UK GDP

The UK GDP report drew investor interest this morning. Downward revisions to the UK GDP numbers would fuel fears of a deep and prolonged UK economic recession.

The UK economy grew by 0.2% in the second quarter, consistent with the preliminary estimate of 0.2%. In the first quarter, the economy expanded by 0.3%. Year-over-year, the economy grew by 0.6%, up from a prelim 0.4% and 0.2% growth in the first quarter.

According to the Office for National Statistics,

  • A 1.2% increase in production contributed to the pickup in economic activity.
  • However, the household saving ratio jumped by 9.1% compared with a 7.1% increase in the first quarter. Social benefits, with rising salaries and wages, supported the uptick.
  • As a result, household disposable incomes increased by 1.2% after remaining flat in the previous quarter.
  • In the second quarter, the UK GDP is 1.8% above pre-COVID-19 pandemic levels.
  • While the production sector contributed to growth, the services sector showed no growth in the second quarter.
  • However, consumer-facing services grew by 0.9%.
  • Household consumption increased by 0.5%, softer than 0.7% in the first quarter.

The second quarter GDP figures will likely offer relief. However, recent UK economic indicators signal a more marked deterioration in the UK economy than previously anticipated.

The negative economic outlook may leave the Bank of England in a holding pattern. Notably, Monetary Policy Committee members will likely want to see the effects of rate hikes wash through the economy before deciding on the next move.

GBP/USD Reaction to the UK GDP Report

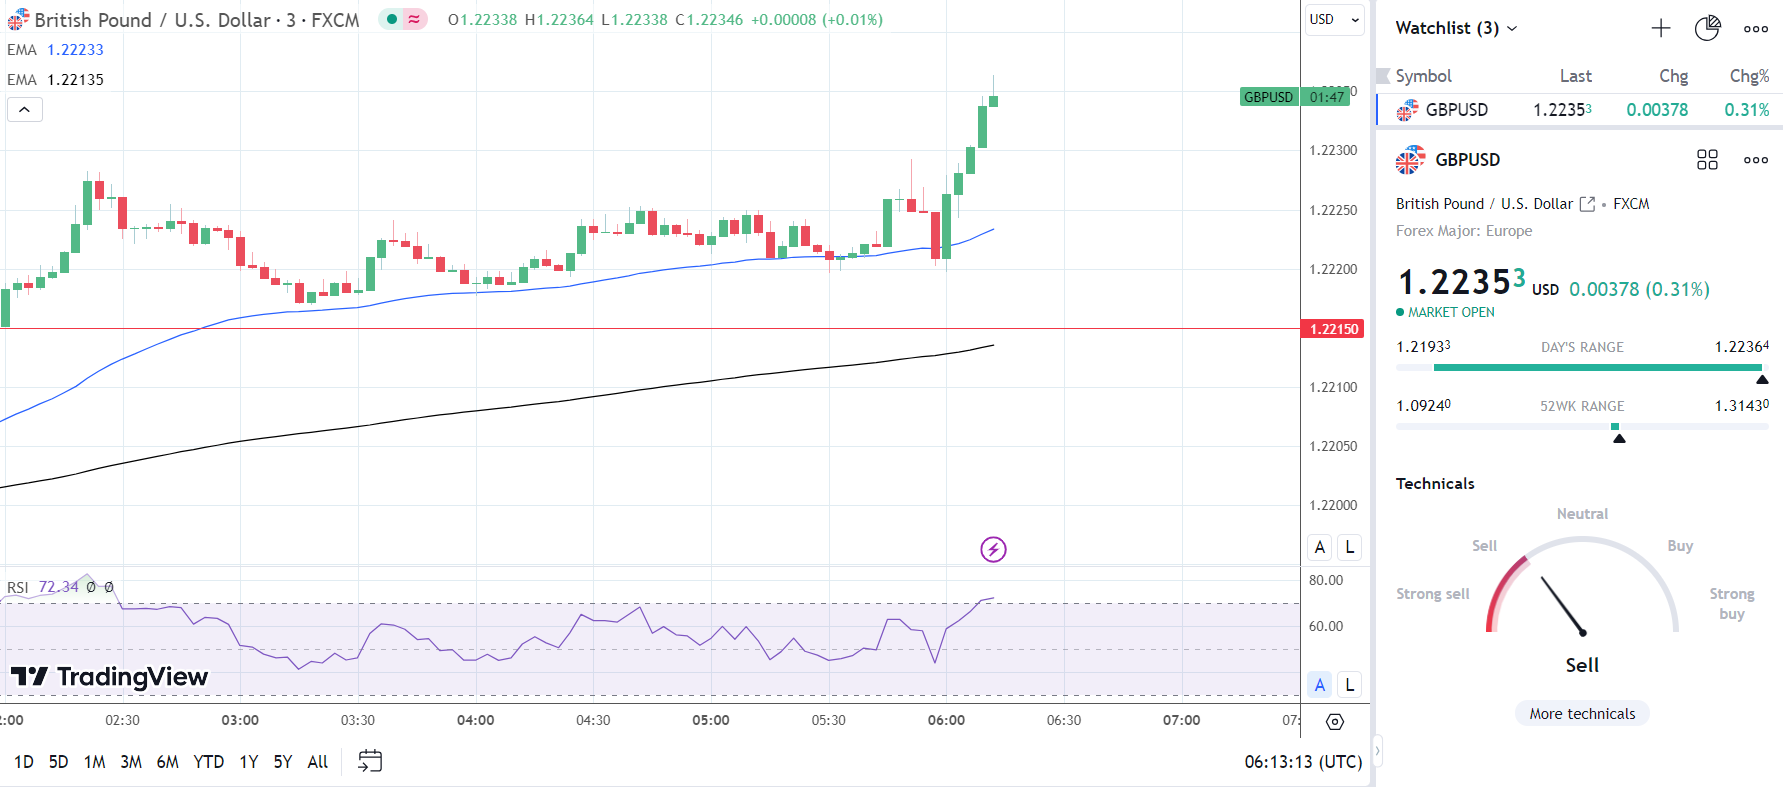
Before the UK GDP Report, the GBP/USD fell to a low of $1.21933 before rising to a pre-stat high of 1.22283.

However, in response to the UK GDP Report, the GBP/USD slipped to a post-stat low of $1.22197 before reaching a high of $1.22364.

This morning, the GBP/USD was up 0.31% to $1.22353.

GBP/USD bounces on UK GDP Report.
290923 GBPUSD 3 Minite Chart

Up Next: The US Personal Income & Overlays

Later today, US inflation and personal spending will likely influence investor sentiment toward the Fed rate path.

Softer-than-forecasted Core PCE Price Index and personal spending figures may ease bets on further Fed rate hikes. However, an upward swing in personal income could signal a positive outlook on consumption.

Economists forecast the Core PCE Price Index to increase by 3.9% year-over-year in August versus 4.2% in July.

Significantly, economists predict personal spending to increase by 0.4% (July: +0.8%) and personal income to rise by 0.4% (July: +0.2%).

Australian Dollar Update: AUD/USD, AUD/JPY Soar but is There Enough Momentum to Sustain?

Australian Dollar Update: AUD/USD, AUD/JPY Soar but is There Enough Momentum to Sustain?

AUD/USD – Daily Chart

Recent performance in the Australian Dollar against the US Dollar and Japanese Yen is setting up an interesting technical landscape. On the daily chart below, AUD/USD surged on Thursday, leaving behind a Bullish Engulfing candlestick pattern. This can at times function as a reversal signal, but further confirmation from here is likely needed.

The pattern emerged as prices were unable to confirm a breakout under the 78.6% Fibonacci retracement level of 0.6382. On top of this, positive RSI divergence had been persisting, showing that downside momentum has been fading. As such, while early, there seems to be early indications of a reversal. But, confirmation is needed.

Keep a close eye on the 50-day Moving Average. The latter may hold as resistance, pivoting prices lower. Otherwise, breaking lower opens the door to facing the November low of 0.6272.

image1.png

AUD/JPY – Daily Chart

Meanwhile, the Australian Dollar is also pushing higher against the Japanese Yen. Not long ago, AUD/JPY confirmed a breakout above a Symmetrical Triangle chart formation. That opened the door to extending the dominant uptrend since earlier this year.

Now, prices are facing the 14.6% Fibonacci retracement level at 95.97 as immediate resistance. Negative RSI divergence is present though, showing that upside momentum is fading. That can precede a turn lower.

Such an outcome would place the focus on immediate support, which seems to be the 23.6% level at 94.93. Otherwise, continuing higher places the focus on revisiting the current 2023 peak of 97.67.

image2.png


EUR/GBP IG Client Sentiment: Our data shows traders are now net-long EUR/GBP for the first time since Sep 21, 2023 10:00 GMT when EUR/GBP traded near 0.87.

EUR/GBP IG Client Sentiment: Our data shows traders are now net-long EUR/GBP for the first time since Sep 21, 2023 10:00 GMT when EUR/GBP traded near 0.87.

EUR/GBP: Retail trader data shows 50.15% of traders are net-long with the ratio of traders long to short at 1.01 to 1. In fact, traders have remained net-long since Sep 21 when EUR/GBP traded near 0.87, price has moved 0.20% lower since then. The number of traders net-long is 1.22% higher than yesterday and 9.21% higher from last week, while the number of traders net-short is 13.39% lower than yesterday and 7.82% lower from last week.

We typically take a contrarian view to crowd sentiment, and the fact traders are net-long suggests EUR/GBP prices may continue to fall.

Our data shows traders are now net-long EUR/GBP for the first time since Sep 21, 2023 10:00 GMT when EUR/GBP traded near 0.87. Traders are further net-long than yesterday and last week, and the combination of current sentiment and recent changes gives us a stronger EUR/GBP-bearish contrarian trading bias.