Mexican Peso traders look ahead to busy week for the currency’s main peers

Mexican Peso traders look ahead to busy week for the currency’s main peers

The Mexican Peso (MXN) seesaws between tepid gains and losses on Monday after falling an average of 1.5% in its major pairs last week. The Bank of Mexico’s (Banxico) decision to cut interest rates by 25 basis points (0.25%) at its September meeting on Thursday, bringing the official cash rate down to 10.50%, as well as a downward revision to its forecasts for the economy, contributed to the Peso’s devaluation across the board.

Data showing a widening trade deficit added to the negativity surrounding the Mexican Peso after official figures showed it widened to $4.868 billion in August from $1.278 billion a year ago. These figures significantly exceeded market expectations of a $0.500 billion gap and reached a new two-year high.

The proximity of the United States (US) election and prospects of former President Donald Trump winning and then imposing an “America First” agenda, with negative implications for trade with Mexico, further add to the concerns regarding Mexico’s persistent trade deficit, which amounts to $10.438 billion for the first eight months of 2024.

Mexican Peso traders prepare for data-heavy week

The Mexican Peso oscillates between mild gains and losses on Monday ahead of a busy week of macroeconomic data releases and key events for its major peers – the US Dollar (USD), Euro (EUR) and Pound Sterling (GBP).

On Monday, speeches by European Central Bank (ECB) President Christine Lagarde and Chairman of the Federal Reserve (Fed) Jerome Powell could impact the EUR and USD, respectively. Recent weak data from the Eurozone, in particular, is leading to speculation in markets that the ECB will have to be more aggressive about cutting interest rates to aid growth, potentially weakening the Euro. In Mexico, Fiscal Balance data for August will be released, revealing the government’s spending shortfall.

On Tuesday, preliminary Eurozone inflation data for September, and then the Nonfarm Payrolls (NFP) on Friday, are further key data releases relating to key Peso pairs. The NFP release will be watched closely for signs of a slowdown in the labor market after the Fed made it clear it is now taking into account its mandate to provide full employment as part of its decision-making on interest rates.

Technical Analysis: USD/MXN trends higher within channel

USD/MXN climbs steadily higher within its rising channel as it continues its short, medium and long-term bullish trend.

USD/MXN Daily Chart
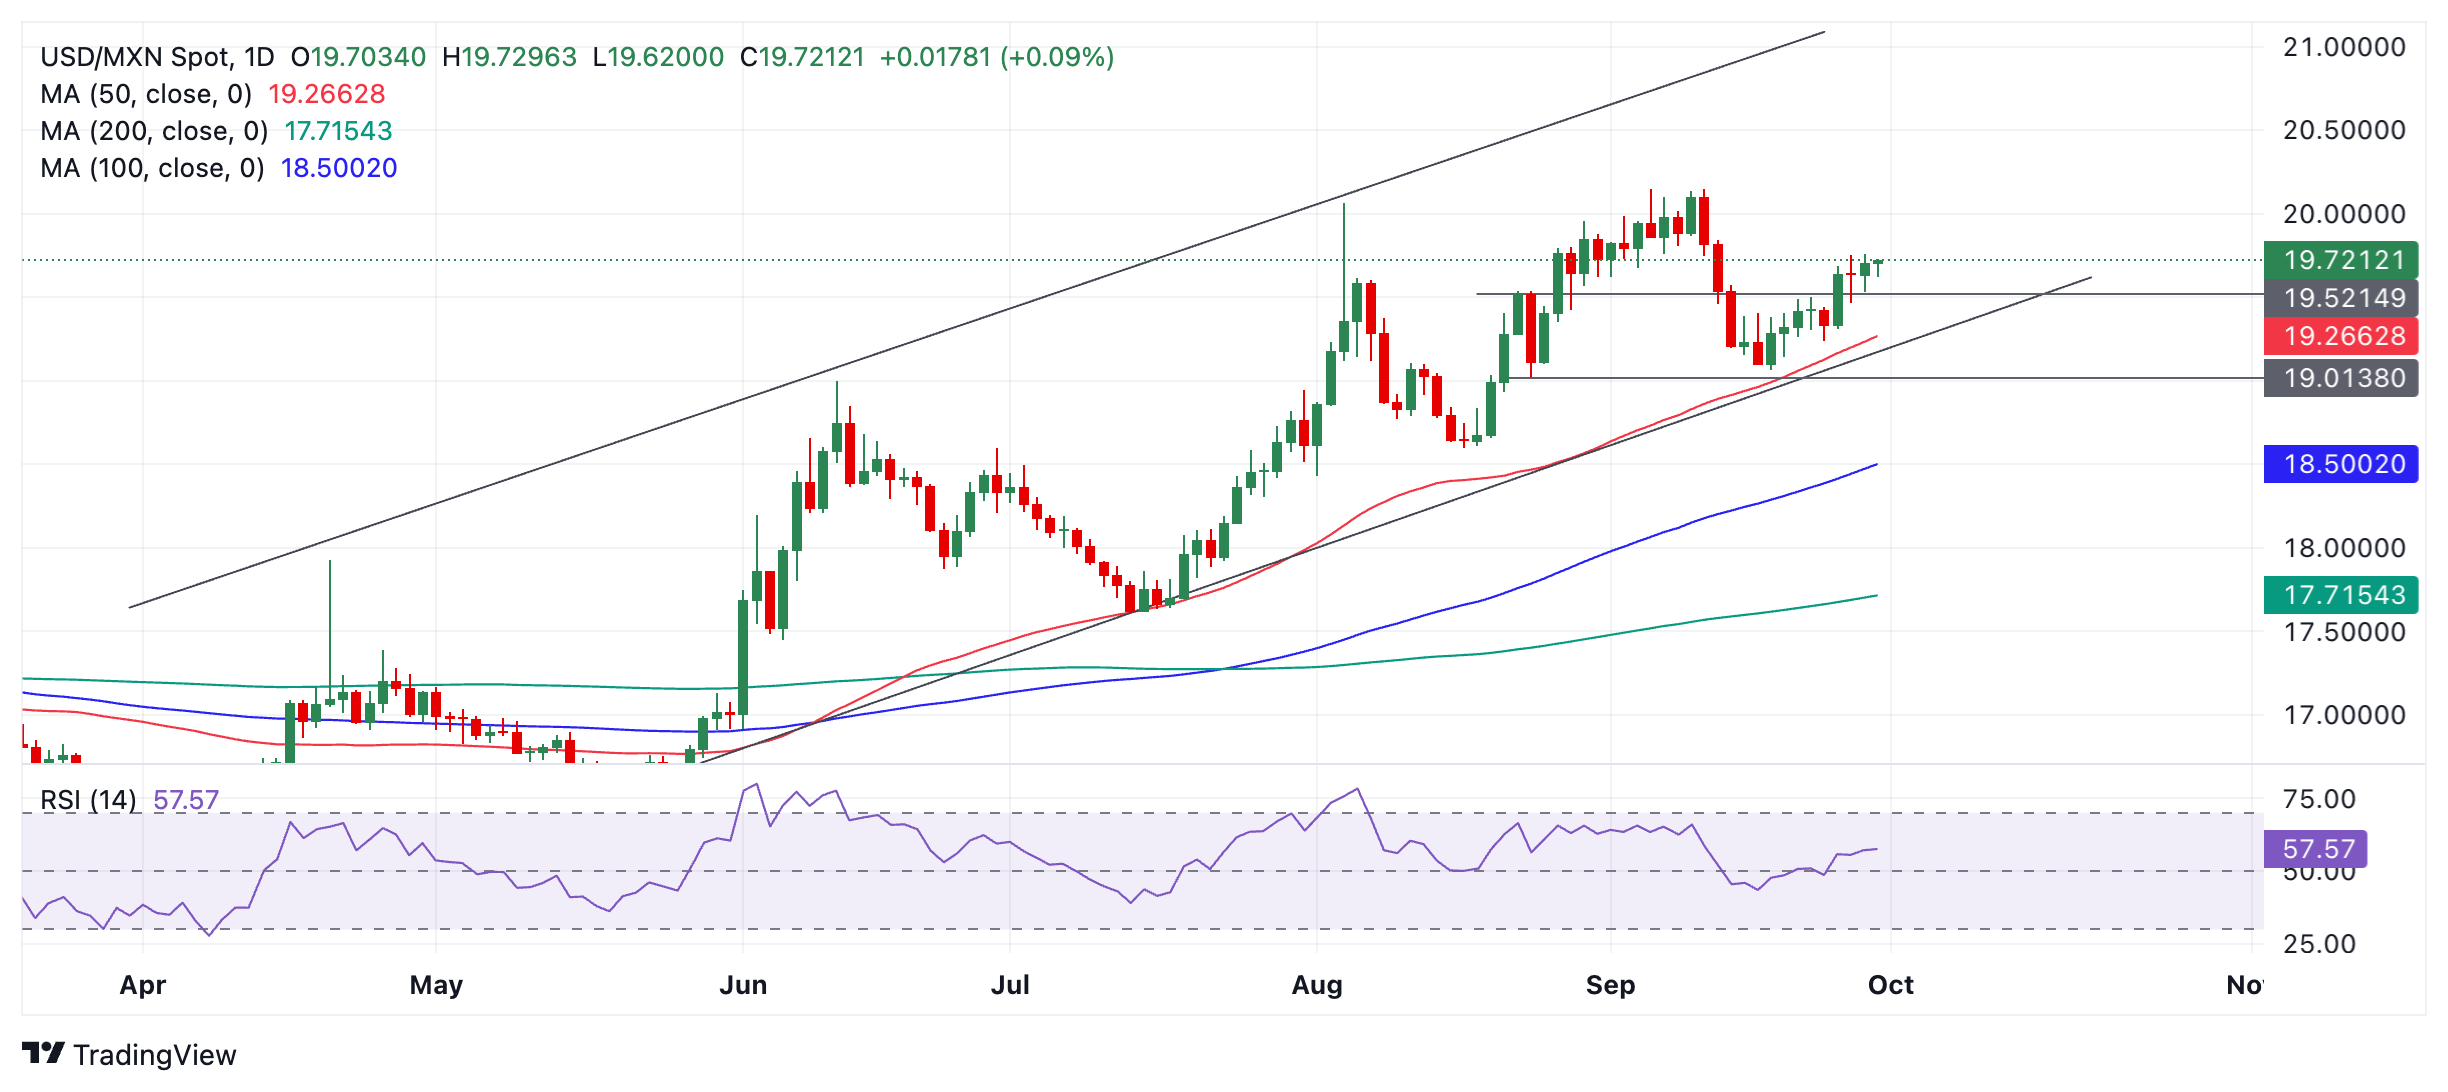
Friday’s close above 19.68 (September 25 high) provided more bullish certainty of the pair’s near-term upside bias towards a target at 20.15, the high of the year reached in early September.

EUR/USD: Likely to trade between 1.1130 and 1.1195

EUR/USD: Likely to trade between 1.1130 and 1.1195

The Euro (EUR) is expected to trade in a range, likely between 1.1130 and 1.1195. In the longer run, EUR has likely entered a range trading phase, probably between 1.1060 and 1.1215, UOB Group FX analysts Quek Ser Leang and Lee Sue Ann note.

Has to break above 1.1230 for a sustained rise towards 1.1275

24-HOUR VIEW: “We indicated last Friday, that the ‘slight increase in momentum is likely to result in a higher trading range of 1.1140/1.1205 instead of a sustained advance.’ EUR subsequently traded in a wider range than expected (1.1123/1.1202), closing slightly lower by 0.12% (1.1163). There has been no increase in either downward or upward momentum. In other words, we continue to expect EUR to trade in a range, likely between 1.1130 and 1.1195.”

1-3 WEEKS VIEW: “Our update from last Thursday (26 Sep, spot at 1.1130) is still valid. As highlighted, EUR ‘has likely entered a range trading phase, probably between 1.1060 and 1.1215.’ Looking ahead, EUR not only has to break above 1.1215 but also 1.1230 before a sustained rise towards 1.1275 can be expected.”

AUD/JPY rises above 98.50 due to rising odds of RBA maintaining a restrictive policy

AUD/JPY rises above 98.50 due to rising odds of RBA maintaining a restrictive policy

AUD/JPY gains ground, trading around 98.70 during the European session on Monday. This upside of the AUD/JPY cross is attributed to the Reserve Bank of Australia’s (RBA) hawkish stance contributing support to the Australian Dollar (AUD). The RBA kept its cash rate at 4.35% for a seventh consecutive meeting and stated that the policy would need to stay restrictive to ensure inflation slowed.

The AUD remains stronger despite the mixed Manufacturing Purchasing Managers’ Index (PMI) data from China, Australia’s largest trading partner. China’s Caixin Manufacturing PMI fell to 49.3 in September, indicating contraction, down from 50.4 in August. Meanwhile, China’s NBS Manufacturing PMI improved to 49.8, up from 49.1 in the previous month and surpassing the market consensus of 49.5.

Additionally, the rising expectations that the US Federal Reserve (Fed) may continue its policy easing in November is improving the market sentiment and contributing support for the risk-sensitive Australian Dollar. The CME FedWatch Tool indicates that markets are assigning a 55.9% probability to a 25 basis point rate cut by the Federal Reserve in November.

The Japanese Yen (JPY) receives downward pressure due to the dovish comments from Japan’s upcoming Prime Minister, former Defense Chief Shigeru Ishiba. Ishiba stated on Sunday that the country’s monetary policy should continue to be accommodative, indicating the necessity of maintaining low borrowing costs to support a fragile economic recovery, according to The Japan Times.

On Monday, Japan’s Retail Trade increased by 2.8% year-on-year in August, surpassing market expectations of 2.3% and slightly exceeding the upwardly revised 2.7% rise from the previous month. On a month-over-month basis, seasonally adjusted Retail Trade rose by 0.8%, marking the largest increase in three months, following a 0.2% gain in July.

Japan’s Chief Cabinet Secretary, Yoshimasa Hayashi, refrained from commenting on Monday’s daily stock market fluctuations. Hayashi emphasized the importance of closely monitoring the economic and financial situation both domestically and internationally with a sense of urgency. He also noted the need for ongoing collaboration with the Bank of Japan.

USD/CAD Price Forecast: Consolidates above 1.3500, bulls flirt with 200-hour SMA resistance

USD/CAD Price Forecast: Consolidates above 1.3500, bulls flirt with 200-hour SMA resistance

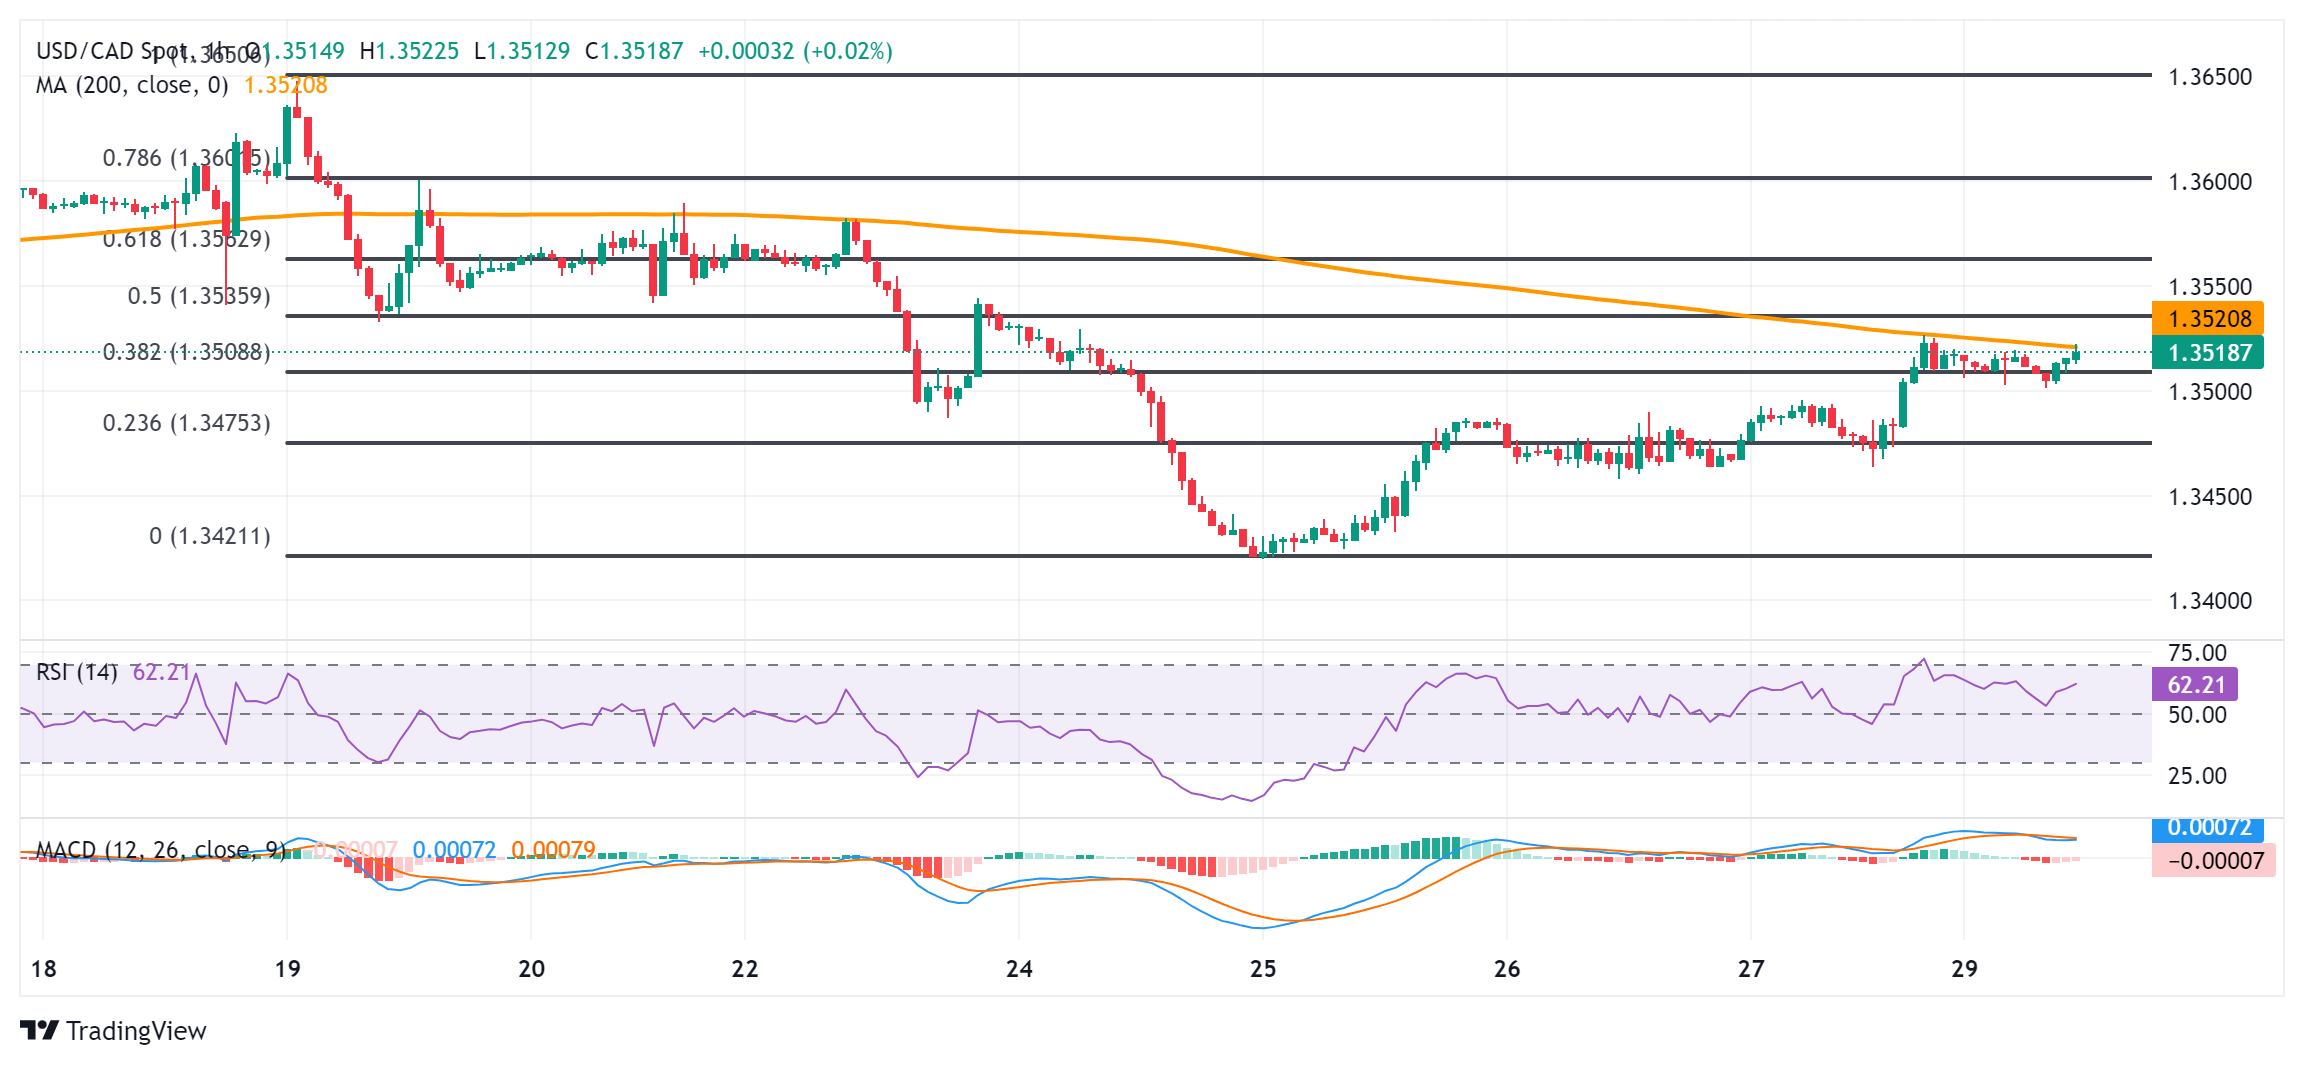
The USD/CAD pair struggles to capitalize on last week’s goodish recovery from its lowest level since March 8, albeit manages to hold above the 1.3500 psychological mark through the first half of the European session on Monday.

The US Dollar (USD) selling bias remains unabated for the third straight day amid rising bets for a more aggressive policy easing by the Federal Reserve (Fed), which, in turn, is seen acting as a headwind for the USD/CAD pair. Meanwhile, rising geopolitical risks in the Middle East lend some support to Crude Oil prices and underpin the commodity-linked Loonie, further contributing to capping the currency pair. That said, expectations for a larger rate cut by the Bank of Canada (BoC) keep a lid on the Canadian Dollar (CAD) and limit the downside for spot prices.

From a technical perspective, oscillators on the daily chart – though have been recovering from lower levels – are yet to confirm a positive bias and warrant some caution before positioning for any meaningful upside. Meanwhile, the USD/CAD pair now seems to have found acceptance above the 38.2% Fibonacci retracement level of the recent downfall from the monthly peak and is currently placed around the 200-hour Simple Moving Average (SMA). Any subsequent move-up is likely to attract fresh sellers near the 50% Fibo. level, around the 1.3535 area region.

The next relevant hurdle is pegged near the 1.3555-1.3560 area, or the 61.8% Fibo. level, and the very important 200-day SMA, currently pegged just ahead of the 1.3600 mark. The latter should act as a key pivotal point, which if cleared decisively should lift the USD/CAD pair to the monthly peak, around the 1.3645-1.3650 region. Some follow-through buying will be seen as a fresh trigger for bullish traders and pave the way for a further appreciating move in the near term.

On the flip side, a sustained break below the 1.3500 mark is likely to find some support near the 1.3465 region, below which the USD/CAD pair could retest the multi-month low, around the 1.3420 region. Some follow-through selling below the 1.3400 mark will pave the way for the resumption of the recent well-established downtrend witnessed over the past two months or so.

USD/CAD 1-hour chart

fxsoriginal

Gold’s pullback deepens as Chinese investors shift to skyrocketing stocks

Gold’s pullback deepens as Chinese investors shift to skyrocketing stocks

Gold (XAU/USD) pulls back to trade in the $2,650s per troy ounce on Monday, as traders take profit after last week’s almost 1.4% rally to new all time highs. A historic rally in Chinese stocks, which saw the benchmark CSI 300 gain over 7.50% during the Asian session on Monday alone, as well as a brighter outlook for the Chinese property market due to falling mortgage rates diverts capital away from Gold as a safe-haven.

Gold traders have been surfing a wave that started after a seismic shift in the US, where the Federal Reserve (Fed) opted to cut interest rates by a “jumbo” 0.50% at their September meeting, lowering the opportunity cost of holding the precious metal. However, better-than-expected US data since then have slightly lowered the chances of the Fed making another aggressive 50 basis point (bps) rate cut in November, though chances of this scenario occurring still remain above 50%, according to the CME FedWatch tool.

Gold pulls back but investors have mixed views about its future

Gold pulls back after touching a new record high of $2,685 last week on the back of the Fed kicking off its easing cycle and central banks globally following the US reserve bank’s lead.

Is the correction likely to deepen or will Gold resume its uptrend and push to yet higher highs? It appears investors have mixed views about the short-term prospects for Gold, according to a Weekly Gold survey compiled by Kitco News.

Darin Newsom, Senior Market Analyst at Barchart.com, sees the uptrend continuing: “Applying Newton’s First Law of Motion to markets: A trending market will stay in that trend until acted upon by an outside force. That outside force is usually investor activity, and given the potential for global chaos is only going to increase over the next month, investors aren’t likely to change their mind on gold as a safe-haven market.”

Ole Hansen, however, who is Head of Commodity Strategy at Saxo Bank, thinks the uptrend is petering out. “I see it lower as I believe the rally is running on fumes from FOMO and momentum-chasing traders using derivatives,” he said, adding that “in the short term, physical demand is likely to dry up until investors adapt to these new and higher price levels.”

Adrian Day, president of Adrian Day Asset Management, meanwhile, expected the price of Gold to change little in the short term.

“A pause in the strong move up is overdue and could come now that the Federal Reserve’s first rate cut is in the rear mirror,” he said. “Over the next six and 12 months, I could not be more bullish as Western investors finally start to buy Gold,” he added. “But markets do not go straight up forever.”

Technical Analysis: Gold extends pullback from new all-time highs

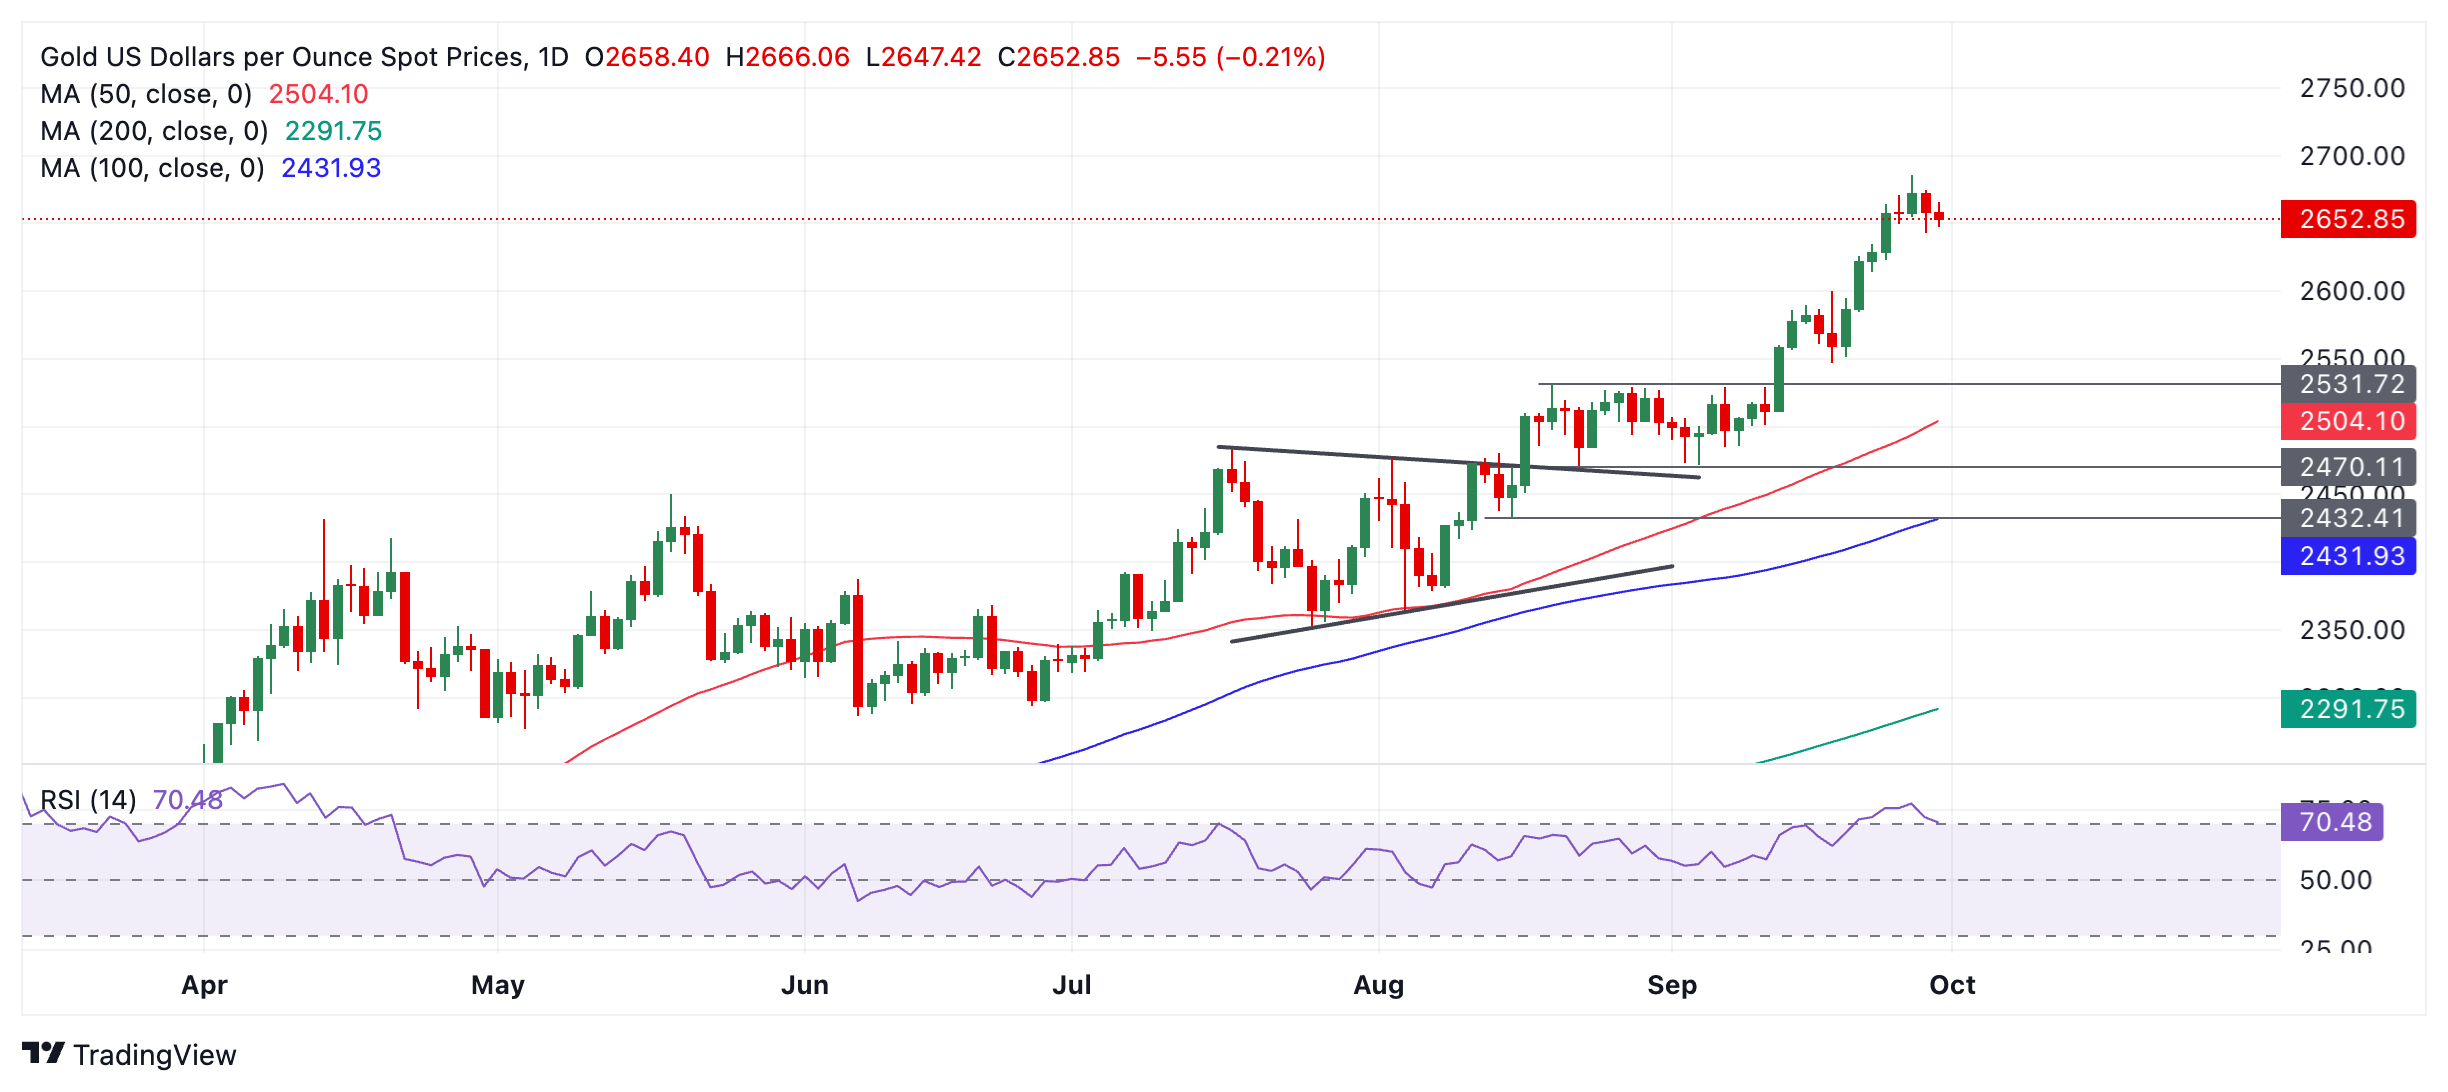
Gold extends its pullback after hitting record highs. The precious metal is still in an uptrend on a short, medium and long-term basis, however, and since it is a foundational principle of technical analysis that “the trend is your friend,” the odds favor even more upside for the yellow metal.

XAU/USD Daily Chart


Gold remains overbought, according to the Relative Strength Index (RSI) momentum indicator. It has now also almost fallen back down into neutral territory (below 70) and if it closes (on a daily basis) back inside neutral it will be a sign for traders to close their long positions and open shorts. As is it, simply by being overbought it advises traders not to add to their long positions.

If a deeper correction evolves – as now looks likely – firm support lies at $2,600 (September 18 high), $2,550 and $2,544 (0.382 Fibonacci retracement of the September rally).

Given the precious metal’s entrenched uptrend, however, there is a good chance any correction will run out of steam and bulls will resume pushing the price higher. If Gold breaks to higher highs, it will further reconfirm the metal’s uptrending bias. The next targets to the upside are the round numbers $2,700 and then $2,750.

Japanese Yen depreciates despite a subdued US Dollar ahead of Fed Powell’s speech

Japanese Yen depreciates despite a subdued US Dollar ahead of Fed Powell’s speech

The Japanese Yen (JPY) edges lower against the US Dollar (USD) on Monday, following the dovish comments from Japan’s upcoming Prime Minister, former Defense Chief Shigeru Ishiba. Ishiba stated on Sunday that the country’s monetary policy should continue to be accommodative, indicating the necessity of maintaining low borrowing costs to support a fragile economic recovery, according to The Japan Times.

Japan’s Retail Trade increased by 2.8% year-on-year in August, surpassing market expectations of 2.3% and slightly exceeding the upwardly revised 2.7% rise from the previous month. On a month-over-month basis, seasonally adjusted Retail Trade rose by 0.8%, marking the largest increase in three months, following a 0.2% gain in July.

The US Dollar received downward pressure following Friday’s US Core Personal Consumption Expenditures (PCE) Price Index data for August, which aligns with the US Federal Reserve’s (Fed) inflation outlook. This has reinforced the possibility of an aggressive rate-cutting cycle by the central bank.

The CME FedWatch Tool indicates that markets are assigning a 42.9% probability to a 25 basis point rate cut by the Federal Reserve in November, while the likelihood of a 50-basis-point increased to 57.1%, up from 50.4% a week ago.

Technical Analysis: USD/JPY remains above 142.00 after breaking below the ascending channel

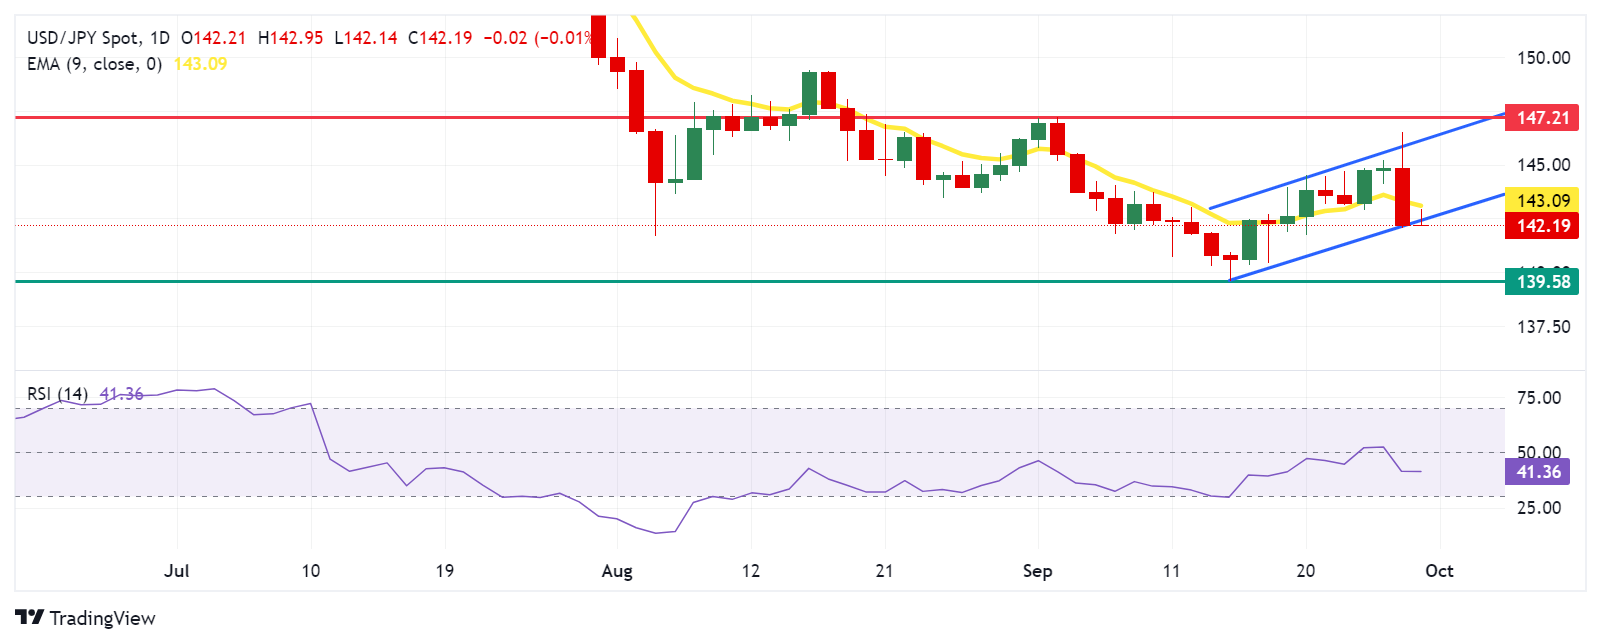
USD/JPY trades around 142.20 on Monday. Analysis of the daily chart indicates that the pair has broken below the ascending channel pattern, signaling a momentum shift from a bullish to a bearish bias. Furthermore, the 14-day Relative Strength Index (RSI) is situated below the 50 level, indicating a bearish sentiment is in play.

In terms of support, the USD/JPY pair may navigate around the 139.58 region, the lowest point since June 2023.

On the upside, a return to the ascending channel could weaken the bearish case and lead the USD/JPY pair to test the nine-day Exponential Moving Average (EMA) at the 143.10 level. A break above this level could support the pair to test the upper boundary of the ascending channel at 146.20 level, followed by its five-week high of 147.21 level, which was recorded on September 3.

USD/JPY: Daily Chart

Japanese Yen PRICE Today

AUD/JPY rises above 98.50 due to rising odds of RBA maintaining a restrictive policy

EUR/USD bounces toward 1.1200 ahead of German inflation data

EUR/USD is rising back toward 1.1200 in the European morning on Monday. Hot German regional CPI data fuels a fresh advance in the Euro while the US Dollar trades listlessly ahead of Fed Chair Powell’s speech. Germany’s national inflation data is next in focus.

EUR/USD trades within a touching distance of 1.1200 (static level). In case the pair rises above this level and starts using it as support, it could continue to stretch higher. In this scenario, 1.1275 (July 18, 2023, high) could be seen as next resistance before 1.1300 (round level). In the meantime, the Relative Strength Index (RSI) recently rose above 60, pointing to a buildup of a bullish momentum and suggesting that the pair has more room on the upside before turning technically overbought.

On the downside, 1.1160 (50-period Simple Moving Average (SMA) on the 4-hour chart, static level) aligns as first support before 1.1110-1.1100 (100-period SMA, 200-period SMA

After ending the previous week virtually unchanged, EUR/USD gains traction in the European session and rises toward 1.1200.

The Euro seems to be gathering strength following the regional inflation data from Germany. In September, the Consumer Price Index (CPI) in Saxony rose 0.2% on a monthly basis after declining 0.2% in August, while the CPI in Bavaria increased 0.1% in the same period. Later in the session, Germany’s Destatis will publish the nationwide CPI data.

In the early American trading hours, European Central Bank (ECB) President Christine Lagarde will testify before the European Parliament. In case Lagarde leaves the door open to a rate cut at the next policy meeting, the immediate market reaction could cause the Euro to come under pressure. On the other hand, the currency could preserve its strength if Lagarde refrains from committing to further policy-easing at least until the last meeting of the year.

In the second half of the day, the US economic calendar will feature the Chicago Purchasing Managers’ Index and Dallas Fed Manufacturing Business Index data for September. Investors are likely to ignore these releases and stay focused on Federal Reserve (Fed) Chairman Jerome Powell’s speech later in the day.

Powell will speak on the economic outlook while participating in a moderated discussion titled “A View from the Federal Reserve Board” at the National Association for Business Economics Annual Meeting, in Nashville, starting at 17:00 GMT. The CME FedWatch Tool shows that markets are pricing in a nearly 50% probability of another 50 basis points rate cut at the next meeting in November. If Powell pushes back the market positioning by voicing their willingness to continue to ease the policy in a gradual way, the US Dollar (USD) could find a foothold and limit EUR/USD’s upside.

Silver (XAG) Daily Forecast: India’s Solar Demand Boosts Silver, but Downside Risks Remain

Silver (XAG) Daily Forecast: India’s Solar Demand Boosts Silver, but Downside Risks Remain

Market Overview

Silver (XAG/USD) has continued its downward trajectory, trading around the $31.64 level and hitting an intra-day low of $31.58. The precious metal’s slide can be attributed to a modest rise in the US dollar, coupled with a broader risk-on sentiment in global markets.

India’s Solar Boom Driving Silver Demand Higher

A notable driver of silver demand is India’s growing solar cell industry, which has seen a significant increase in production. In the first four months of 2024, India imported over 4,172 metric tons of silver, surpassing its total imports for the previous year.

Experts trade the markets with IC Markets

Trading Derivatives carries a high level of risk to your capital and you should only trade with money you can afford to lose. Trading Derivatives may not be suitable for all investors, so please ensure that you fully understand the risks involved, and seek independent advice if necessary. A Product Disclosure Statement (PDS) can be obtained either from this website or on request from our offices and should be considered before entering into a transaction with us. Raw Spread accounts offer spread

The country’s shift to advanced, high-efficiency solar cells, which require higher silver content, has been a major factor in this surge.

Leading companies like Tata Power and Reliance Industries are expanding their solar manufacturing capacities, increasing demand. This heightened demand is pushing silver prices higher, as the metal’s excellent conductivity makes it a critical component in solar technology.

Analysts anticipate continued upward pressure on silver prices due to these industry trends, though price volatility and supply constraints remain key risks.

China’s Stimulus Boosts Silver, but Industrial Demand Poses Risks

China’s recent stimulus measures have contributed to a rise in silver prices, as these policies are expected to boost demand for industrial metals. Analysts from Saxo Bank and Citi predict that silver could outperform gold in the near term, with Citi forecasting silver prices to reach $35 within three months and $38 over the next year.

However, concerns about weakening industrial demand in China, especially in the solar sector, could limit silver’s upside potential. Despite the optimistic forecasts, slow growth in China’s industrial output and potential consolidation in its solar industry might dampen silver’s performance in the short term.

Analysts like Carsten Menke from Julius Baer caution that silver’s outlook increasingly hinges on gold’s performance, making it crucial for investors to watch broader market trends closely.

Short-Term Forecast

Silver remains under pressure, trading around $31.64. Failure to break above key resistance at $31.89 suggests continued downside, with immediate support at $31.43 and further risks toward $31.18.

Silver (XAG/USD) Price Forecast: Technical Outlook

Silver – Chart
Silver – ChartSilver (XAG/USD) is trading at $31.64, down 0.42% in today’s session. The precious metal is under pressure as it fails to break above the key pivot point at $31.89. Immediate resistance lies at $32.24, with further barriers at $32.47 and $32.70.

If silver reclaims the $31.90 level, it could spark renewed bullish momentum. However, a break below immediate support at $31.43 may extend the downside to $31.18, with stronger support at $30.87.

Technical indicators suggest bearish sentiment, as silver remains below the 50-day EMA at $31.88. Watch for a decisive move to determine the next direction.

Oil News: China Stimulus Uncertainty Fails to Lift Outlook as OPEC Supply Grows

Oil News: China Stimulus Uncertainty Fails to Lift Outlook as OPEC Supply Grows

Light Crude Oil Prices Edging Higher, but Supply Concerns Linger

Light crude oil futures showed marginal gains on Friday, trading within a tight range, with key levels in focus for traders. Prices hovered between $68.22 and $67.23, a retracement zone that will dictate the market’s closing direction. A push above $68.22 could signal bullish momentum, targeting the next resistance level near $69.79, while a drop below $67.23 could trigger a decline toward a critical low at $64.04.

Trading Derivatives carries a high level of risk to your capital and you should only trade with money you can afford to lose. Trading Derivatives may not be suitable for all investors, so please ensure that you fully understand the risks involved, and seek independent advice if necessary. A Product Disclosure Statement (PDS) can be obtained either from this website or on request from our offices and should be considered before entering into a transaction with us. Raw Spread accounts offer spread

Oil Set for Weekly Loss Amid Growing Supply Outlook

Despite Friday’s stability, crude oil prices remain poised for a significant weekly decline, weighed down by expectations of increased supply from Libya and the OPEC+ coalition. Brent crude is down roughly 4% for the week, with WTI facing a sharper 6% decline. Analysts attribute the bearish sentiment to growing production forecasts, especially after Libya resolved a political standoff that had crippled its oil exports.

Libya’s crude output had plummeted to 400,000 barrels per day (bpd) in September, down from over 1 million bpd in August, due to internal disputes over control of the Central Bank. A new agreement between rival factions is expected to restore up to 500,000 bpd of lost output, adding further pressure to global supply.

OPEC+ Production Cuts in Focus

The broader supply picture remains heavily influenced by OPEC+ decisions. The group, which has been cutting production by 5.86 million bpd, plans to roll back 180,000 bpd of those cuts by December.

Reports suggest that Saudi Arabia, OPEC’s dominant player, may be abandoning its informal $100 per barrel price target in favor of capturing market share. This shift has contributed to oil prices dropping by 3% midweek and sparked speculation about a brewing battle for market dominance. However, Saudi Arabia has officially denied targeting specific price levels.

China’s Economic Stimulus Adds Uncertainty

While the global supply outlook has dampened sentiment, there is cautious optimism from China, the world’s largest crude importer. The Chinese central bank lowered interest rates and injected liquidity into the banking sector on Friday, aiming to boost the country’s faltering economy.

With additional stimulus measures expected ahead of the October holiday, market watchers remain hopeful that this could support oil demand in the coming months. However, doubts linger about whether China’s efforts will be enough to offset the impact of rising oil supplies.

Market Forecast: Bearish Near-Term Outlook

In the near term, crude oil markets face a bearish outlook. While Chinese stimulus efforts offer potential upside, the combination of recovering Libyan output and OPEC+ adjustments are expected to keep a lid on prices.

Traders should watch for a decisive move below $67.23, which could lead to further declines toward $64.04, while resistance near $69.79 may prove challenging in the absence of stronger demand signals. For now, supply-side pressures seem to dominate the crude oil market.

Solana’s Bearish Divergence Shows SOL Traders Will Dump in October

Solana’s Bearish Divergence Shows SOL Traders Will Dump in October

Bearish Divergence, Rising Wedge Indicate Solana Selloff Ahead

A clear bearish divergence between SOL’s rising price and its falling Relative Strength Index (RSI) suggests that bullish momentum is weakening, making the token vulnerable to a short-term pullback.

Experts trade the markets with IC Markets

Trading Derivatives carries a high level of risk to your capital and you should only trade with money you can afford to lose. Trading Derivatives may not be suitable for all investors, so please ensure that you fully understand the risks involved, and seek independent advice if necessary. A Product Disclosure Statement (PDS) can be obtained either from this website or on request from our offices and should be considered before entering into a transaction with us. Raw Spread accounts offer spread

Notably, SOL’s price has surged over 25% from its mid-September low of $126 to its recent peak of $159. However, despite this price growth, the RSI has declined from 74.56 on September 23 to 64.42 on September 27, forming a bearish divergence that typically precedes a trend reversal.

SOL/USDT daily price chart
SOL/USDT
A rising wedge setup, defined by two upward-sloping and converging trendlines, also indicates a potential SOL price correction. For the unversed, rising wedges resolve when the price breaks below the lower trendline and falls by as much as the maximum distance between its upper and lower trendlines.

So, a decisive, high-volume breakdown below the wedge’s lower trendline may send SOL’s price toward the $140-142 range. Interestingly, this area coincides with the 200-4H exponential moving average (EMA) and the 0.382 Fibonacci retracement level.

In other words, SOL may decline by 9-11% in early October. Conversely, a bounce from the lower trendline may send its price toward the wedge’s apex point at around $165.

Solana’s Long-Term Outlook Remains Bullish

Despite the looming short-term risks, the long-term outlook for SOL remains bullish.

According to the latest VanEck report, Solana could capture a significant portion of Ethereum’s (ETH) market share due to its higher throughput and lower transaction costs, particularly in decentralized finance (DeFi) and non-fungible tokens (NFTs).

The report argues that Solana’s blockchain, which can process up to 65,000 transactions per second (TPS), gives it a competitive edge over Ethereum. Despite its shift to proof-of-stake, Ethereum is struggling with high gas fees and scalability issues.

VanEck projects Solana’s price to rise to $330 in the coming years. For context, this price target represents an approximate 111% increase from Solana’s current levels.

Macro Factors Support Long-Term Bullish Bias

Additionally, the macroeconomic environment continues to favor long-term bullish momentum for SOL. Central banks, including the US Federal Reserve, European Central Bank (ECB), and People’s Bank of China (PBoC), are shifting toward looser monetary policies.

Historically, low interest rates and increased liquidity have bolstered demand for risk assets like cryptocurrencies.

For example, in the wake of the COVID-19 pandemic, loose monetary policies contributed to the crypto market’s explosive growth in 2020 and 2021, when Bitcoin rallied from under $4,000 to an all-time high of $69,000, and Solana surged from $0.50 to $260 at its peak.