China’s Industrial Profit Decline Threatens Global Commodity Demand and Prices

China’s Industrial Profit Decline Threatens Global Commodity Demand and Prices

How China’s Industrial Profit Decline Could Impact Global Commodity Demand, Prices, and U.S. Stocks

China’s industrial profit slump, with a 17.8% year-on-year decline in August, signals potential shifts in global commodity markets and U.S. stocks. This downturn, driven by weak domestic demand and external pressures, could influence commodity demand, prices, and various U.S. stock sectors.

China’s Role in Global Commodity Demand

As the world’s second-largest economy, China is a major consumer of commodities. A decline in industrial profits often reflects broader economic challenges, potentially signaling weaker demand for raw materials like iron ore, copper, and oil.

Experts trade the markets with IC Markets

Trading Derivatives carries a high level of risk to your capital and you should only trade with money you can afford to lose. Trading Derivatives may not be suitable for all investors, so please ensure that you fully understand the risks involved, and seek independent advice if necessary. A Product Disclosure Statement (PDS) can be obtained either from this website or on request from our offices and should be considered before entering into a transaction with us. Raw Spread accounts offer spread

Implications for Energy and Metals Markets

Daily Light Crude Oil Futures

The mining and oil industries have seen significant profit declines, suggesting a slowing need for energy commodities. Metals markets may see a mixed impact, with some smelting industries posting gains while manufacturing and construction slowdowns could weigh on industrial metals demand.

Deflationary Risks and Global Ripple Effects

China’s economic struggles present clear deflationary signals. Weak consumer demand, excess industrial capacity, and falling producer prices point to a broader trend. This could impact global supply chains and countries relying on raw material exports to China.

Impact on U.S. Stock Sectors

Daily Exxon Mobil Corporation

  1. Energy Sector: Weakening Chinese demand could pressure U.S. energy stocks like ExxonMobil (XOM) and Chevron (CVX).
  2. Materials Sector: Companies like Freeport-McMoRan (FCX) and Alcoa (AA) could face challenges if global demand for industrial metals drops.
  3. Industrials Sector: Firms like Caterpillar (CAT) and Boeing (BA) may see reduced demand for their products.
  4. Technology Sector: Companies such as Apple (AAPL), Nvidia (NVDA), and Intel (INTC) could be vulnerable to lower consumer spending on electronics.
  5. Consumer Goods Sector: Nike (NKE), Starbucks (SBUX), and McDonald’s (MCD) might see impacts from weaker Chinese consumer demand.

Broad-Based U.S. Indexes

Daily E-mini S&P 500 Index

The S&P 500, Dow Jones Industrial Average, and Nasdaq could all be affected to varying degrees, depending on their exposure to China-sensitive sectors.

Monetary Policy and Commodity Prices

China’s recent stimulus measures may provide short-term relief, but traders should remain cautious about expecting a quick rebound in demand.

Conclusion: What Should Traders Watch?

For commodity traders, China’s industrial slowdown presents both risks and opportunities. U.S. stock investors should note that impacts will vary across sectors, with energy, materials, and industrials most exposed to China’s downturn. Traders and investors should closely monitor China’s economic indicators, policy shifts, and broader deflationary trends that may impact global markets and U.S. sectors.

US Dollar Forecast: US Core PCE and Spending Data Loom; Gold, EUR/USD and GBP/USD Outlook

US Dollar Forecast: US Core PCE and Spending Data Loom; Gold, EUR/USD and GBP/USD Outlook

US Dollar Index (DXY) – Technical Analysis 

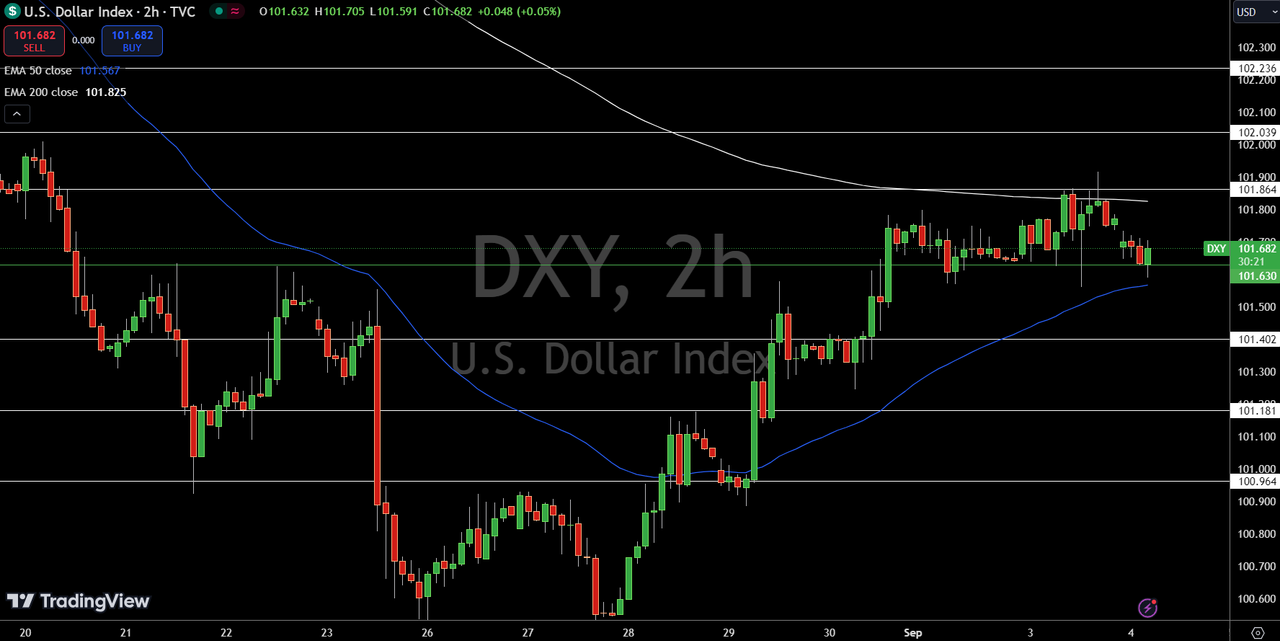
The Dollar Index (DXY) is trading at $100.679, up 0.20% during the session, maintaining a bullish tone as it approaches the key pivot point at $100.75. Immediate resistance is $100.97, followed by $101.17 and $101.47.

Dollar Index Price Chart - Source: TradingView
Dollar Index Price Chart – Source: TradingViewA break above these levels could drive the index higher, signalling continued strength. On the downside, support is $100.43, with further safety nets at $100.22 and $99.99.

Currently, the 50-day EMA at $100.73 is acting as immediate support, while the 200-day EMA at $101.01 indicates a broader resistance level. Should DXY break above the $100.75 pivot point, we could see renewed bullish momentum.

Gold Technical Forecast

Gold (XAU/USD) trades at $2,669.85, down 0.09%, holding above $2,666 support. Immediate resistance at $2,674.04.

Gold – Chart
Gold – Chart

Sterling Awaits CBI Realized Sales Data for Clarity

The British Pound is trading cautiously ahead of the CBI Realized Sales data release, which is expected to show a smaller contraction at -17, compared to last month’s -27.

A stronger-than-expected result could support the GBP, while a weaker print may increase selling pressure.

GBP/USD Technical Forecast

The GBP/USD is trading at $1.33746, down 0.21%, and struggling to hold above its pivot point of $1.3389. The pair faces immediate resistance at $1.3407, with further hurdles at $1.3434 and $1.3458.

Immediate support is $1.3360, with additional downside protection at $1.3335 and $1.3312.

GBP/USD Price Chart - Source: Tradingview
GBP/USD Price Chart – Source: TradingviewCurrently, the 50-day EMA at $1.33586 offers some near-term support, while the 200-day EMA at $1.32425 provides a more substantial foundation. If GBP/USD breaks above $1.3389, it could shift momentum toward a bullish stance.

Conversely, a drop below $1.3360 may invite more selling pressure and extend losses.

Euro Eyes Mixed Inflation Data and German Jobs Report

The Euro trades cautiously as traders digest mixed French and Spanish inflation data. France’s Consumer Spending improved by 0.2%, but its Preliminary CPI fell to -1.2%. Meanwhile, Spain’s Flash CPI dropped to 1.5% YoY. German Unemployment Change jumped by 17K, indicating labor market weakness.

Investors are now focusing on the Italian 10-year bond auction and comments from German Buba President Nagel for further direction. Weaker employment data and softer inflation figures may keep the Euro under pressure.

EUR/USD Technical Forecast

The EUR/USD is trading at $1.11330, down 0.11%, and remains below the key pivot point of $1.11439. The pair is facing immediate resistance at $1.11573, with further upside barriers at $1.11730 and $1.11890.

On the downside, immediate support lies at $1.11221, with additional support at $1.11047 and $1.10921. The 50-day EMA sits at $1.11537, indicating that the pair is struggling to reclaim bullish momentum, while the 200-day EMA at $1.11181 offers some support.

EUR/USD Price Chart - Source: Tradingview
EUR/USD Price Chart – Source: TradingviewIf EUR/USD breaks above $1.11439, bullish sentiment may return. However, a break below the immediate support at $1.11221 could lead to further downside pressure.

Japanese Yen Rallies: Analysis For USD/JPY, EUR/USD, AUD/USD, NZD/USD

Japanese Yen Rallies: Analysis For USD/JPY, EUR/USD, AUD/USD, NZD/USD

USD/JPY Retreats As Traders Focus On The Results Of The Ruling Party Elections

USD/JPY
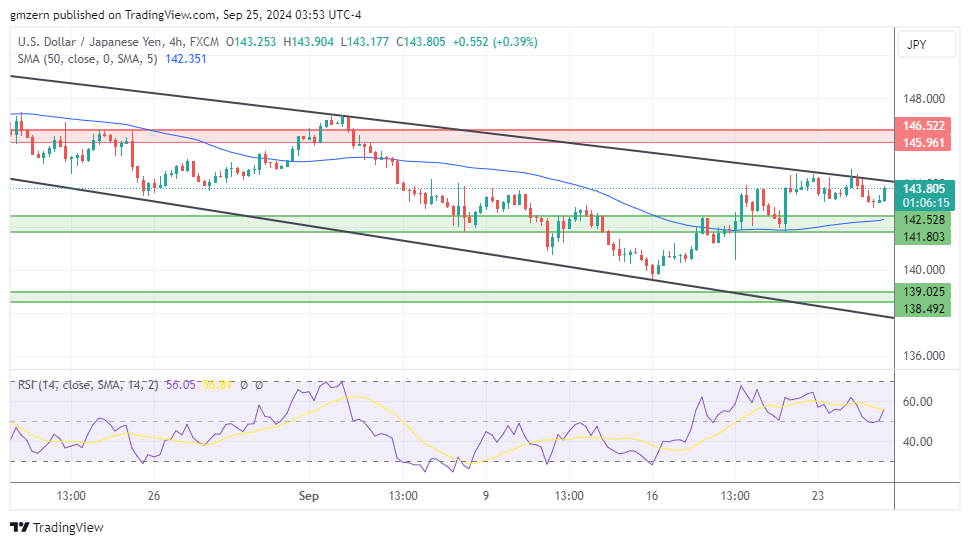
USD/JPY 270924 4h ChartUSD/JPY is losing ground as traders react to the results of Japan’s ruling party elections. Former Defense Minister Ishiba will lead the party, making him the next Prime Minister.

From the technical point of view, USD/JPY did not manage to get out of the downward channel and settled in a range between the support at 141.80 – 142.50 and the resistance at 146.00 – 146.50.

Experts trade the markets with IC Markets

Trading Derivatives carries a high level of risk to your capital and you should only trade with money you can afford to lose. Trading Derivatives may not be suitable for all investors, so please ensure that you fully understand the risks involved, and seek independent advice if necessary. A Product Disclosure Statement (PDS) can be obtained either from this website or on request from our offices and should be considered before entering into a transaction with us. Raw Spread accounts offer spread

EUR/USD Pulled Back As Traders Reacted To Germany’s Unemployment Rate Report

EUR/USD
EUR/USD 270924 4h ChartEUR/USD pulls back as traders react to Germany’s Unemployment Rate report, which indicated that Unemployment Rate remained unchanged at 6.0% in September. Today, traders will also focus on the Euro Area Economic Sentiment report. The report is expected to show that Economic Sentiment declined from 96.6 in August to 96.5 in September.

A successful test of the support at 1.1115 – 1.1130 will open the way to the test of the next support level, which is located in the 1.1000 – 1.1015 range.

AUD/USD Moved Lower As Precious Metals Pulled Back

AUD/USD
AUD/USD 270924 4h ChartAUD/USD moved lower as traders focused on the pullback in precious metals markets. Gold pulled back from historic highs, which was bearish for commodity-related currencies.

In case AUD/USD settles back below the 0.6850 level, it will head towards the nearest support level at 0.6815 – 0.6825.

NZD/USD Is Losing Ground As Consumer Confidence Report Missed Expectations

NZD/USD
NZD/USD 270924 4h ChartNZD/USD declined as traders reacted to ANZ Roy Morgan Consumer Confidence report, which showed that Consumer Confidence increased from 92.2 in August to 95.1 in September. Analysts expected that Consumer Confidence would grow to 101, so the report missed analyst expectations.

USD/JPY Forecast – US Dollar Continues to See Noise Against The Yen

USD/JPY Forecast – US Dollar Continues to See Noise Against The Yen

US Dollar vs Japanese Yen Technical Analysis

The U.S. Dollar has rallied a bit during the early hours on Thursday to reach the crucial 145 yen level, an area that of course has a lot of psychology attached to it, and of course an area that has been important more than once. All things being equal, this is a market that I think continues to see buyers jump in and pick up value any and every time we get an opportunity to play the bounce.

After all, the interest rate differential continues to favor the US dollar, and at this point in time the Bank of Japan has recently sat still at its latest interest rate decision. So, the question now will be whether or not traders have come back in and try to pick up this yield. There are a lot of cross currents around the world right now that could cause a lot of headaches. And in a significantly inherently volatile market like the dollar against the yen, it’s going to really show up in spades. If we can turn around a break above the 145 yen level, then we will challenge the 50 day EMA and then eventually the 150 yen level.

Experts trade the markets with IC Markets

Trading Derivatives carries a high level of risk to your capital and you should only trade with money you can afford to lose. Trading Derivatives may not be suitable for all investors, so please ensure that you fully understand the risks involved, and seek independent advice if necessary. A Product Disclosure Statement (PDS) can be obtained either from this website or on request from our offices and should be considered before entering into a transaction with us. Raw Spread accounts offer spread

If we break down, it’s really not until we close below the 140 yen level that I think we are ready for the next leg lower. That would, of course, be a very negative turn of events and probably kick off a very big “risk off” scenario for markets around the world.


EUR/USD Forecast – Euro Continues to Grind Higher

EUR/USD Forecast – Euro Continues to Grind Higher

Euro vs US Dollar Technical Analysis

The Euro rallied slightly in the early hours on Thursday, but really at this point in time, I think you have to understand that we continue to have a lot of questions asked about whether or not we can actually break above the 1.12 level. In general, I think you’ve got a situation where if we can break out to the upside, there’s the possibility that we go to the 1.1250 level, and then after that, it becomes much more of a buy and hold scenario.

You’ll notice that every time we reach a large round, the psychologically significant figure on the chart, we also have a reaction. This is a market that’s just simply bouncing around between one big figure after another. It does have an upward proclivity. So, I assume that we will eventually break out, although it doesn’t have to happen right now.

Experts trade the markets with IC Markets

Trading Derivatives carries a high level of risk to your capital and you should only trade with money you can afford to lose. Trading Derivatives may not be suitable for all investors, so please ensure that you fully understand the risks involved, and seek independent advice if necessary. A Product Disclosure Statement (PDS) can be obtained either from this website or on request from our offices and should be considered before entering into a transaction with us. Raw Spread accounts offer spread

But when you zoom out, you can see that we are close to a pretty significant top in this pair. Keep in mind that both central banks have cut rates as of late, although the Federal Reserve cut by 50 basis points, almost suggesting panic. That’s not a good thing either, so that might actually work against the euro if we really start to see the panicked train rolling. But at this point, I still think it’s more or less a buy on the dips at each and every big figure on the way down, with an eye on whether or not the risk appetite around the world is falling apart.


Dollar Rebounds: Fed Speeches Set to Shake Up Forex and Gold Markets

Dollar Rebounds: Fed Speeches Set to Shake Up Forex and Gold Markets

Dollar Rebounds as Traders Eye Fed Speeches for Rate Cut Clues


Daily US Dollar Index (DXY)The U.S. dollar staged a significant comeback on Wednesday, rebounding from multi-year lows against major currencies, but so far we haven’t seen a confirming follow-through to the upside as traders await key data on Final GDP, Weekly Initial Claims and Durable Goods. Yesterday’s rally, the sharpest since early June, comes as market participants eagerly anticipate speeches from key Federal Reserve officials later in the day.

Experts trade the markets with IC Markets

Trading Derivatives carries a high level of risk to your capital and you should only trade with money you can afford to lose. Trading Derivatives may not be suitable for all investors, so please ensure that you fully understand the risks involved, and seek independent advice if necessary. A Product Disclosure Statement (PDS) can be obtained either from this website or on request from our offices and should be considered before entering into a transaction with us. Raw Spread accounts offer spread

Fed Officials Split on Rate Cut Pace

Recent statements from Fed policymakers have presented a lack of consensus on the future path of interest rates. While Fed Governor Adriana Kugler supported the recent half-point rate cut, others like Chicago Fed President Austan Goolsbee and Atlanta Fed President Raphael Bostic have expressed more cautious views on the pace of future reductions.

Market Adjusts Rate Cut Expectations

Traders are currently pricing in a 57.4% probability of another 50-basis point cut at the Fed’s November meeting, slightly down from previous estimates. This shift in expectations highlights the importance of upcoming economic data, particularly the weekly U.S. jobless claims report, in gauging the health of the labor market.

Crucial Fed Speeches to Set Market Tone

Market attention is now focused on a series of speeches from Fed officials scheduled for later today. Fed Chair Jerome Powell’s pre-recorded remarks at a New York conference are highly anticipated, along with addresses from New York Fed President John Williams and other prominent Fed governors.

Inflation Concerns Emerge Within Fed

Fed Governor Michelle Bowman recently explained her dissent from the latest rate decision, adding complexity to the monetary policy outlook. Bowman expressed concerns about potential inflationary pressures, advocating for a more measured approach to rate cuts.

She warned that the aggressive 50-basis point reduction could be interpreted as a premature declaration of victory on price stability. Bowman emphasized that inflation remains above the Fed’s 2% target, with core inflation at 2.6%.

Her stance underscores the delicate balance the Fed must strike between supporting economic growth and maintaining price stability. This divergence in views within the Fed suggests that future policy decisions may be subject to intense debate, potentially leading to increased market uncertainty.

Forex Market Braces for Volatility

Daily EUR/USDThe dollar’s resurgence and the divergent views among Fed officials signal potential for renewed volatility in the U.S. Dollar and Forex markets. Traders should brace for possible sharp movements as the market digests the upcoming Fed speeches and economic data. The EUR/USD pair, which recently touched multi-year highs, may see increased fluctuations as traders reassess their positions based on the Fed’s rhetoric.

Daily Gold (XAU/USD)Gold prices, traditionally sensitive to interest rate expectations and dollar strength, could also experience significant swings. The precious metal’s appeal as an inflation hedge might be tested against the backdrop of a potentially strengthening dollar and evolving Fed policy stance.

The short-term outlook appears cautiously bearish for the dollar, considering the overall downward trend. However, yesterday’s reversal bottom may have fueled the start of a short-covering rally. This outlook could quickly shift based on the tone and content of the Fed officials’ remarks.

Traders in both currency and precious metal markets should remain alert to rapid sentiment changes. Vigilance and adaptability will be key for managing positions in these uncertain conditions, with particular attention to the interplay between dollar movements, interest rate expectations, and their impact on major currency pairs and gold.

Gold (XAU) Price Forecast: Rising Gap from 50-Day Average Signals Correction Risk

Gold (XAU) Price Forecast: Rising Gap from 50-Day Average Signals Correction Risk

Gold Prices Surge as Investors Bet on Further Rate Cuts

Gold prices hit a fresh all-time high on Wednesday, driven by expectations of another aggressive rate cut by the U.S. Federal Reserve and heightened geopolitical tensions.

The precious metal briefly reached $2,639.95 per ounce before retreating slightly, as the broader uptrend remained intact despite growing speculation of a near-term correction. The widening gap between recent highs and the 50-day moving average ($2,367.64) has raised concerns of potential downside pressure.

Experts trade the markets with IC Markets

Trading Derivatives carries a high level of risk to your capital and you should only trade with money you can afford to lose. Trading Derivatives may not be suitable for all investors, so please ensure that you fully understand the risks involved, and seek independent advice if necessary. A Product Disclosure Statement (PDS) can be obtained either from this website or on request from our offices and should be considered before entering into a transaction with us. Raw Spread accounts offer spread

Daily Gold (XAU/USD)At 11:48 GMT, XAU/USD is trading $2656.53, down $0.74 or -0.03%.

Gold Gains on Federal Reserve Rate Cut Bets

Gold continues to gain support from investor expectations that the Federal Reserve will further ease monetary policy. Following a 50 basis point rate cut at the last meeting, traders are now pricing in a 58% chance of another half-percentage-point reduction next month. Lower interest rates generally favor gold by reducing the opportunity cost of holding the non-yielding asset. Several market analysts believe gold could easily surpass $2,700 by the end of 2024.

Geopolitical Tensions and Weak Dollar Fuel Demand

Gold has also benefited from geopolitical uncertainty, particularly in the Middle East. Lebanon’s Hezbollah escalated tensions with Israel, further boosting demand for safe-haven assets like gold. Additionally, the U.S. dollar’s weakness and lower Treasury yields have supported higher prices, as highlighted by Daniel Hynes, senior commodities strategist at ANZ. Investors are closely watching Federal Reserve Chair Jerome Powell’s upcoming comments and U.S. inflation data, as these could offer further direction on monetary policy.

ETFs and Central Bank Buying Bolster Gold’s Bullish Outlook

The revival of gold exchange-traded fund (ETF) inflows has been a critical driver in the metal’s recent rally. Global gold ETFs saw inflows of 28.5 tonnes in August, led by North America, reversing several years of net outflows. Analysts at Standard Chartered and Goldman Sachs expect these inflows to accelerate, especially as rate cuts increase gold’s appeal to Western investors. With central banks, particularly in China, also ramping up purchases, demand remains robust.

Market Forecast: Gold Set for Further Gains

Gold’s bullish momentum shows no signs of slowing. The metal has already gained over 27% this year and could reach the $3,000 mark if U.S. economic data deteriorates or geopolitical risks intensify. While a short-term correction may be possible given the current vertical price movement, most major banks forecast a continued rally into 2025, driven by ongoing rate cuts, ETF inflows, and safe-haven demand. Traders should expect gold to remain supported at $2,600, with the potential for a breakout toward $2,850 by 2025.

China’s Stimulus Sparks U.S. Metals and Mining Rally: Is a Boom on the Horizon?

China’s Stimulus Sparks U.S. Metals and Mining Rally: Is a Boom on the Horizon?

Impact of PBOC’s Aggressive Moves on Global Markets

The People’s Bank of China’s (PBOC) aggressive monetary easing has sent ripples through global markets, driving gains in metals, mining stocks, and commodity-linked currencies. While aimed at stabilizing China’s economy, the measures have sparked optimism globally, especially among commodity traders.

Metals & Mining Stocks Rally

Daily SPDR S&P Metals & Mining ETFChina’s stimulus triggered a strong rally in U.S. metals and mining stocks. The SPDR S&P Metals & Mining ETF (XME) surged 4.22%, with stocks like MP Materials Corp up 12.44% and Alcoa gaining 7.45%.

Experts trade the markets with IC Markets

Trading Derivatives carries a high level of risk to your capital and you should only trade with money you can afford to lose. Trading Derivatives may not be suitable for all investors, so please ensure that you fully understand the risks involved, and seek independent advice if necessary. A Product Disclosure Statement (PDS) can be obtained either from this website or on request from our offices and should be considered before entering into a transaction with us. Raw Spread accounts offer spread

Daily MP Materials CorpAs the world’s largest consumer of metals like copper, iron ore, and coal, China’s recovery is key for global commodity markets. The PBOC’s easing—featuring rate cuts and liquidity injections—is expected to fuel infrastructure projects, driving up demand for these raw materials.

Daily BHP Group LimitedEnergy stocks like ExxonMobil and Chevron also stand to gain as increased Chinese demand boosts oil consumption. Mining giants BHP, Rio Tinto, and Glencore are similarly poised for a lift.

Precious and Industrial Metals Climb

Daily Silver (XAG/USD)Commodities have reacted strongly to China’s moves. Gold hit fresh highs, rising 1.09% on Tuesday, while silver gained 4.56%. Copper jumped over 4% as expectations of Chinese demand increased.

China’s infrastructure and property sectors are critical drivers of global metals prices. With the PBOC reducing borrowing costs, industrial metals like copper and steel are expected to see sustained demand as construction activity ramps up.

Forex Market Impact: AUD and NZD on the Move

China’s easing has also influenced forex markets, particularly commodity-linked currencies like the Australian dollar (AUD) and New Zealand dollar (NZD). Both currencies have rallied against the U.S. dollar as traders anticipate stronger Chinese demand.

Daily AUD/USD

  • AUD/USD: The Australian dollar surged, driven by expectations of higher Chinese demand for Australia’s iron ore.
  • NZD/USD: The New Zealand dollar also gained, benefiting from China’s increased demand for agricultural exports.

These currencies serve as proxies for Chinese economic activity, offering traders a way to play China’s recovery.

Market Outlook: Bullish but Cautious

The PBOC’s moves have lifted markets, creating a bullish outlook for commodities, metals, and forex. However, investors remain cautiously optimistic, watching for further stimulus and signs of sustained economic recovery in China.

Stocks tied to commodities, energy, and Chinese demand are set to benefit, while AUD/USD and NZD/USD provide appealing forex plays. Yet, geopolitical risks, especially U.S.-China trade tensions, could temper gains in the coming months.

US Dollar Forecast: New Home Sales Data Looms; Gold, GBP/USD and EUR/USD Outlook

US Dollar Forecast: New Home Sales Data Looms; Gold, GBP/USD and EUR/USD Outlook

Weak Manufacturing Data and Low Confidence Weigh on U.S. Dollar

The Richmond Manufacturing Index dropped to -21, while the CB Consumer Confidence fell to 98.7, down from 105.6. These figures reflect growing concerns about U.S. economic strength, weakening the U.S. dollar and bolstering gold prices as a safe-haven asset.

Investors are now focusing on upcoming data, including New Home Sales at 699K and FOMC Member Kugler’s speech.

Experts trade the markets with IC Markets

Trading Derivatives carries a high level of risk to your capital and you should only trade with money you can afford to lose. Trading Derivatives may not be suitable for all investors, so please ensure that you fully understand the risks involved, and seek independent advice if necessary. A Product Disclosure Statement (PDS) can be obtained either from this website or on request from our offices and should be considered before entering into a transaction with us. Raw Spread accounts offer spread

Any further economic weakness could push the dollar lower, enhancing gold’s appeal. The market will closely watch Wednesday’s releases for more clues on potential Federal Reserve policy shifts.

US Dollar Index (DXY) – Technical Analysis 

The Dollar Index (DXY) is trading at $99.937, down 0.06%, as it tests immediate support at $100.103.

The pivot point at $100.273 is crucial; a break above this level could push the DXY toward resistance at $100.419 (23.6% Fibonacci level) and further to $100.543 (38.2% Fibonacci level).

Dollar Index Price Chart - Source: Tradingview

Dollar Index Price Chart – Source: TradingViewHowever, the 50-day EMA at $100.702 and the 200-day EMA at $101.084 remain key resistance levels, capping any significant upward momentum.

On the downside, a break below $99.978 could trigger further declines, with $99.850 as the next key support level. Overall, the outlook remains bearish unless the index can climb and hold above the $100.275 pivot.

Gold Technical Forecast

Gold (XAU/USD) is trading at $2,655.29, down 0.06%, showing some hesitation. A break above the pivot point at $2,659.47 could signal more bullish momentum, with resistance at $2,670.41.

Gold – Chart

Gold – ChartOn the downside, support lies at $2,652.42, with additional levels at $2,647.13 and $2,641.52. The 50-day and 200-day EMAs provide strong support at $2,638.12 and $2,595.91 respectively.

UK Manufacturing PMI Falls, MPC Speech in Focus

Sterling slipped following weaker-than-expected Manufacturing PMI at 51.5, missing the forecast of 52.3. Investors are now awaiting MPC Member Greene’s speech for insights into future monetary policy. With services data also softening, any dovish signals could pressure the pound further.

GBP/USD Technical Forecast

The GBP/USD pair is trading at $1.34087, down 0.3%, as it hovers near key support at $1.33872 (23.6% Fibonacci level). If it breaks below this, the next support levels to watch are $1.33607 and $1.33391.

On the upside, the pivot point sits at $1.34288—a break above this could see the pair test resistance at $1.34488 and $1.34739.

GBP/USD Price Chart - Source: Tradingview

GBP/USD Price Chart – Source: TradingviewWith the 50-day EMA at $1.33305, the pair remains supported in the short term, but pressure is building.

If the price fails to reclaim $1.34288, further bearish momentum could unfold. However, a break above the pivot would indicate a potential bullish reversal.

Euro Struggles; Weak PMIs and German Ifo Business Climate Data

Earlier this week, the German Ifo Business Climate index fell to 85.4, missing expectations of 86.1, signalling a deteriorating business outlook.

Additionally, weak PMIs across Germany and France, including French Manufacturing PMI at 44.0 and German Manufacturing PMI at 40.3, further underscore sluggish growth.

The Belgian NBB Business Climate also dropped to -13.3. With no major data scheduled for Wednesday, traders assess the euro’s vulnerability amid ongoing economic challenges in the Eurozone.

EUR/USD Technical Forecast

The EUR/USD is trading at $1.11928, up 0.12%, as it hovers near key resistance at $1.11992. A break above this level could push the pair toward $1.12130 and $1.12233, signalling further bullish momentum.

EUR/USD Price Chart - Source: Tradingview

EUR/USD Price Chart – Source: TradingviewHowever, the pair appears overbought, meaning a pullback could be in play if it struggles to break resistance. Immediate support lies at $1.1181, aligning with the 23.6% Fibonacci level, followed by $1.11695 at the 38.2% Fibonacci level. The 50-day EMA at $1.11465 offers solid support.

Overall, a break below the $1.11992 pivot point may lead to bearish pressure, but sustained strength above this level could signal more upside.

Gold (XAU) Daily Forecast: Key Support at $2,650 – Will Profit-Taking Continue?

Gold (XAU) Daily Forecast: Key Support at $2,650 – Will Profit-Taking Continue?

Market Overview

Gold prices (XAU/USD) retreated from their record high of $2,655 during the Asian session on Wednesday as investors took profits after an extended rally. The price correction comes as gold appeared overbought, prompting cautious sentiment in the market.

Simultaneously, China’s recent stimulus measures have created a “risk-on” environment, luring investors into higher-yield assets and dampening immediate demand for gold’s safe-haven appeal.

Experts trade the markets with IC Markets

Trading Derivatives carries a high level of risk to your capital and you should only trade with money you can afford to lose. Trading Derivatives may not be suitable for all investors, so please ensure that you fully understand the risks involved, and seek independent advice if necessary. A Product Disclosure Statement (PDS) can be obtained either from this website or on request from our offices and should be considered before entering into a transaction with us. Raw Spread accounts offer spread

Despite the recent dip, analysts do not foresee a sharp decline in gold prices. The Federal Reserve’s anticipated easing measures continue to exert pressure on the U.S. dollar, bolstering gold’s attractiveness.

Additionally, ongoing geopolitical tensions in the Middle East and U.S. political uncertainty ahead of the November elections sustain demand for gold.

Dollar Weakness and Economic Data Favor Gold

The U.S. dollar has been weakening due to expectations of further rate cuts from the Federal Reserve. According to the CME Group’s FedWatch Tool, markets are pricing in a 75% chance of a 50-basis point rate cut in November. A weakening dollar supports gold by lowering the opportunity cost of holding the non-yielding asset.

Additionally, recent U.S. economic data has contributed to dollar weakness. The Conference Board’s Consumer Confidence Index dropped to 98.7 in September, down from 105.6 in August, highlighting growing concerns about the U.S. economy. Manufacturing activity also showed a downturn, with the Richmond Fed’s composite manufacturing index slipping to -21 from -19.

Fed’s Powell and Economic Data in Focus

Traders are now awaiting key speeches by Fed officials, particularly Chair Jerome Powell’s address on Thursday, for clues on future monetary policy.

Additionally, Friday’s release of the U.S. Personal Consumption Expenditure (PCE) Price Index will be crucial in determining the dollar’s short-term direction and could influence future Fed decisions.

Geopolitical Risks Keep Gold Attractive

Geopolitical tensions, particularly in the Middle East, continue to push investors toward gold. Recent escalations in Israel and Lebanon have raised fears of a broader conflict, driving demand for safe-haven assets. U.S. political uncertainty leading up to the elections adds another layer of support for gold prices.

While China’s stimulus-driven “risk-on” sentiment may create short-term volatility, gold remains a strong choice for investors looking to hedge against global uncertainties.

Short-Term Forecast

Gold prices may experience near-term consolidation around $2,655. A break above $2,659 could trigger bullish momentum, while a dip below $2,652 risks further downside, maintaining a cautious market tone.

Gold Prices Forecast: Technical Analysis

Gold – Chart
Gold – ChartGold (XAU/USD) is trading at $2,655.29, down 0.06%, showing slight hesitation after recent gains. The pivot point at $2,659.47 is crucial—if prices break above this, it could signal more bullish momentum, with immediate resistance at $2,670.41, followed by $2,676.83 and $2,683.64.

On the downside, immediate support is at $2,652.42, with additional support levels at $2,647.13 and $2,641.52. The 50-day EMA at $2,638.12 and 200-day EMA at $2,595.91 offer strong medium- and long-term support.

A break below $2,652 could shift sentiment bearish while moving above $2,659 would likely trigger fresh buying interest.