
Oil News: Light Crude Nears Major Moving Averages, Fed Rate Cut Lends Support

Oil News: Light Crude Nears Major Moving Averages, Fed Rate Cut Lends Support

Light Crude Futures Eye Key Resistance Levels

Light crude oil futures are trading higher on Monday, building on momentum after last week’s U.S. interest rate cut. Traders are closely watching resistance at the 50% Fibonacci retracement level of $72.21, with potential for a bullish push toward the price cluster around the 50-day moving average at $72.61 and the 200-day moving average at $72.94. Support is firm at the Fibonacci level of $69.79, with a break below likely to trigger a short-term correction.

Experts trade the markets with IC Markets

Trading Derivatives carries a high level of risk to your capital and you should only trade with money you can afford to lose. Trading Derivatives may not be suitable for all investors, so please ensure that you fully understand the risks involved, and seek independent advice if necessary. A Product Disclosure Statement (PDS) can be obtained either from this website or on request from our offices and should be considered before entering into a transaction with us. Raw Spread accounts offer spread

Oil Prices Benefit from Fed Rate Cut, US Supply Dip

Oil prices edged higher after the Federal Reserve’s aggressive 50 basis point rate cut last week, which helped stabilize risky assets, including crude oil. Additionally, a temporary reduction in U.S. crude supply, caused by Hurricane Francine, has lent support to the market despite ongoing concerns about weakened demand from China, the world’s largest oil importer.

Last week saw a second consecutive rise in both Brent and West Texas Intermediate (WTI) contracts. According to analysts, the larger-than-expected rate cut has played a pivotal role in boosting oil prices, as it reduced borrowing costs and injected confidence into broader financial markets. However, oil is expected to remain rangebound as market participants weigh other economic indicators.

“Oil looks rangebound despite the uplift to risky asset prices from an outsized policy rate cut by the Fed last week,” said Harry Tchilinguirian, head of research at Onyx Capital Group. He also pointed out that upcoming flash PMI data from Europe and the U.S. will be critical for determining the next move in oil prices.

Weak Economic Data Caps Gains

Despite recent gains, weaker economic data from China and the Eurozone could limit further upside for crude. Eurozone business activity contracted unexpectedly, with the manufacturing sector worsening and services showing no growth. This weak outlook from two of the world’s largest economies has dampened optimism in the oil market.

“There was some hope earlier this morning that additional Chinese monetary stimulus was on the horizon, but the latest PMI out of Europe switched market sentiment from positive to negative,” said UBS analyst Giovanni Staunovo. However, Staunovo expects oil prices to find some support this week due to a large U.S. crude draw, driven by robust export activity.

Geopolitical Tensions Add to Price Support

Another factor supporting oil prices is escalating geopolitical tensions in the Middle East. Over the weekend, Israeli airstrikes targeted Hezbollah positions in Lebanon, raising concerns about potential supply disruptions in the region. Analysts warn that the conflict could escalate further, putting additional upward pressure on oil prices.

“Geopolitical tensions in the Middle East have edged up a notch between Israel and Hezbollah, which could leave oil prices well supported on the risks of a wider regional conflict,” noted Yeap Jun Rong, a strategist at IG Markets.

Market Forecast: Bullish Outlook

With a combination of supply constraints, a larger-than-expected U.S. rate cut, and heightened geopolitical risks, oil prices are expected to maintain a bullish bias in the short term. While weak economic data from China and Europe may prevent a sustained rally, the current support levels and potential for a U.S. crude supply draw should provide upward momentum.


Ethereum Veteran’s Large ETH Transfer Triggers Price Crash Fears

Ethereum Veteran’s Large ETH Transfer Triggers Price Crash Fears

A massive Ethereum transfer worth a couple of million dollars is causing jitters across the Ether (ETH) market due to its association with a veteran investor, insomuch that some are calling it a sign of an impending price crash.

ICO-era Address Moves Over 3,500 ETH To Exchange

An Ethereum initial coin offering (ICO) participant who gained 150,000 ETH (worth $389.7 million at current market value) and has been dormant for over two years recently deposited 3,510 ETH (approximately $9.12 million) into Kraken.

Experts Trade Ethereum with IC Markets

Trading Derivatives carries a high level of risk to your capital and you should only trade with money you can afford to lose. Trading Derivatives may not be suitable for all investors, so please ensure that you fully understand the risks involved, and seek independent advice if necessary. A Product Disclosure Statement (PDS) can be obtained either from this website or on request from our offices and should be considered before entering into a transaction with us. Raw Spread accounts offer spread

Source: X

Source: XLarge Ethereum holders, especially those who have been dormant for years, depositing ETH to exchanges can create short-term pressure on the market. If many whales start offloading ETH, it could result in downward pressure on the ETH against the US dollar and Bitcoin.

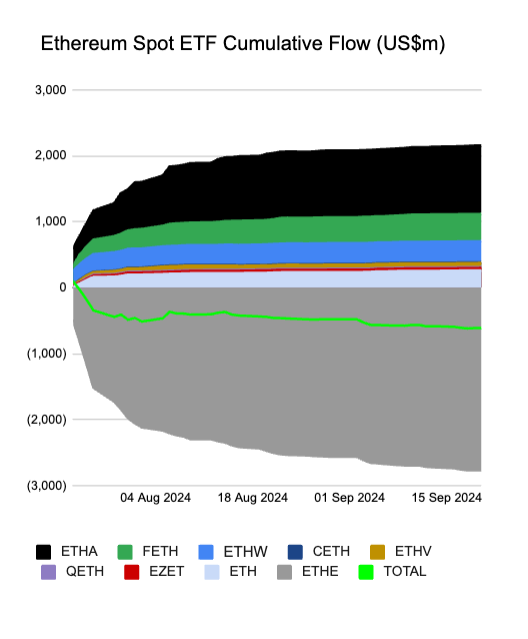
The sentiment grows toward bears also due to an underperforming Ethereum exchange-traded fund (ETF) sector in the US. Notably, these ETFs have together suffered inflows worth $607.60 million since their debut in July 2024, albeit Grayscale’s investment vehicle being the main culprit behind the withdrawals.

Ethereum ETF net flows

Ethereum ETF net flows. Source: Farside InvestorsFurthermore, Ethereum’s largest whale cohorts have been distributing their ETH holdings for months.

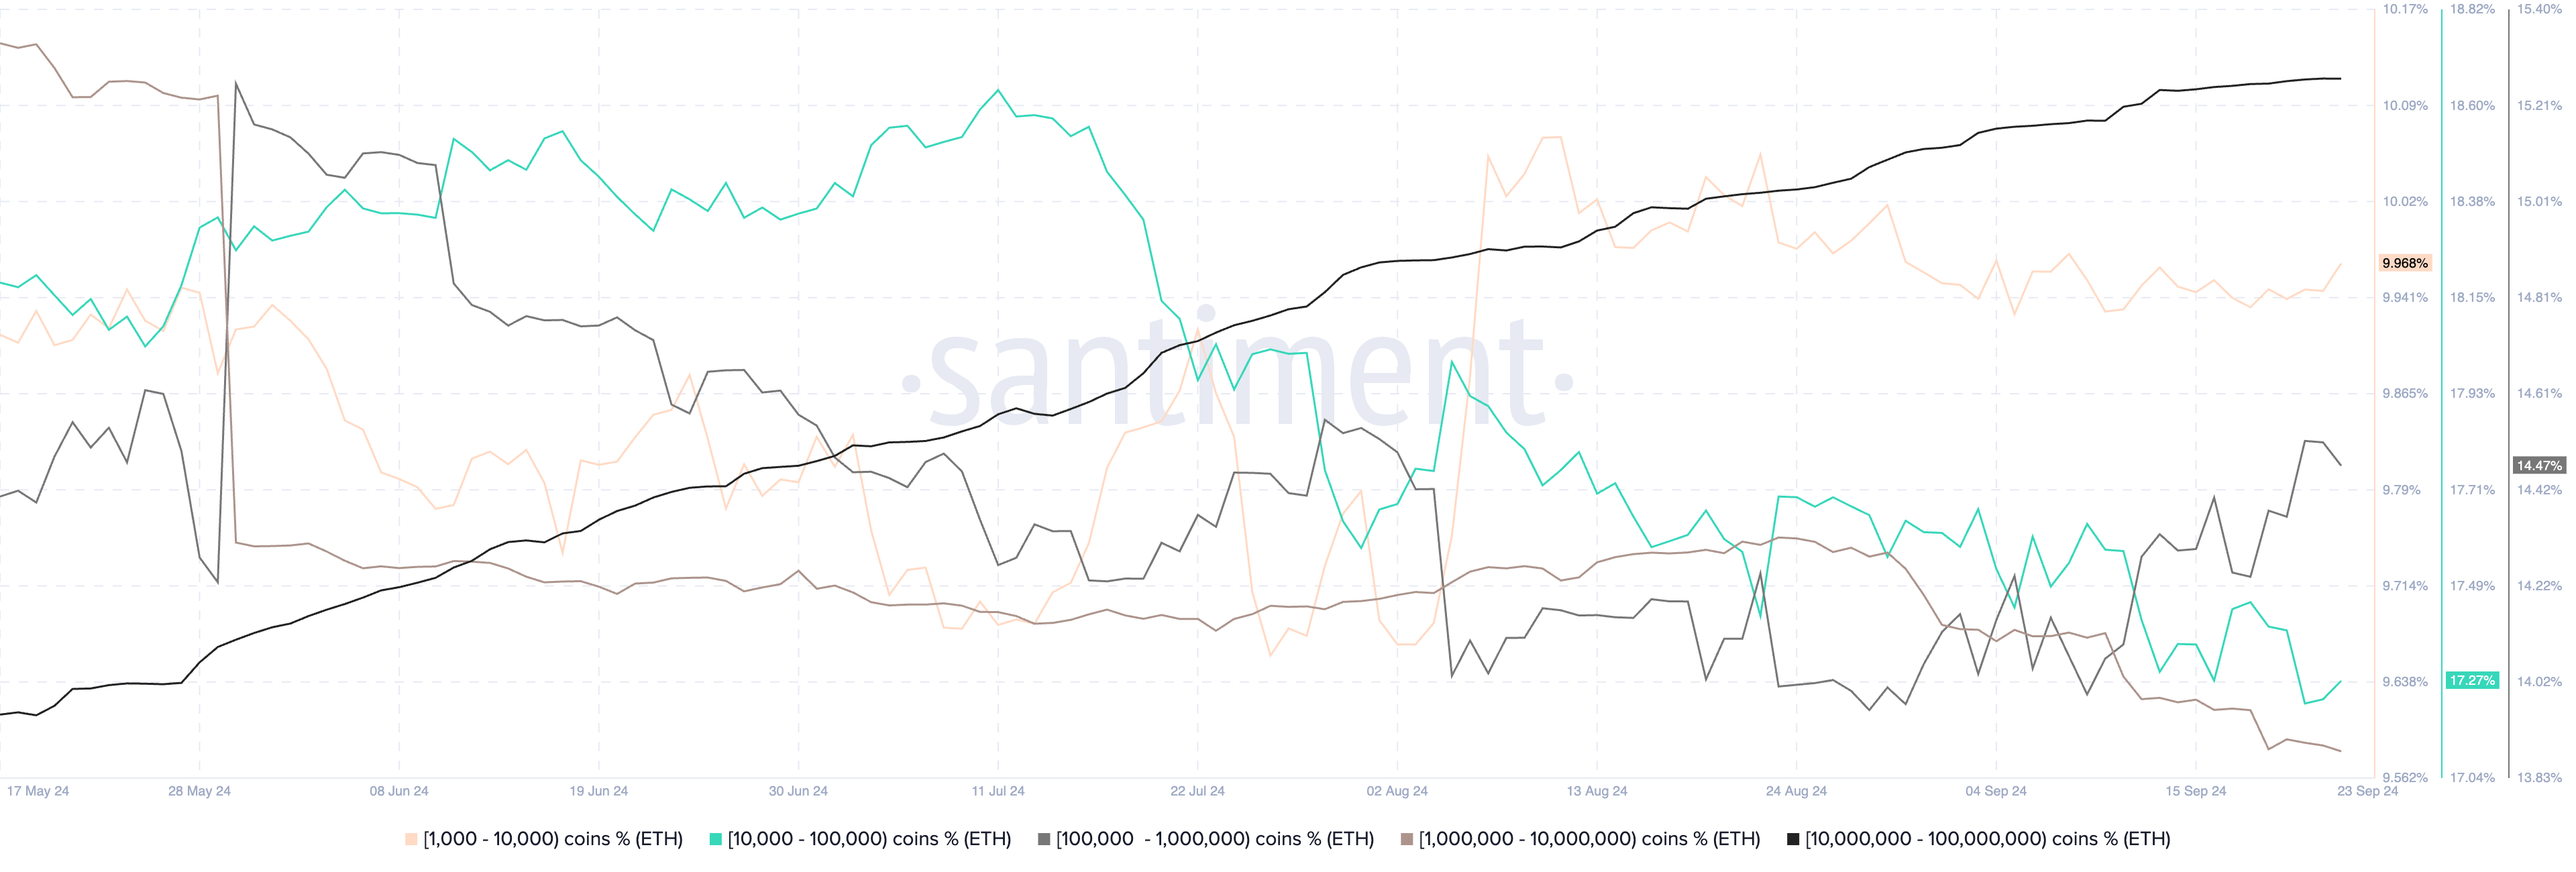
For instance, the Ether supply held by entities with a balance between 1 million and 10 million ETH (the brown wave) shows a downward trend in holdings, potentially indicative of sell-offs or reallocation of their assets to the lower cohort—those holding between 100,000 and 1 million ETH (the black wave).

Ethereum supply held by top whale cohorts

Ethereum supply held by top whale cohorts. Source: SantimentMeanwhile, the 10,000,000+ ETH cohort (the gray wave) is increasing their holdings, suggesting that the largest entities, which could include exchanges or Ethereum Foundation-related wallets, are accumulating.

Ethereum Technical Analysis: Rangebound Action Continues

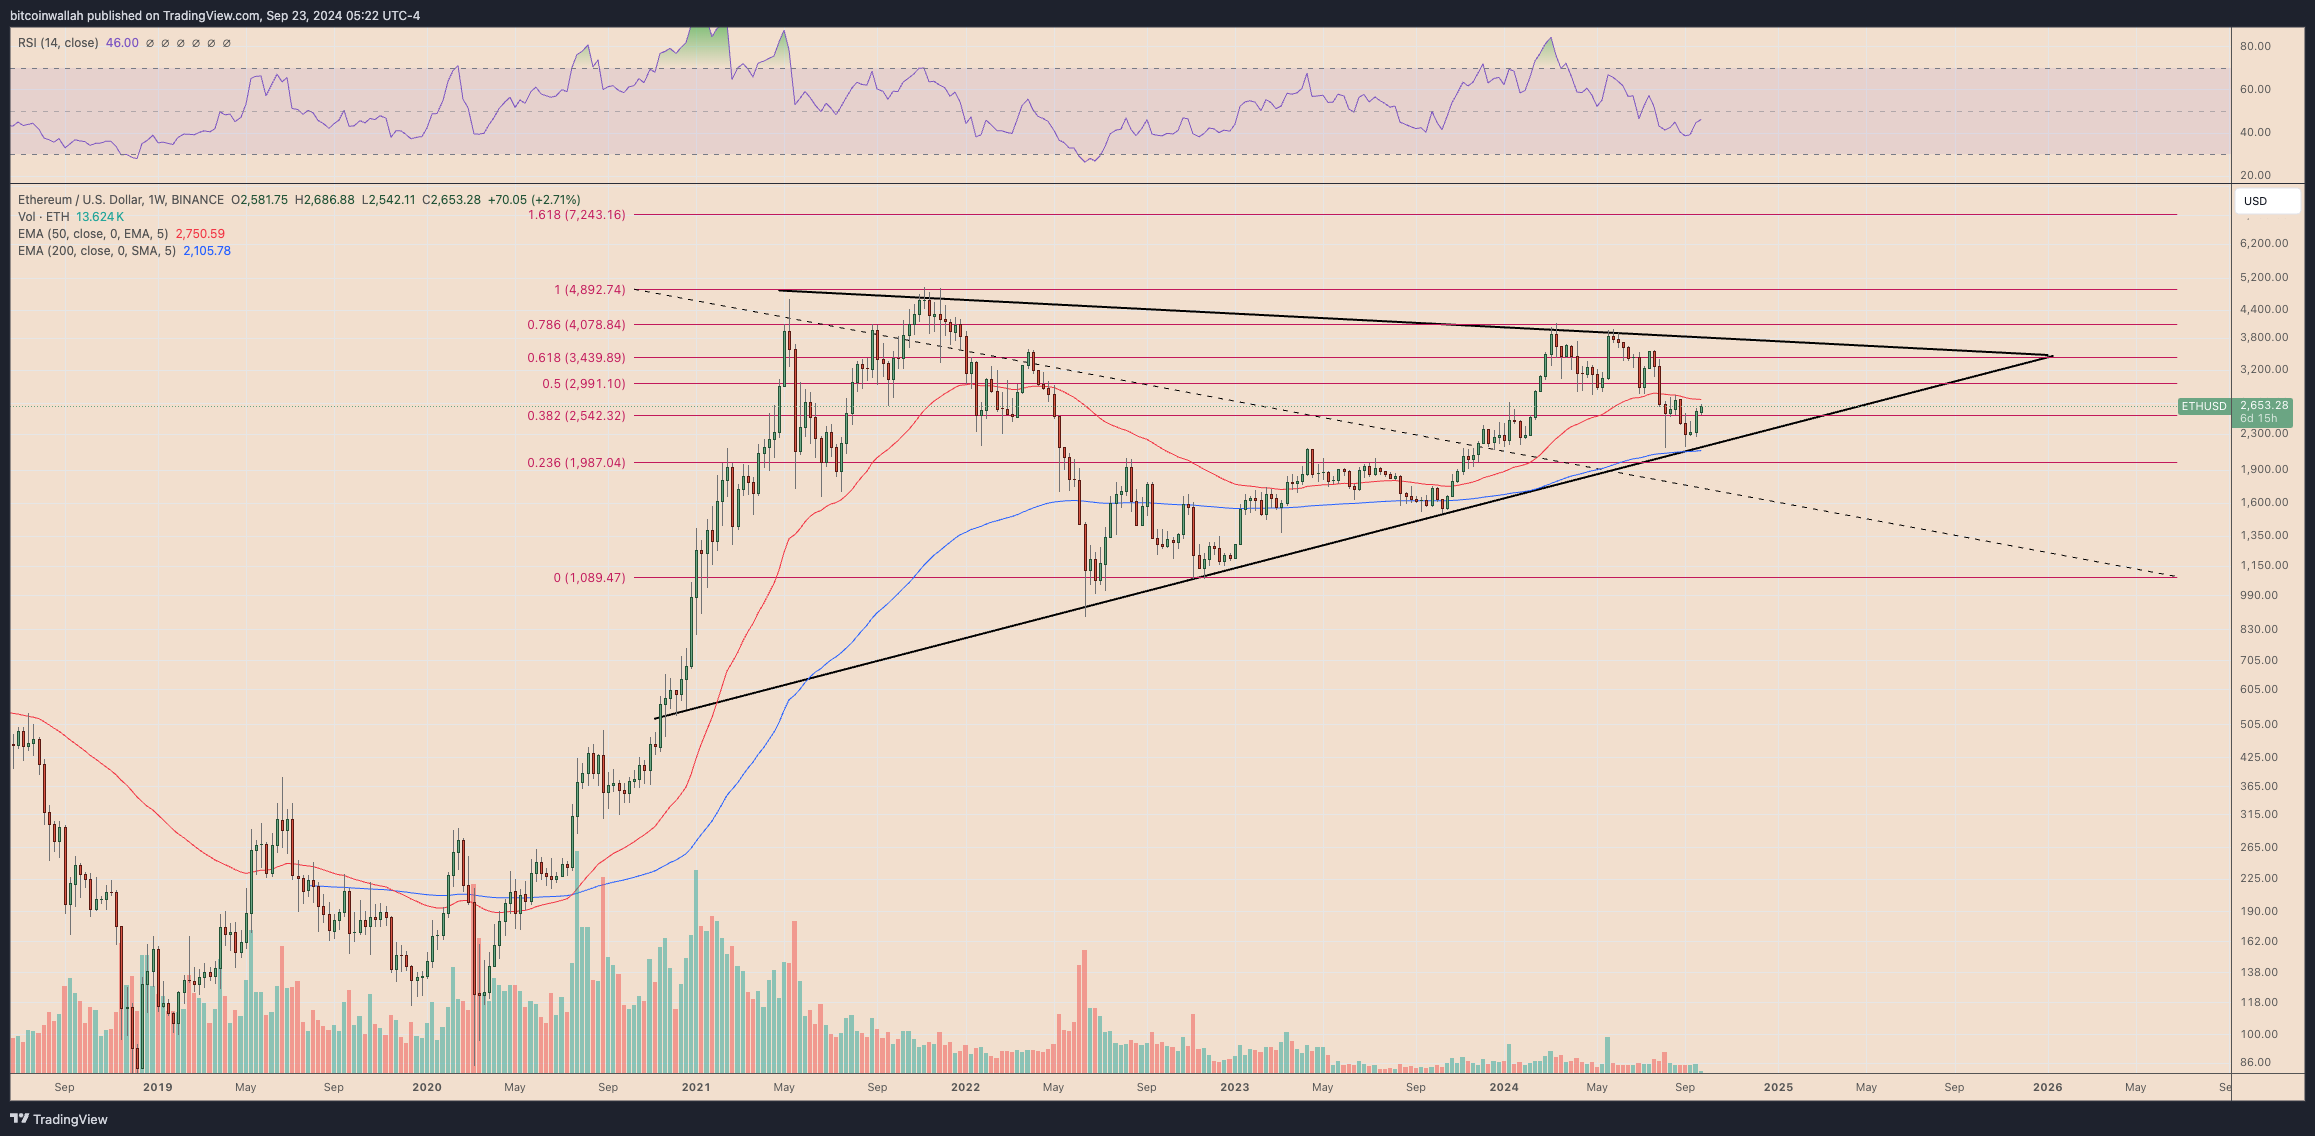
From a technical perspective, ETH’s price is trading inside a narrow weekly range defined by its 50-week exponential moving average (50-week EMA) at around $2,750 as resistance and the 200-week EMA (the blue wave) at around $2,105 as support.

ETH/USD weekly price chart
ETH/USD weekly price chart.
Recent moves increase ETH’s probability of pulling back from its $2,750 resistance to test the $2,105 support by October. Interestingly, the downside target aligns with the lower trendline of Ether’s prevailing triangle pattern.Therefore, breaking below the support confluence could risk crashing the ETH price toward the 0.236 Fibonacci retracement line at around $1,980. Conversely, a rebound could have bulls retest the 50-week EMA.

The Cryptocurrency Markets Paused Their Growth

The Cryptocurrency Markets Paused Their Growth

Ethereum Bounces Back as Bitcoin Hovers Below Key Level

The cryptocurrency market paused growth early in the day on Monday after last week’s resounding close, stabilising at $2.23 trillion (+8.8% in 7 days), which is near the previous peak. This means that further gains will be an important second signal for breaking the multi-month trend of lower local highs. Prior to fthis, we have seen a breaking of the sequence of lower local lows, which was the first signal of a trend change.

Bitcoin slipped to $64.4K on Monday morning, stabilising $1K lower at the time of writing. This tug-of-war near the 200-day simple moving average is in its fifth day. Monday saw the biggest move into territory above this curve. Still, traders should keep in mind last month’s moves when a strong seller attack came after two days of consolidation above this line, also at roughly the same height.

Experts Trade Bitcoin with IC Markets

Trading Derivatives carries a high level of risk to your capital and you should only trade with money you can afford to lose. Trading Derivatives may not be suitable for all investors, so please ensure that you fully understand the risks involved, and seek independent advice if necessary. A Product Disclosure Statement (PDS) can be obtained either from this website or on request from our offices and should be considered before entering into a transaction with us. Raw Spread accounts offer spread

Ethereum has rebounded solidly from its 200-week moving average, which could attract additional long-term buyers. At current levels near $2650, the immediate upside target looks to be the $2800 area, where the 50-week average passes.

The generally positive mood of the crypto market is indicated by the growing capitalisation of the stablecoin market since August, approaching $160bn after three months of fluctuations around $150bn.

Crypto News

According to SoSoValue, inflows into spot bitcoin-ETFs in the US last week totalled $397m after $403.8m the week before, bringing the total to $17.69bn. Ethereum-ETFs saw net outflows for the sixth week in a row, totalling $26.3m after $12.9m, bringing the total to $607.5m since approval.

CryptoQuant pointed to the reduction of BTC supply at the disposal of speculators to the minimum of 2012. Such dynamics can be interpreted as a lack of ‘fresh demand’, which could make it difficult for bitcoin to break out of its current price range.

MicroStrategy reported purchasing an additional 7,420 BTC for $458.2 million (at a price of ~$61,750 per coin) after selling $1bn worth of bonds. The firm already holds 252,220 BTC on its balance sheet, purchased for $9.9bn at an average rate of ~$39,266 per coin.

The US SEC has given expedited approval for the listing and trading of options on BlackRock’s bitcoin-ETF. Next, OCC and CFTC approval will be required before the official listing. Bloomberg speculated that options for other companies’ products will also be approved soon.

Project founder Justin Sun said commissions on the TRON network have fallen by 50%, which will boost network activity and meme-coin trading.

Germany’s PMI Falls to 7-Month Low, Sparking Eurozone Recession Fears in Manufacturing

Germany’s PMI Falls to 7-Month Low, Sparking Eurozone Recession Fears in Manufacturing

Germany’s Composite PMI Hits 7-Month Low in September

Germany’s private sector activity continued to decline in September, reflecting broader economic struggles in the euro zone’s largest economy. According to a joint report by S&P Global and Hamburg Commercial Bank (HCOB), Germany’s Composite PMI Output Index fell to 47.2 in September, down from 48.4 in August. This marked the lowest level in seven months, signaling deeper contraction.

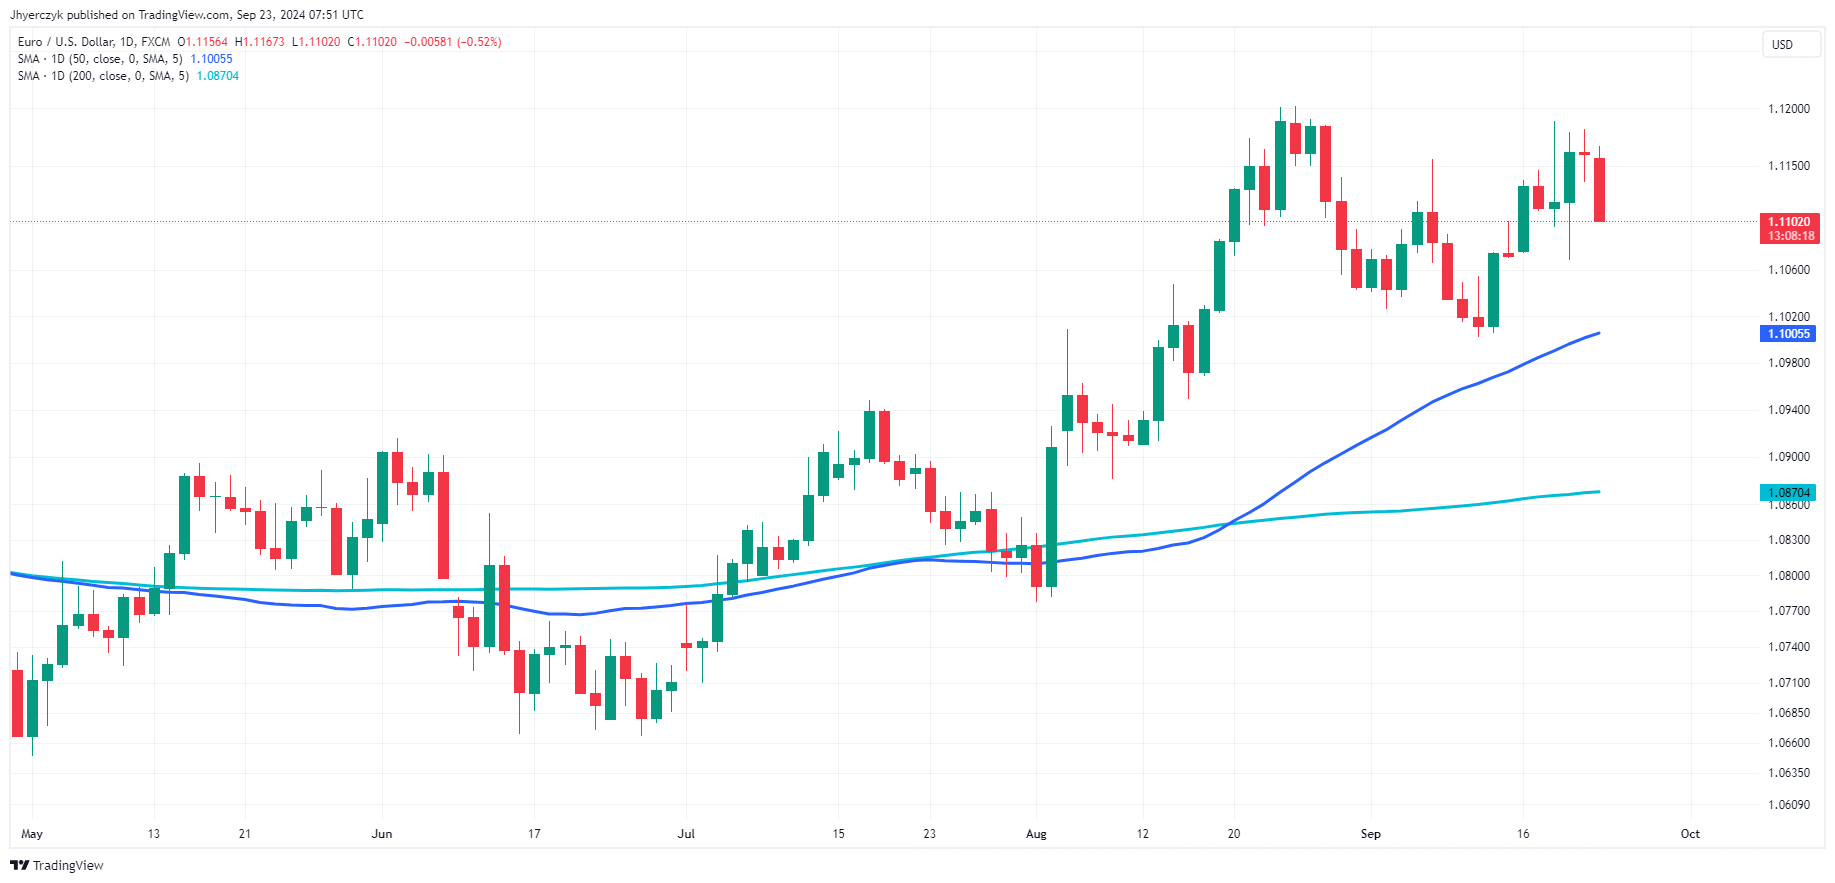
Daily EURUSD

Experts trade the markets with IC Markets

Trading Derivatives carries a high level of risk to your capital and you should only trade with money you can afford to lose. Trading Derivatives may not be suitable for all investors, so please ensure that you fully understand the risks involved, and seek independent advice if necessary. A Product Disclosure Statement (PDS) can be obtained either from this website or on request from our offices and should be considered before entering into a transaction with us. Raw Spread accounts offer spread

Sharp Contraction in Manufacturing

Germany’s manufacturing sector faced the sharpest decline in a year. The Manufacturing PMI dropped to 40.3 in September, a significant decrease from 42.8 in August. This 12-month low came in well below analysts’ expectations of 42.3, reinforcing concerns about the sector’s health. Manufacturing output in Germany has been in decline for several months, with no signs of imminent recovery.

Cyrus de la Rubia, chief economist at Hamburg Commercial Bank, commented on the persistent downturn, saying, “The downturn in the manufacturing sector has deepened again, evaporating any hope for an early recovery.” The sector’s struggles have been a drag on Germany’s overall economic performance, with weakness beginning to seep into other areas of the economy.

Services Sector Slows Down

Although the services sector continued to grow, it showed signs of fatigue. The Services PMI Business Activity Index slipped to 50.6 in September, down from 51.2 in August. While still technically in expansion, the services sector’s growth has slowed for the fourth consecutive month. Economists had forecast a smaller drop to 51.0, indicating that the sector is feeling the impact of broader economic challenges.

The decline in services suggests that the ongoing industrial slowdown is beginning to affect other areas of the economy. De la Rubia noted that “the slump in manufacturing is beginning to spill over into Germany’s services sector,” which accounts for a significant portion of the country’s economic activity.

Economy Likely in Recession

The weak PMI data points to further economic contraction for Germany. With the economy shrinking by 0.1% in the second quarter, economists believe the third quarter will see a similar downturn, confirming a technical recession. De la Rubia forecasted a 0.2% contraction for Q3, marking two consecutive quarters of decline.

The composite index tracks both manufacturing and services, which together represent more than two-thirds of the German economy. The ongoing downturn in both sectors paints a bleak picture for Germany’s economic prospects in the near term.

Market Outlook: Bearish

Based on the latest data, the outlook for Germany’s economy remains bearish. With manufacturing in a deep slump and services growth faltering, it is likely that the German economy will continue to contract in the coming months. The prospect of a technical recession adds further downward pressure, suggesting little relief for traders looking at German markets in the short term. Expect continued weakness in German equities and a challenging environment for the euro.

Gold (XAU) Daily Forecast: Bullish Momentum Targets $2,600 Amid Fed Rate Cuts

Gold (XAU) Daily Forecast: Bullish Momentum Targets $2,600 Amid Fed Rate Cuts

Market Overview

Gold prices (XAU/USD) are on an upward trend for the second consecutive day, approaching the record high of $2,595. This surge comes on the heels of the Federal Reserve’s significant interest rate cut earlier in the week.

Fed officials have signalled the possibility of another 50 basis points reduction in borrowing costs by year-end, which is exerting pressure on the US Dollar (USD), currently hovering near its year-to-date lows.

Experts trade the markets with IC Markets

Trading Derivatives carries a high level of risk to your capital and you should only trade with money you can afford to lose. Trading Derivatives may not be suitable for all investors, so please ensure that you fully understand the risks involved, and seek independent advice if necessary. A Product Disclosure Statement (PDS) can be obtained either from this website or on request from our offices and should be considered before entering into a transaction with us. Raw Spread accounts offer spread

With the dollar weakening, gold—often considered a safe-haven asset—has gained fresh appeal as a reliable store of value.

Gold Gains Appeal Amid US Dollar Weakness and Economic Concerns

The US dollar is losing ground following the Fed’s aggressive monetary policy. The 50 basis points rate cut this week has made the dollar less attractive to investors. Fed officials have hinted at further cuts, with borrowing rates potentially dropping to 3.4% in 2025 and 2.9% by 2026.

This outlook bolsters gold’s attractiveness, as lower interest rates tend to diminish the dollar’s strength, making non-yielding assets like gold more appealing.

Positive economic data, such as a drop in weekly jobless claims to 219,000—the lowest since May—and an unexpected rise in the Philadelphia Fed’s manufacturing index from -7.0 to 1.7, haven’t provided much support for the dollar.

Concerns over economic growth persist, especially with the Fed’s aggressive monetary policy and signs of a slowdown in China.

Increased Demand for Gold Amid Economic and Geopolitical Uncertainty

In addition to the Fed’s policy decisions, concerns over economic slowdowns in both the US and China are adding upward pressure on gold prices.

These concerns are further compounded by ongoing geopolitical tensions, especially in the Middle East and continued instability in Eastern Europe.

Political uncertainty in the US as the presidential election approaches has also contributed to gold’s recent gains. As the global economic and political landscape remains unpredictable, demand for gold is likely to stay elevated.

Analysts predict that gold prices could continue their upward trajectory, surpassing the $2,600 mark in the coming weeks, fueled by a weakening dollar and increased investor interest in safe-haven assets.

Short-Term Forecast

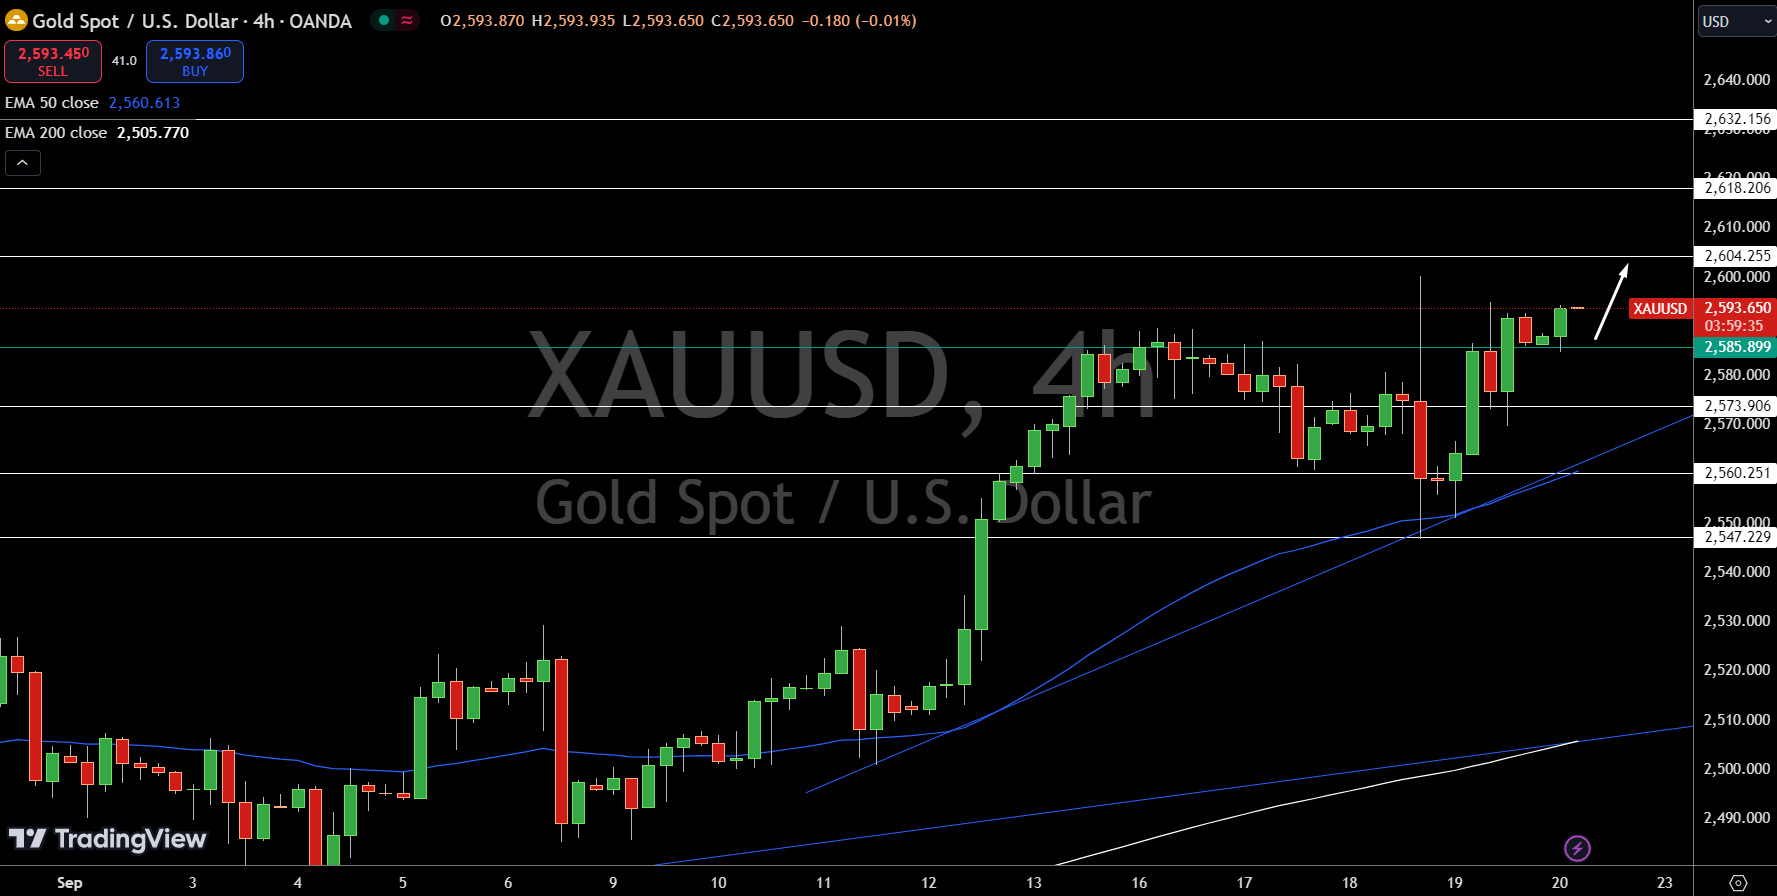
Gold (XAU/USD) continues its upward trend, nearing $2,595. With key support at $2,585 and resistance at $2,604, bullish momentum may persist, driven by a weak USD and Fed rate cuts.

Gold Prices Forecast: Technical Analysis

Gold – Chart

Gold – ChartGold (XAU/USD) is trading at $2,593.65, up 0.23%, showing continued strength. The pivot point at $2,585.89 is acting as a key support level, helping to maintain the upward momentum. Immediate resistance is seen at $2,604.25, followed by $2,618.20 and $2,632.15. On the downside, key support levels include $2,573.90, $2,560.25, and $2,547.22.

The 50-day EMA at $2,560.61 reinforces near-term support, while the 200-day EMA at $2,505.77 reflects the broader bullish trend.

A recent bullish engulfing candle adds to the positive outlook, suggesting potential for further gains. However, if gold breaks below the $2,585 pivot, selling pressure could intensify, shifting the short-term trend.

Diverging Central Bank Strategies: Fed, BoE, and BoJ Face Inflation and Market Risks

Diverging Central Bank Strategies: Fed, BoE, and BoJ Face Inflation and Market Risks

Federal Reserve, Bank of England, and Bank of Japan: Diverging Approaches

The Federal Reserve, Bank of England (BoE), and Bank of Japan (BoJ) are adopting different strategies to address inflation and economic growth. Their recent decisions highlight contrasting approaches shaped by the unique challenges each economy faces.

The Federal Reserve: Cutting Rates Aggressively

The U.S. Federal Reserve recently cut its benchmark interest rate by 50 basis points to 4.75%-5.0%. The move reflects confidence that inflation is under control, but it aims to prevent a slowdown in the labor market. Despite a strong economy, the Fed is preemptively lowering rates to avoid future weakness.

Experts trade the markets with IC Markets

Trading Derivatives carries a high level of risk to your capital and you should only trade with money you can afford to lose. Trading Derivatives may not be suitable for all investors, so please ensure that you fully understand the risks involved, and seek independent advice if necessary. A Product Disclosure Statement (PDS) can be obtained either from this website or on request from our offices and should be considered before entering into a transaction with us. Raw Spread accounts offer spread

However, this aggressive rate cut raises concerns about potential overheating. By lowering rates when the U.S. economy remains robust, the Fed risks increasing demand, which could push commodity and consumer prices higher. Additionally, the rapid cut could heighten market volatility, as traders may react unpredictably to further rate changes.

Bank of England: Cautious Approach

The Bank of England is maintaining a more cautious stance. At its latest meeting, the BoE held interest rates at 5.0%, prioritizing inflation control over immediate rate cuts. While inflation has eased, high wage growth in the U.K. could sustain price pressures, making policymakers reluctant to cut rates too soon.

Catherine Mann, a member of the Monetary Policy Committee, emphasized the need to keep rates elevated until inflation risks subside. The BoE’s cautious approach contrasts with the Fed’s aggressive cuts, as the central bank seeks to prevent any resurgence in inflation before easing its policies.

Bank of Japan: Holding Steady

The Bank of Japan took a different approach by keeping its interest rate unchanged at 0.25%. Japan’s inflation is significantly lower than that of the U.S. and U.K., and its economy is growing at a slower pace. The BoJ is focused on maintaining stability while allowing inflation to gradually reach its 2% target.

Governor Kazuo Ueda indicated that the BoJ may raise rates if inflation remains on track, but the central bank is proceeding cautiously. This contrasts with the Fed’s rapid rate cuts and the BoE’s more conservative approach, as the BoJ prioritizes stability in Japan’s slower economic recovery.

Market Risks and Stability

The Fed’s aggressive cuts carry the most significant risk of market volatility. Lower rates in a strong economy could fuel speculative behavior and create turbulence. The BoE’s cautious stance aims for more stability but keeps interest rates higher for longer, which could weigh on growth. The BoJ’s steady policy reflects its slower inflation and growth environment, offering more stability but slower recovery.

Conclusion

While the Fed cuts rates to sustain growth, the BoE holds firm to control inflation, and the BoJ remains cautious as Japan’s economy gradually recovers. These different strategies reflect their respective economic conditions but share the common goal of balancing growth with inflation control.

Silver (XAG) Daily Forecast: Surging Solar Demand in China Pushes Prices 10% Higher Globally

Silver (XAG) Daily Forecast: Surging Solar Demand in China Pushes Prices 10% Higher Globally

Market Overview

Silver prices (XAG/USD) continued their upward momentum for the second consecutive day, trading around $31.18 on Friday. This surge follows the U.S. Federal Reserve’s decision earlier this week to cut interest rates by 50 basis points, a move designed to preempt inflationary pressures.

The rate cut has boosted demand for silver as investors seek safe-haven assets amid a softer U.S. Dollar and heightened economic uncertainty.

Experts trade the markets with IC Markets

Trading Derivatives carries a high level of risk to your capital and you should only trade with money you can afford to lose. Trading Derivatives may not be suitable for all investors, so please ensure that you fully understand the risks involved, and seek independent advice if necessary. A Product Disclosure Statement (PDS) can be obtained either from this website or on request from our offices and should be considered before entering into a transaction with us. Raw Spread accounts offer spread

Silver’s Volatility After the Fed Rate Cut

Following the Fed’s decision on September 18, silver saw significant price swings. Initially, prices spiked to a new high of $31.20. During his press conference, Fed Chairman Jerome Powell emphasized the need to control inflation, downplaying concerns about a recession while highlighting the strength of the U.S. job market.

He also indicated that further rate cuts would be assessed on a case-by-case basis.

Despite the Fed’s measured stance, silver prices retreated nearly 5%, dropping to $29.70 as U.S. Treasury yields and the Dollar Index gained strength. However, in the following sessions, silver rebounded sharply, climbing back to $31.29. This illustrates silver’s enduring appeal as a hedge against economic instability.

China’s Strong Demand Boosts Silver Prices

A key factor supporting silver prices is the robust demand in China, where prices are nearly 10% higher than international rates. This premium is driven by China’s thriving solar panel industry and strong import activity.

The People’s Bank of China (PBoC) kept its one-year Loan Prime Rate (LPR) steady at 3.35%, further supporting economic stability and continued demand for silver.

Meanwhile, the Bank of Japan and Bank of England also maintained their interest rates at 0.15% and 5%, respectively, reflecting a global trend of cautious monetary policies.

Outlook: Economic Uncertainty and Silver’s Safe-Haven Appeal

With geopolitical tensions adding further complexity to the global outlook, silver remains an attractive safe-haven asset. As demand in China continues to rise and economic uncertainty persists, silver is well-positioned to maintain its upward trajectory.

Short-Term Forecast

Silver (XAG/USD) continues its bullish momentum, trading at $31.18. Strong support from robust demand in China and a weaker U.S. Dollar fuel its rally.

Silver (XAG/USD) Price Forecast: Technical Outlook

Silver – Chart
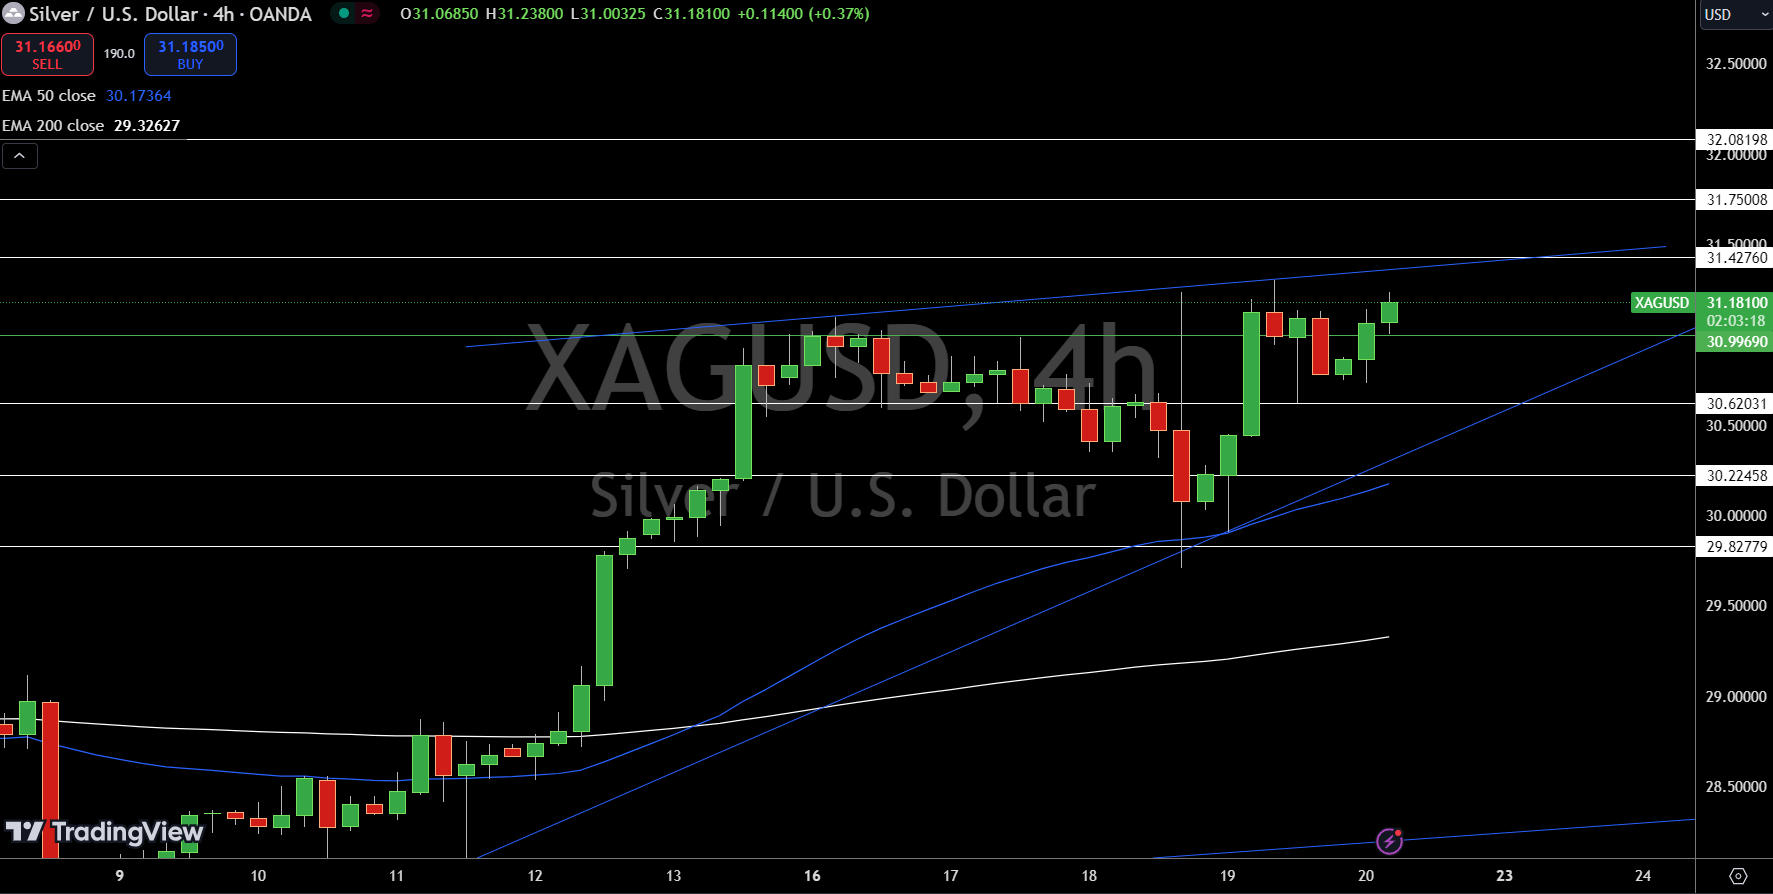
Silver – ChartSilver (XAG/USD) is trading at $31.18, up 0.83%, continuing its bullish momentum after bouncing off the pivot point at $30.99. Immediate resistance is found at $31.42, followed by $31.75, while support is seen at $30.62.

The 50-day EMA at $30.17 and the 200-day EMA at $29.32 indicate a strong upward trend, supporting silver’s recent gains.

With the bullish formation intact, any break above $31.42 could further propel silver toward $31.75. However, a decline below $31 might trigger a short-term selloff.

US Dollar Price Forecast: UK Retail Sales Surprise; GBP/USD and EUR/USD Outlook

US Dollar Price Forecast: UK Retail Sales Surprise; GBP/USD and EUR/USD Outlook

US Dollar Rises on Strong Jobs Data, Fed in Focus

The US dollar strengthened after positive economic data on Thursday. Unemployment claims dropped to 219K, beating expectations of 230K, signalling a robust labour market. The Philly Fed Manufacturing Index was also surprised with a reading of 1.7, well above the forecast of -0.8, showing unexpected manufacturing strength.

However, existing home sales came in lower than anticipated at 3.86M, adding mixed signals to the broader economy.  Investors are now eyeing Federal Reserve member Harker’s upcoming speech on Friday, which could provide further clues on future monetary policy and impact the dollar’s near-term direction.

Experts trade the markets with IC Markets

Trading Derivatives carries a high level of risk to your capital and you should only trade with money you can afford to lose. Trading Derivatives may not be suitable for all investors, so please ensure that you fully understand the risks involved, and seek independent advice if necessary. A Product Disclosure Statement (PDS) can be obtained either from this website or on request from our offices and should be considered before entering into a transaction with us. Raw Spread accounts offer spread

US Dollar Index (DXY) – Technical Analysis 

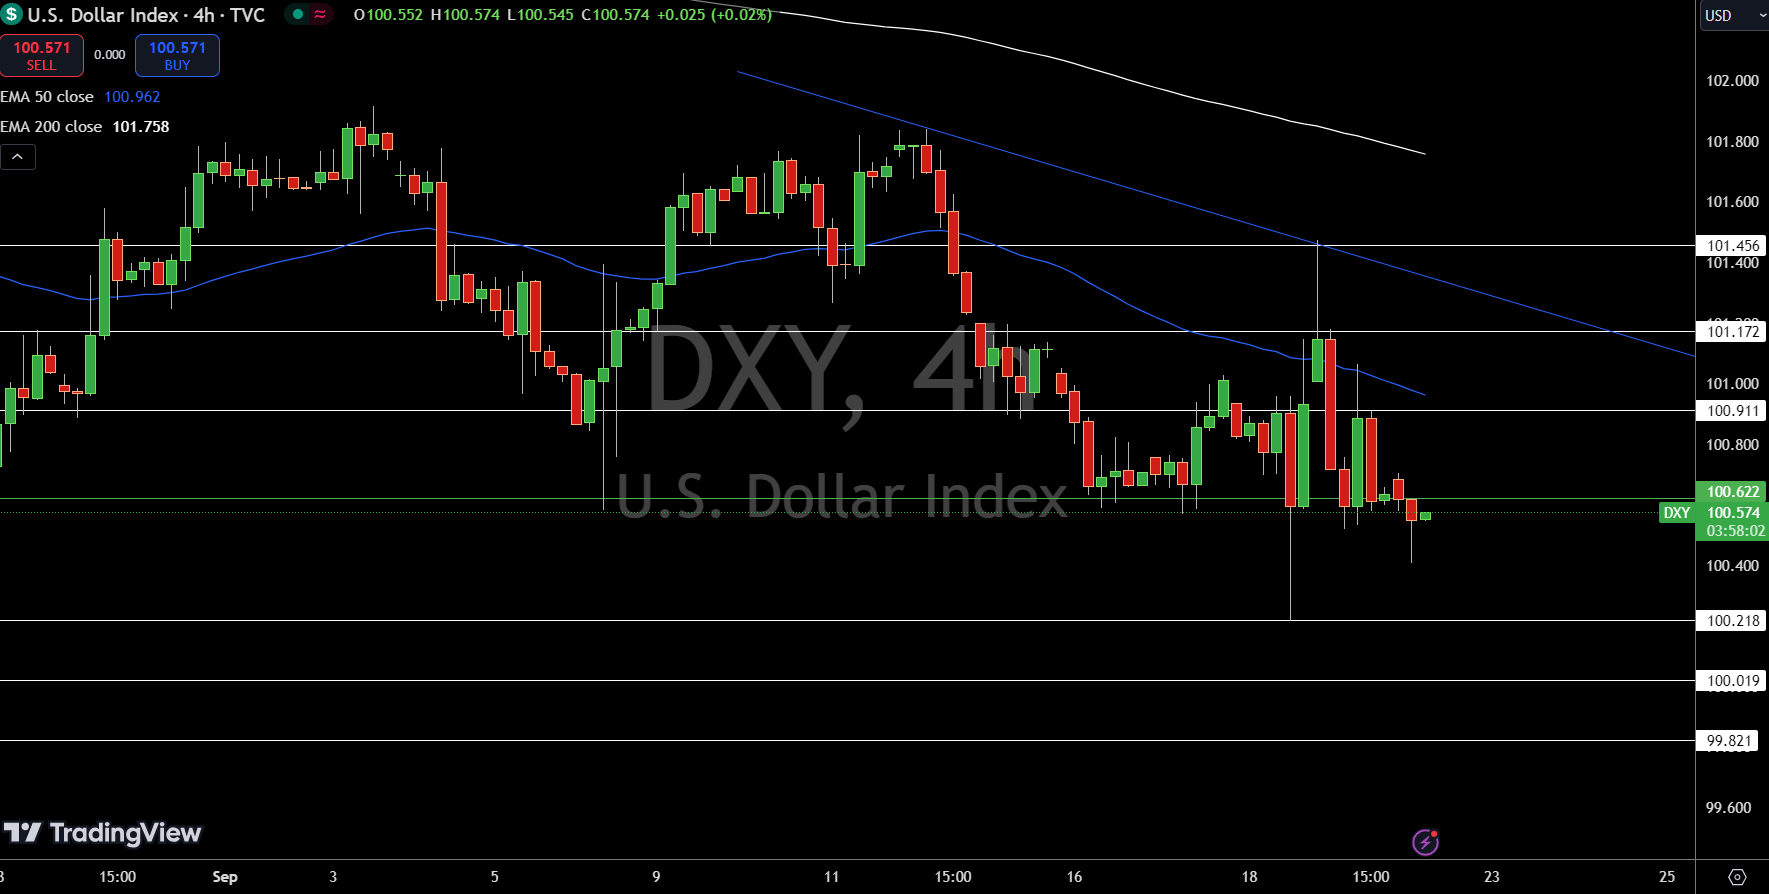
The Dollar Index (DXY) is trading at $100.574, down 0.10%, indicating a slight bearish momentum. The price is hovering just below its pivot point at $100.62, which serves as a key resistance level. Immediate resistance is $100.91, followed by $101.17 and $101.46.

On the downside, immediate support is located at $100.22, with further levels at $100.02 and $99.82.

Dollar Index Price Chart - Source: Tradingview
Dollar Index Price Chart – Source: TradingviewThe 50-day EMA at $100.96 suggests continued near-term weakness, while the 200-day EMA at $101.76 reinforces the broader bearish outlook.

As long as the Dollar Index remains below $100.62, selling pressure may persist, but a break above this level could shift the sentiment to bullish.

Sterling Steady After Strong Retail Sales Data

The British pound held firm after the latest UK retail sales data showed a stronger-than-expected rise of 1.0% in August, beating forecasts of 0.3%. This positive surprise comes amid a backdrop of steady monetary policy, with the Bank of England holding interest rates at 5.00%.

The Monetary Policy Committee (MPC) voted 0-1-8, reflecting a divided stance on future rate hikes. While consumer spending continues to support the economy, the split in voting suggests uncertainty about the future path of rate adjustments.

GBP/USD Technical Forecast

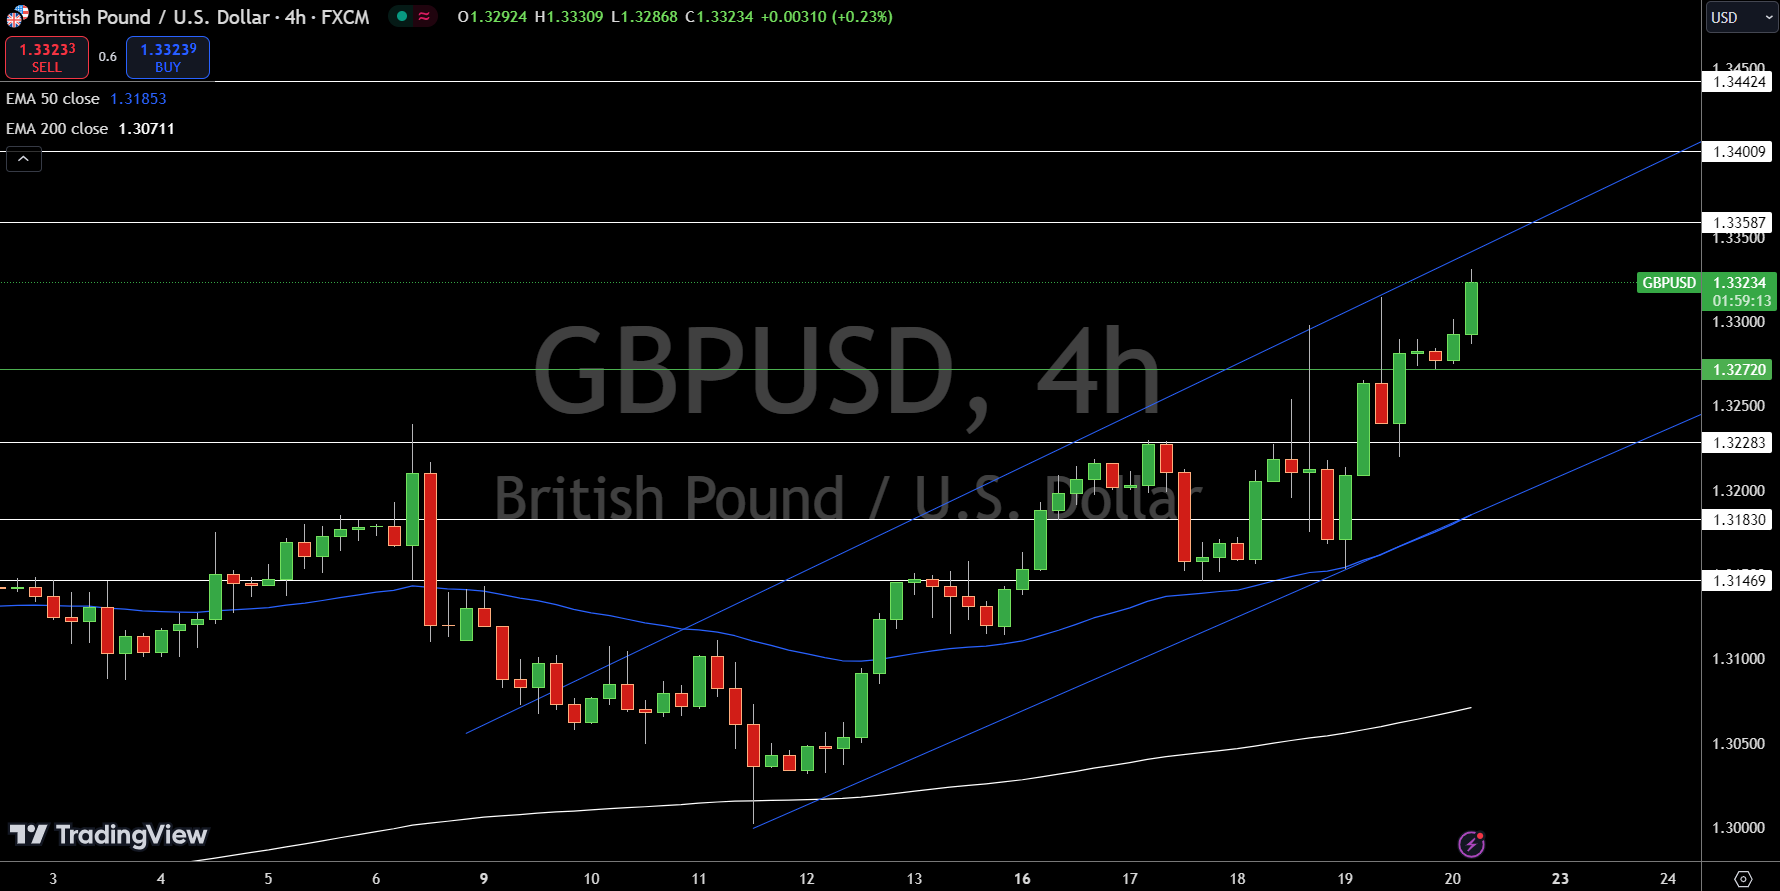
The GBP/USD is trading at $1.33234, up 0.10%, signaling modest bullish momentum. The pair is comfortably holding above the pivot point of $1.32720, which is acting as a crucial support level.

Immediate resistance is at $1.33587, followed by $1.34009 and $1.34424, should the bullish trend continue.

GBP/USD Price Chart - Source: Tradingview
GBP/USD Price Chart – Source: TradingviewOn the downside, key support lies at $1.32283, with further levels at $1.31830 and $1.31469. The 50-day EMA at $1.31853 provides strong near-term support, while the 200-day EMA at $1.30711 underlines the broader bullish sentiment.

As long as GBP/USD stays above $1.32720, the outlook remains positive, but a break below this level could trigger a shift towards a bearish trend.

Euro Awaits Lagarde Speech Amid Mixed Data Signals

The euro remained stable as investors focused on upcoming remarks from ECB President Christine Lagarde. Earlier data showed a mixed economic picture, with Germany’s current account surplus narrowing to €39.6B, below expectations of €40.3B.

Additionally, Germany’s Producer Price Index (PPI) for September is forecasted to rise by 0.2%, in line with previous figures. Later today, the Consumer Confidence index is expected to hold steady at -13.

Market participants are closely watching these indicators and Lagarde’s speech for insights into the ECB’s monetary stance, especially amid growing concerns about economic growth across the Eurozone.

EUR/USD Technical Forecast

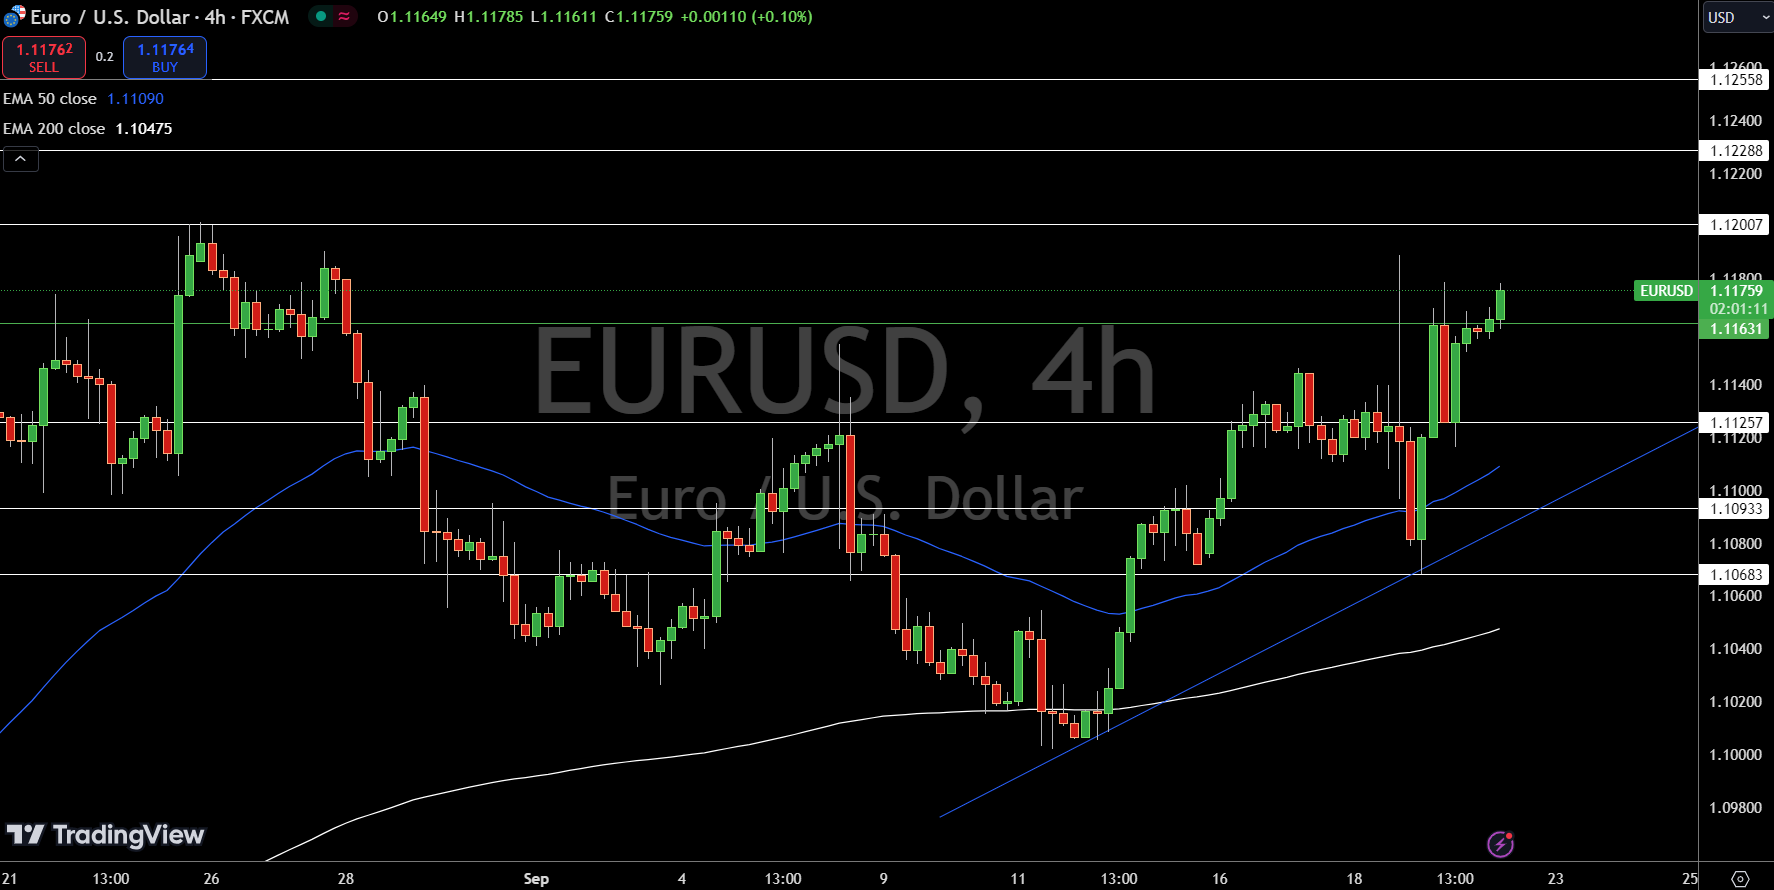
The EUR/USD is trading at $1.11759, up by 0.04%, maintaining a slightly bullish trend. The pivot point at $1.11631 is acting as a crucial support level, and the pair is hovering just above it.

Immediate resistance stands at $1.12007, followed by $1.12288 and $1.12558. On the downside, key support levels are found at $1.11257 and $1.10933.

EUR/USD Price Chart - Source: TradingView
EUR/USD Price Chart – Source: TradingViewThe 50-day EMA at $1.11090 provides solid near-term support, reinforcing the bullish sentiment, while the 200-day EMA at $1.10475 reflects a broader uptrend. The bullish bias remains strong above $1.11631, but any break below this level could trigger a sharper selloff.

XRP News Today: SEC vs. Ripple Appeal Window Tightens, XRP Faces Volatility

XRP News Today: SEC vs. Ripple Appeal Window Tightens, XRP Faces Volatility

XRP Falls Short of $0.60

On Thursday, September 19, XRP gained 0.29%, following a rise of 0.17% from the previous day to close at $0.5874. However, despite the upswing, XRP underperformed the broader crypto market, which advanced by 2.24%, taking the total market cap to $2.129 trillion.

Hopes of a US soft economic landing drove buyer demand for riskier assets as investors reacted to US economic data.

Experts trade the markets with IC Markets

Trading Derivatives carries a high level of risk to your capital and you should only trade with money you can afford to lose. Trading Derivatives may not be suitable for all investors, so please ensure that you fully understand the risks involved, and seek independent advice if necessary. A Product Disclosure Statement (PDS) can be obtained either from this website or on request from our offices and should be considered before entering into a transaction with us. Raw Spread accounts offer spread

SEC vs. Ripple: Appeal Uncertainty Lingers

Uncertainty surrounding the finality of the SEC vs. Ripple case remained an XRP headwind on Thursday, capping gains relative to the broader market.

On August 7, 2023, Judge Torres delivered the final judgment, ordering Ripple to pay a $125 million fine for breaching US securities laws and to comply with US securities laws going forward. The SEC had asked for a whopping $2 billion penalty and an injunction prohibiting XRP sales to institutional investors.

Speculation about the agency possibly appealing rulings from the Ripple case continued to impact XRP demand. This month, Ripple filed for a stay (suspension) on the $125 million final judgment, fueling market speculation about a possible SEC appeal.

In 2023, well before the final judgment, the SEC attempted to appeal the Programmatic Sales of XRP ruling by filing a motion for interlocutory appeal. However, the court rejected the motion in October 2023. The court ruling meant that the SEC had to wait until the final judgment before filing an appeal.

SEC Intensifies Crypto Scrutiny

On Wednesday, SEC Chair Gary Gensler reiterated the agency’s stance on cryptos, warning that the field is rife with fraudsters, scammers, and grifters. Chair Gensler also dismissed claims about a lack of regulatory clarity, stating that US securities laws have given clarity for 90 years.

Gensler’s comments suggested the agency intends to continue pursuing players within the digital asset space despite a lack of a crypto regulatory framework.

While the SEC keeps the heat on crypto firms, Congress is turning up the heat on the SEC’s approach to regulating cryptos.

Digital Asset Security Debate

On Thursday, Republican Congressman Ritchie Torres shared coverage from a session in Congress, stating,

“The term ‘digital asset security’ does not appear anywhere in any law enacted by Congress or in any rule promulgated by the SEC or in any decision rendered by the Supreme Court. It appears nowhere in the 2 million pages of the Federal Register. If it comes from neither statute nor rule, then where does it come from? The SEC invented the term out of thin air.”

Ripple Chief Legal Officer Stuart Alderoty remarked on Torres’s comments, saying,

“The SEC has a pattern of using the made-up term ‘crypto asset security’ to mislead judges—and it’s catching up with them. Thank you, Congressman Ritchie Torres.”

On September 13, 2024, the SEC sought permission from the court to amend the Binance complaint. Significantly, the SEC wanted to clarify its position on crypto asset securities, stating the agency did not refer to the crypto asset itself as a security and would cease to use the term to avoid confusion. The SEC has faced intense scrutiny since the filing, leading to Congressman Torres’s comments.

Next week, all five SEC Commissioners will give testimony on regulatory practices at a US House Committee on Financial Services committee hearing. The matter of cryptos as securities and the SEC’s ongoing assault on the US digital asset space will likely be talking points.

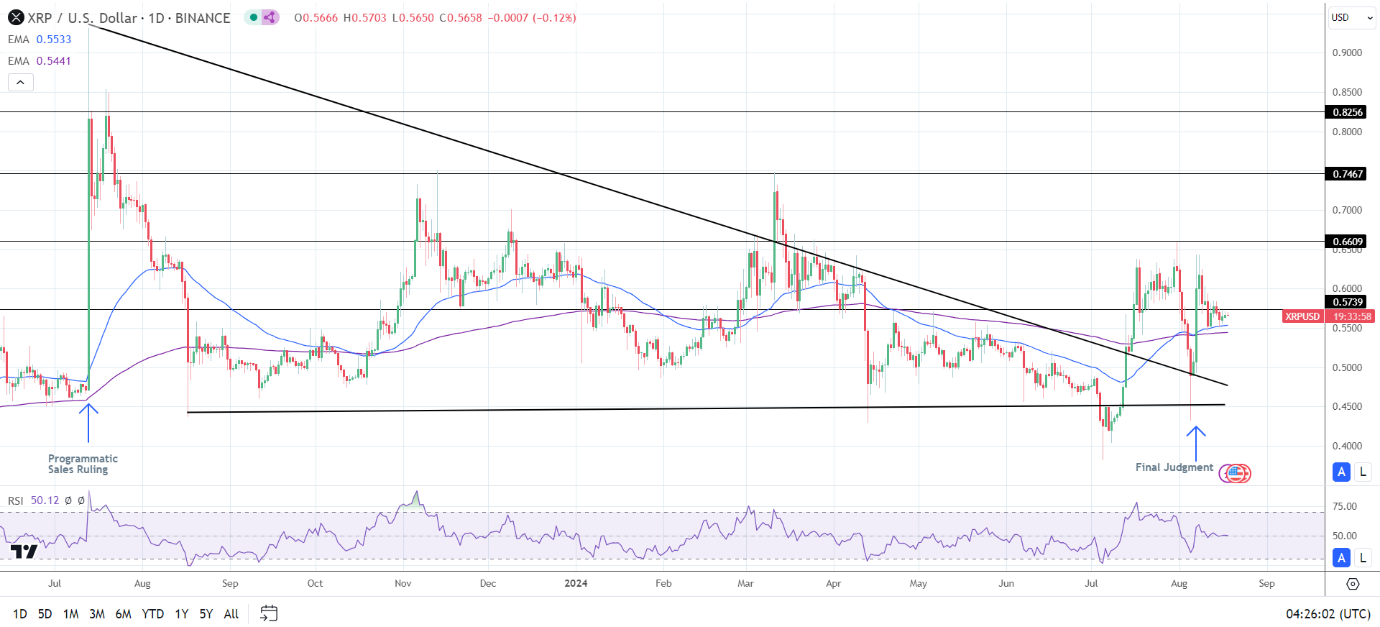
Price trends remain heavily dependent on whether the SEC appeals rulings from the Ripple case. If the SEC appeals, XRP may drop below $0.40. Conversely, XRP could target $1.00 if the SEC does not file an appeal notice, mirroring the market’s response to the Programmatic Sales of XRP ruling.

XRP reactions to rulings.
XRPUSD Reaction to Court RulingsInvestors should closely monitor appeal-related news, which could significantly impact XRP price trends. Stay informed on the latest legal developments to capitalize on XRP’s potential price movements.

XRP Price Action

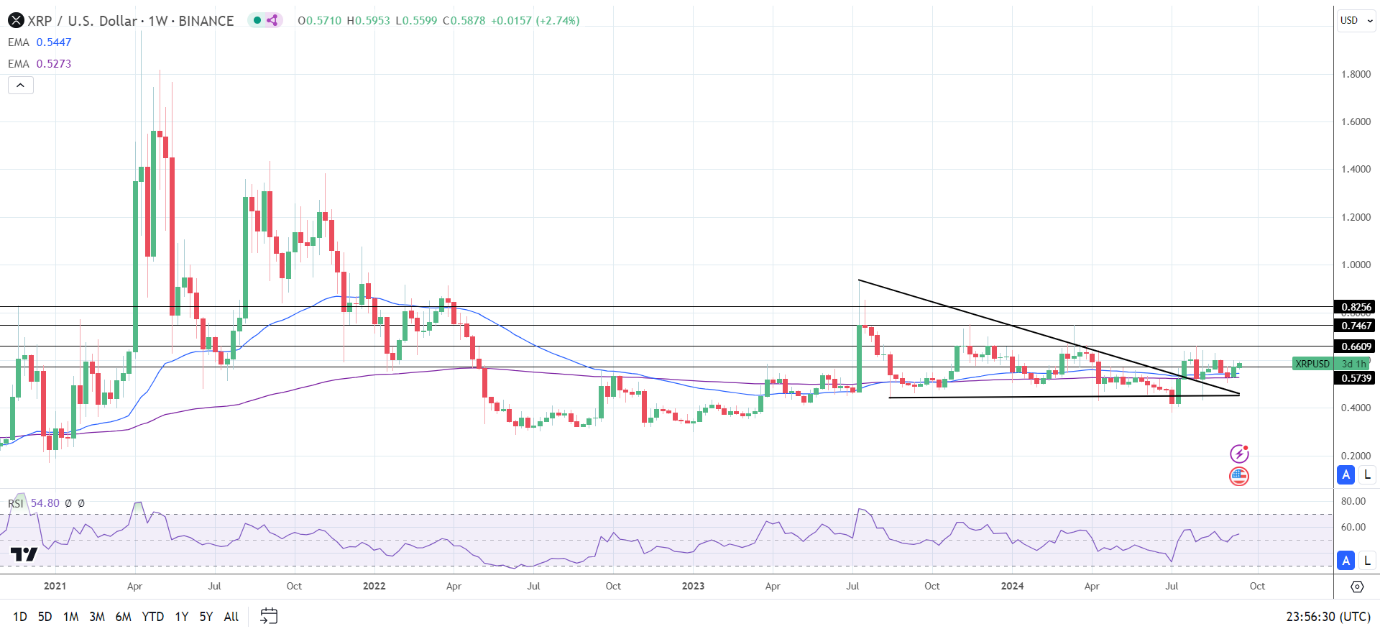
XRP Weekly Chart sends bullish price signals.
XRPUSD 200924 Weekly Chart

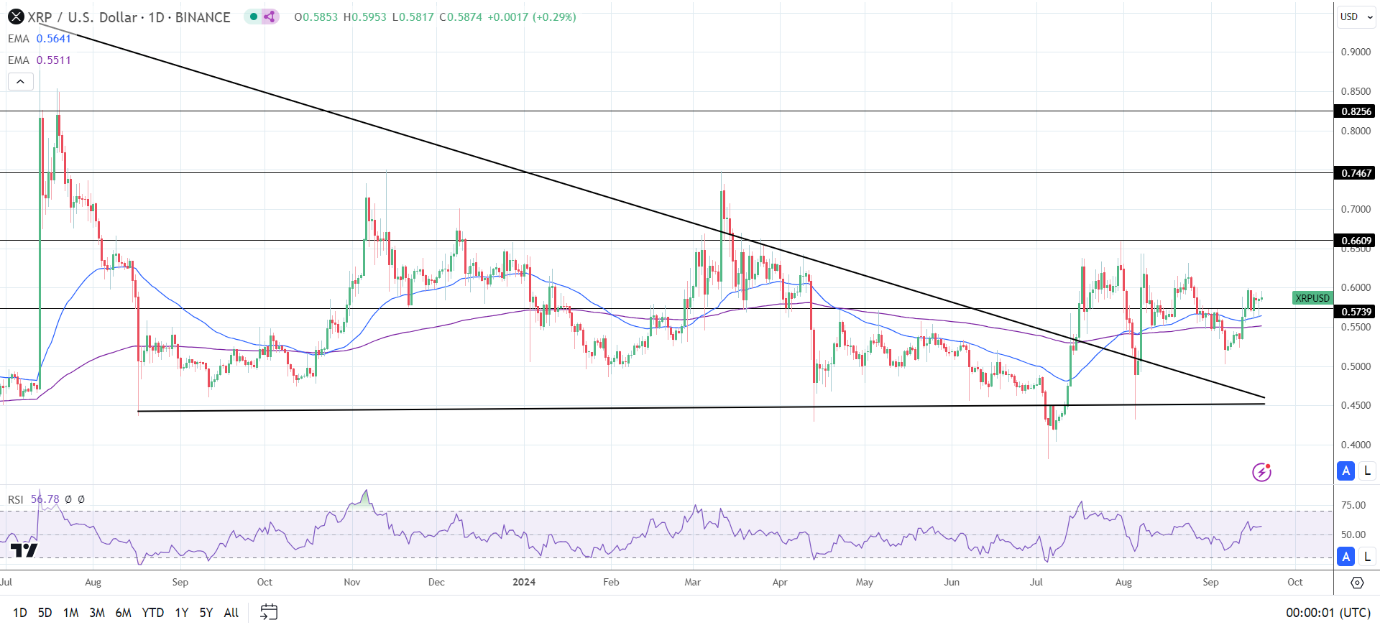
Daily Chart

XRP hovers above the 50-day and 200-day EMAs, sending bullish price signals.

A break above the $0.60 level could give the bulls a run at the $0.6527 resistance level. Furthermore, a breakout from the $0.6527 resistance level may signal a move toward the $0.70 level.

SEC activity and SEC vs. crypto case-related news require consideration.

Conversely, a break below the $0.5739 support level could bring the 50-day and 200-day EMAs into play. A fall through the EMAs would signal a bullish trend reversal and possibly a drop toward the $0.50 level.

With a 14-day RSI reading of 56.78, XRP may return to the $0.65 level before entering overbought territory.

Daily Chart affirms the bullish price signals.
XRPUSD 200924 Daily Chart
Gold (XAU) Price Forecast: Bullish Outlook as Fed Rate Bets Cut Lifts Bullion

Gold (XAU) Price Forecast: Bullish Outlook as Fed Rate Bets Cut Lifts Bullion

Gold Prices Rise as Markets Digest Fed’s Rate Cut

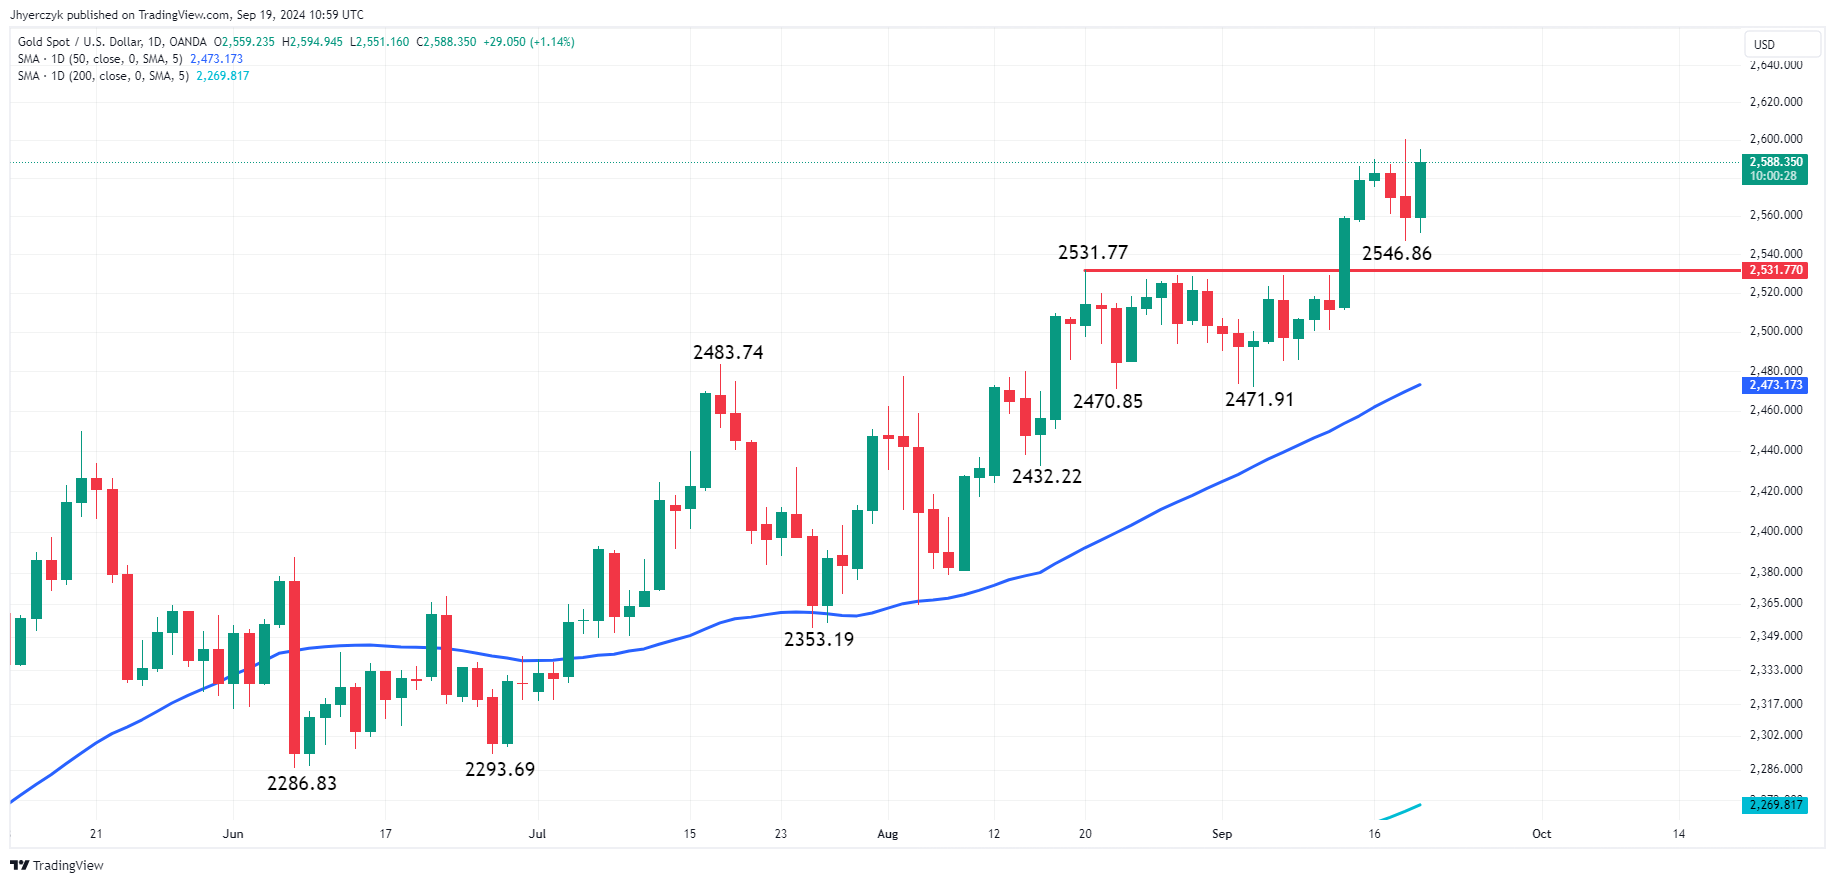
Spot gold is ticking higher on Thursday, following a record high of $2,600.29 hit during the previous session before retreating to $2,546.86. Gold is showing resilience after the Federal Reserve’s surprise decision to implement a super-sized 50 basis point interest rate cut, which has bolstered sentiment for the precious metal.

Our technical analysis indicates key support at $2,531.77, with the 50-day moving average at $2,473.18. The next major resistance levels lie at $2,649.43 and $2,660.90, where bullish traders may aim next.

Experts trade the markets with IC Markets

Trading Derivatives carries a high level of risk to your capital and you should only trade with money you can afford to lose. Trading Derivatives may not be suitable for all investors, so please ensure that you fully understand the risks involved, and seek independent advice if necessary. A Product Disclosure Statement (PDS) can be obtained either from this website or on request from our offices and should be considered before entering into a transaction with us. Raw Spread accounts offer spread

Daily Gold (XAU/USD)

Federal Reserve’s Rate Cut Drives Gold Prices Higher

The Federal Reserve’s larger-than-expected 50 basis point rate reduction has renewed interest in gold. By reducing rates to a 4.75%-5% range, the Fed is showing its commitment to keeping unemployment low as inflation pressures subside. Fed Chair Jerome Powell emphasized that the U.S. economy remains strong, despite this adjustment, pointing to stable employment indicators like the 4.2% unemployment rate.

This rate cut has weakened the U.S. dollar, supporting demand for dollar-denominated gold. Bullion is typically favored in a lower interest rate environment as it becomes more attractive against other assets that yield returns. With traders now expecting another rate reduction in November, gold is likely to benefit further if economic data continues to weaken.

Treasury Yields Steady Despite Market Volatility

U.S. Treasury yields have been relatively stable in the aftermath of the Fed’s decision. Investors are weighing the impacts of this monetary shift and awaiting further data. Despite the volatility, the Fed’s forward guidance suggests continued cuts through 2024, with an additional 50 basis points anticipated. This dovish outlook could continue to drive safe-haven demand for gold as Treasury yields remain subdued.

Geopolitical Tensions and Softening Data Could Lift Gold Further

Geopolitical risks in the Middle East remain a key factor influencing gold prices. Renewed tensions in Lebanon, where Hezbollah devices exploded again on Wednesday, are creating an undercurrent of unease in global markets. This adds to gold’s appeal as a hedge against geopolitical uncertainty. Meanwhile, upcoming U.S. jobless claims data could act as a catalyst for further price movement, especially if the numbers reflect a weakening labor market.

Gold Market Forecast

In the short term, gold prices are expected to remain bullish, with key resistance levels at $2,649.43 and $2,660.90 in focus. A weaker dollar, coupled with expectations of another rate cut, creates a favorable environment for gold bulls. Additionally, any escalation in geopolitical tensions or further signs of economic softness could drive prices higher toward the $2,700 mark. Traders should watch for key economic reports, including initial jobless claims and home sales data, as these could influence near-term gold movements.