EUR/USD holds above 1.0800 after mixed GDP data

EUR/USD holds above 1.0800 after mixed GDP data

EUR/USD continues to fluctuate above 1.0800 on Tuesday. The data from Germany showed that the GDP contracted at an annual rate of 0.1% in the second quarter. On a positive note, the Eurozone GDP expanded 0.6% in the same period. Focus shifts to German inflation data.

The Relative Strength Index (RSI) indicator on the 4-hour chart stays well below 50 despite edging slightly higher in the European morning on Tuesday.

EUR/USD holds above the 1.0800-1.0810 support area, where the 100-day and the 200-day SMAs are located. If this support fails, 1.0740 (Fibonacci 78.6% retracement of the latest uptrend) could be seen as next bearish target before 1.0700 (psychological level, static level).

On the upside, first resistance aligns at 1.0840 (Fibonacci 38.2% retracement) ahead of 1.0860 (100-period SMA) and 1.0880 (Fibonacci 23.6% retracement).

EUR/USD came under renewed bearish pressure on Monday and fell to its weakest level in three weeks near 1.0800. Although the pair managed to erase a small portion of its losses, it is having a tough time gathering recovery momentum ahead of Tuesday’s key macroeconomic data releases.

The cautious mood at the beginning of the week helped the US Dollar (USD) stay resilient against its major rivals. In the second half of the day, the mixed action seen in Wall Street allowed the USD to preserve its strength and limited EUR/USD’s rebound.

Early Tuesday, the data from Germany showed that the Gross Domestic Product contracted at an annual rate of 0.1% in the second quarter. This reading, however, failed to trigger a noticeable market reaction.

Germany’s Destatis will release Consumer Price Index (CPI) data for July later in the session. Investors expect the CPI to rise 0.2% on a monthly basis following the 0.1% increase recorded in June. A stronger-than-forecast monthly CPI reading could help the Euro find demand with the immediate reaction. Nevertheless, investors could refrain from taking large positions based on this data alone, especially ahead of the Federal Reserve’s monetary policy announcements on Wednesday.

On Tuesday, the US economic docket will feature Conference Board’s Consumer Confidence data for July and JOLTS Job Openings for June. If there is a significant increase in job openings, the USD could hold its ground and weigh on EUR/USD.

Euro (EUR/USD) Remains Under Pressure as German Economy Contracts in Q2

Euro (EUR/USD) Remains Under Pressure as German Economy Contracts in Q2

The German economy contracted in the second quarter of the year, missing expectations of a small expansion. Initial data from Destatis showed the economy contracting by one tenth of a percentage point in Q2, compared to expectations of 0.1% growth and 0.2% growth in Q1. As the Federal Statistical Office (Destatis) further reports, ‘investments in equipment and buildings, adjusted for price, seasonal and calendar effects, in particular decreased.’ Destatis will announce revisions to the GDP data on August 27th.

image1.png

Later today, the latest look at German inflation will need to be closely monitored for any signs of weakening price pressures. Financial markets are currently showing a 66% probability of a rate cut on September 12 and any further weakening of German inflation will boost these odds. Preliminary German inflation data is released at 13:00 UK.

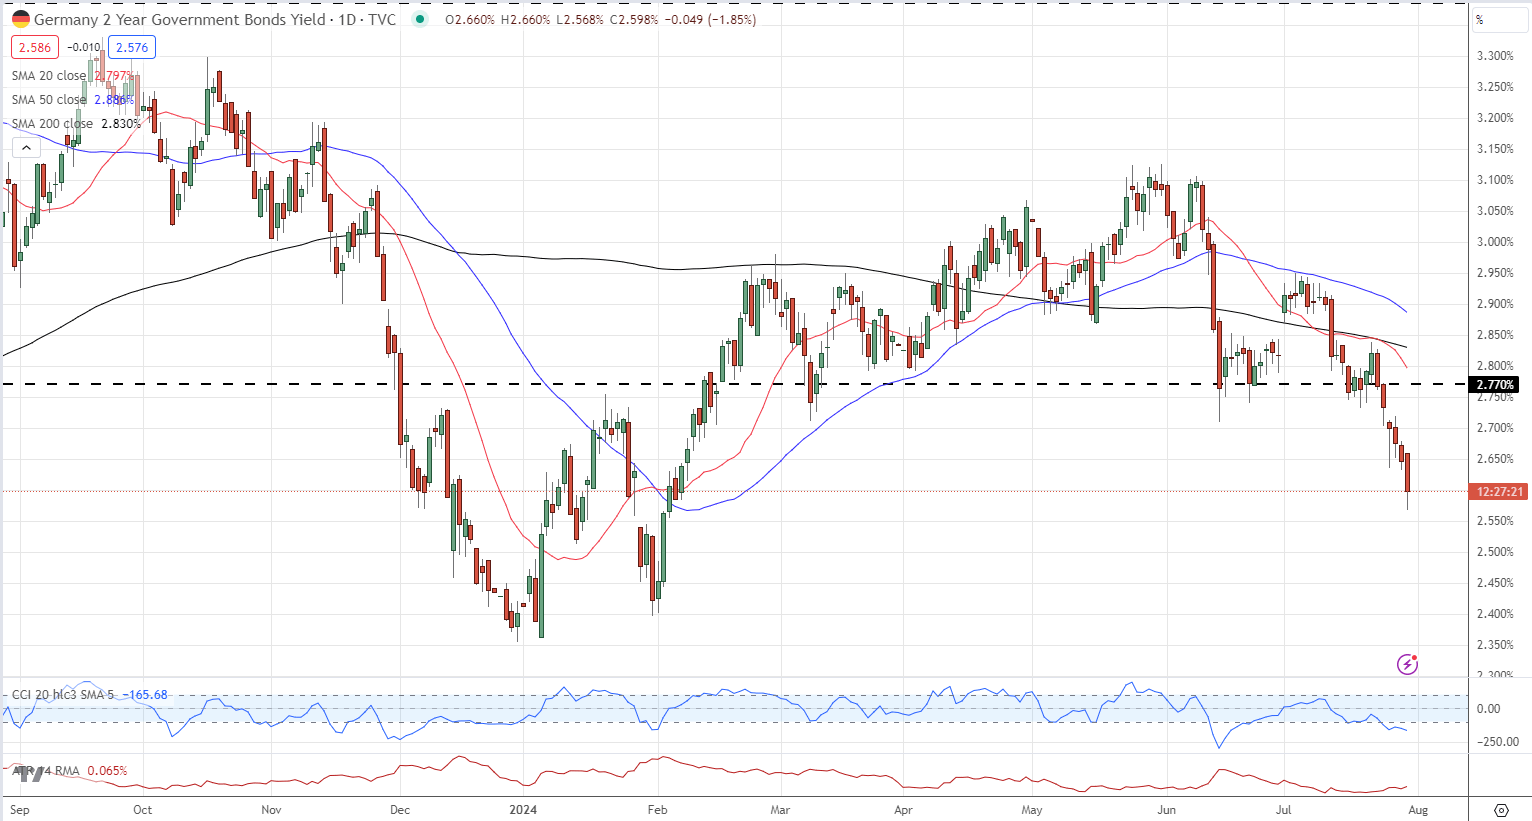
EUR/USD is trying to claw back some of Monday’s losses, but today’s German GDP release is putting renewed downward pressure on the pair. Short-dated German bond yields are back at lows last seen in early February, adding to the pressure on the Euro.

German 2-Year Daily Yield Chart

A graph of stock market  Description automatically generated

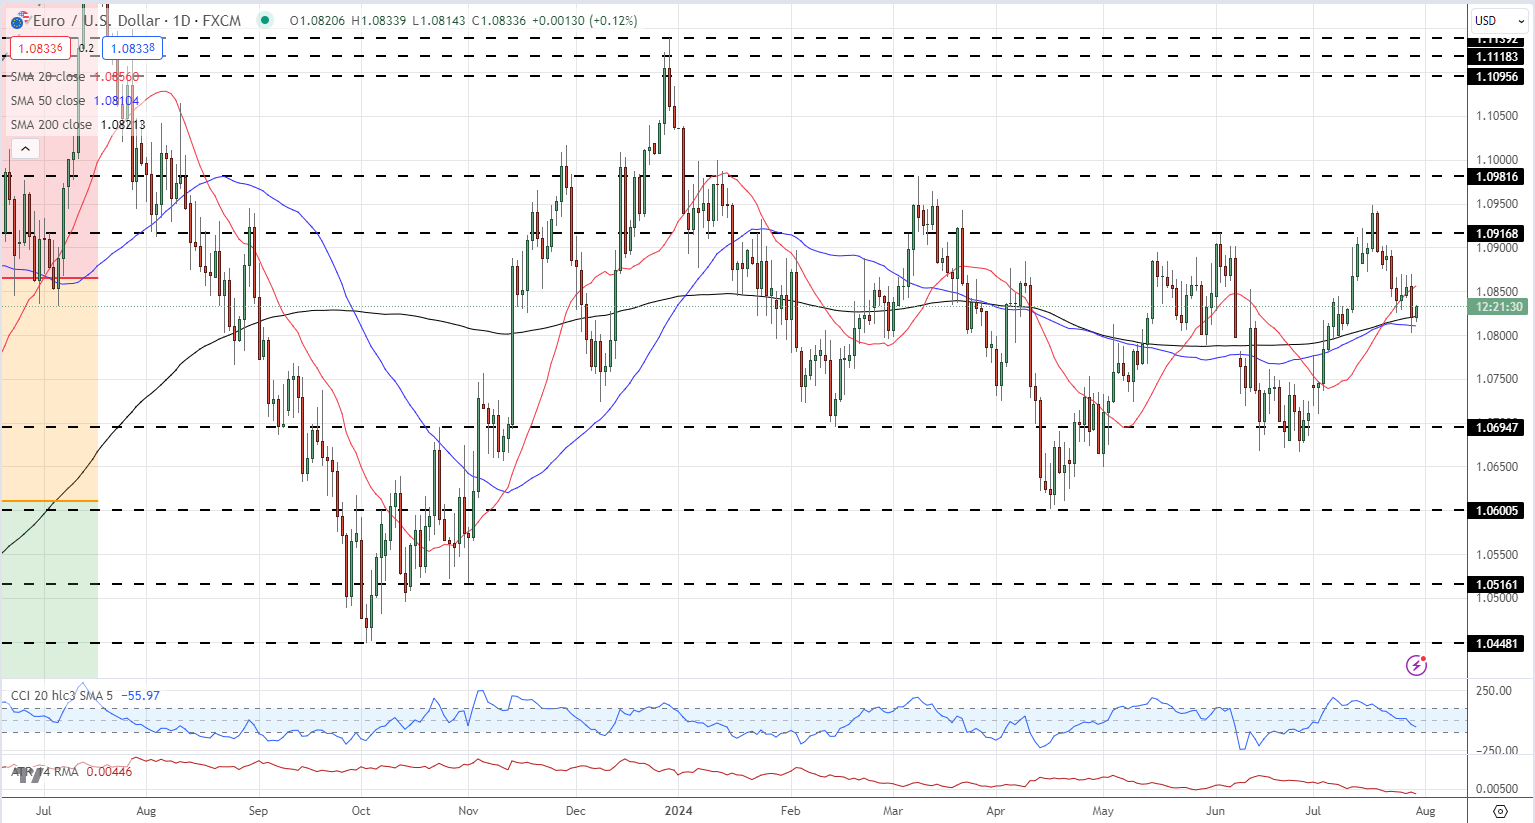
EUR/USD currently trades around 1.0830, below the 20-day sma and just above both the 50- and 200-day smas. A break below the two smas and Monday’s 1.0803 low would leave the pair vulnerable to a move back to the 1.0750 area before 1.0700 comes into play. A move higher would see EUR/USD run into resistance around recent highs, and the 23.6% Fibonacci retracement around 1.0866.

EUR/USD Daily Price Chart

A graph of stock market  Description automatically generated

Retail trader data shows 47.20% of traders are net-long with the ratio of traders short to long at 1.12 to 1.The number of traders net-long is 14.81% higher than yesterday and 15.95% higher from last week, while the number of traders net-short is 9.23% lower than yesterday and 23.48% lower from last week.

We typically take a contrarian view to crowd sentiment, and the fact traders are net-short suggests EUR/USD prices may continue to rise. Yet traders are less net-short than yesterday and compared with last week. Recent changes in sentiment warn that the current EUR/USD price trend may soon reverse lower despite the fact traders remain net-short.


The Bank of Japan: A Forex Trader’s Guide

The Bank of Japan: A Forex Trader’s Guide

The Bank of Japan (BoJ) is a major central bank, setting the monetary policies that aim to maintain price stability and a strong Japanese financial system. As a central bank, the BoJ directly impacts the forex market, so policy meetings and the decisions they bring about are important for FX traders to follow.

What is the Bank of Japan?

The Bank of Japan, or Nichigin, is the Japanese central bank. It implements monetary policy and issues currency to maintain stability of the financial system. The bank’s Policy Board holds regular monetary policy meetings, deciding on their approach to interest rates, and how they intend to influence inflation.

Who Owns the Bank of Japan?

The government of Japan has a 55% ownership of the bank, and 100% voting interest. The remaining 45% is a public float, traded as JASDAQ. As of August 2019, the BoJ governor is Haruhiko Kuroda, who has held the position since March 2013 and is currently serving his second five-year term, which is due to run until April 2023.

Key Economic Mandates of Japan’s Central Bank

The BoJ considers its core mandates to be:

  1. Maintaining stability of the financial system
  2. Maintaining price stability

Maintaining stability of the financial system

The BoJ implements its monetary policy with the aim of maintaining financial system stability, which involves currency control, monetary control and the issuing of banknotes. This also feeds into the BoJ’s other core aim, as currency and monetary control is part of the plan to achieve price stability and develop the economy.

Maintaining price stability

Maintaining price stability is the other central aim of the BoJ. Exports are essential to Japan, so the BoJ tries to keep prices as stable as possible and will manipulate interest rates with the intention of developing the national economy. The bank defines ‘price stability’ as a 2% increase year on year in the Consumer Price Index (CPI).

How does the BoJ carry out its mandates?

The BoJ holds regular monetary policy meetings (MPMs), where it sets the official interest rate and other monetary policies in the hope that they will achieve price stability and financial system stability. MPMs are held eight times a year and last for two days, during which time the Policy Board (the Governor, two Deputy Governors and six other members) will discuss and implement monetary policy. As of July 2018, the base rate remains set at -0.1% in the hope of growing the economy.

How Bank of Japan Monetary Policies Affect the Yen

Japan has suffered from an ailing economy with very low inflation over the course of the last few decades, consistently failing to achieve 2% inflation. The BoJ has adopted what is known as a loose monetary policy, maintaining a low interest rate in the hope of boosting the economy.

When there is little incentive to save due to a low interest rate, the idea is that people will spend more, put money into the economy and encourage inflation. This has seen the yen becoming increasingly weak against major currencies, including the US Dollar and the Euro, ever since Kuroda took office.

USD/JPY went from 94.00 in March 2013 to over 125.00 in June 2015, after Kuroda announced his first raft of policy measures. And while it has fluctuated since then, the yen’s value has remained well below its level when he became governor, with USD/JPY sitting around 108.00 in July 2019.

USD/JPY chart showing the fluctuations in value around major BoJ announcements

Chart showing USD/JPY fluctuations around major BoJ announcements

Following a period from 2012 to 2013 when the yen was relatively strong against the US Dollar, it fell to USD/JPY 125.00 in June 2015 after the announcement of Kuroda’s initial policy measures. The value fell once again in January 2016, when Kuroda made the shock announcement that the bank would implement a negative interest rate for the first time ever, charging -0.1% on deposits held with the bank. This policy aims to get financial institutions to withdraw their cash to invest elsewhere, rather than making a loss by hoarding cash.

This announcement caught the markets by surprise as Kuroda had only recently told the parliamentary budget committee that he was not looking to introduce any policy changes for the time being. The yen fell against currencies including the dollar and pound, while the Japan 225 went up in the hours following his announcement.

How to trade BOJ interest rate decisions

BoJ interest rate decisions are made with the aim of increasing spending and investment, influencing inflation. Changes in demand for stocks and currency as interest rates change can create forex trading opportunities. Even when interest rates remain the same, the anticipation surrounding important events like monetary policy meetings can affect the forex market.

Short-term interest rates are fundamental in determining currency valuation, so traders will watch them closely. Here’s the general pattern:

Market expectations Actual Results Resulting FX Impact
Rate Hike Rate Hold Depreciation of currency
Rate Cut Rate Hold Appreciation of currency
Rate Hold Rate Hike Appreciation of currency
Rate Hold Rate Cut Depreciation of currency
How to Trade Consistently Without Having the Perfect Strategy

How to Trade Consistently Without Having the Perfect Strategy

The Secrets of Consistent Trading: Talking Points

Having a consistent trading strategy can’t be understated when it comes to the process of trading. This is because uniformity leads to sensible trading decisions. But building an edge in the market has more to do with a consistent method you are comfortable with, as opposed to a perfect system that grabs 100% of the pips in a market movement.

In this article the importance of consistent trading will be covered from the type of analysis and usage of tools, to trade execution and risk management.

What is consistency in trading and why does it matter?

Consistency in trading refers to the constant/repetitive nature of an individual to a set of trading principals. This adherence allows the trader to avoid ‘over-trading’ whilst maintaining appropriate risk management. There are varying characteristics of consistent trading which include:

  • Following a trading strategy
  • Analysis
  • Avoiding over and under-trading
  • Proper risk management
  • Tracking and review of trades

Consistency in trading acts as a catalyst for successful trading because it circumvents emotional influence by the trader. Irrationality and irregularity often lead to inconsistent results as seen in the charts below.

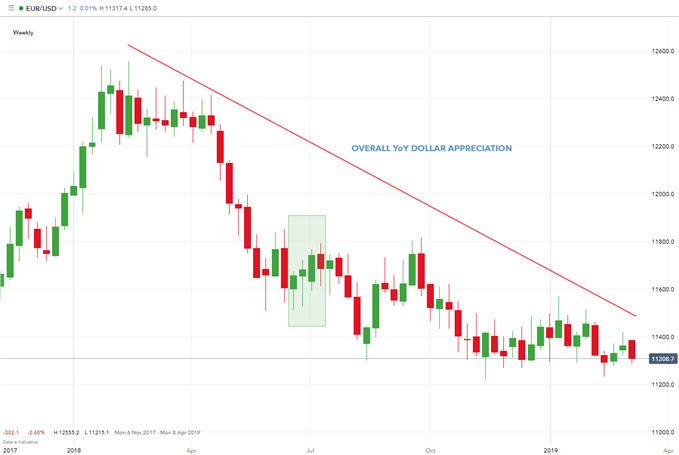
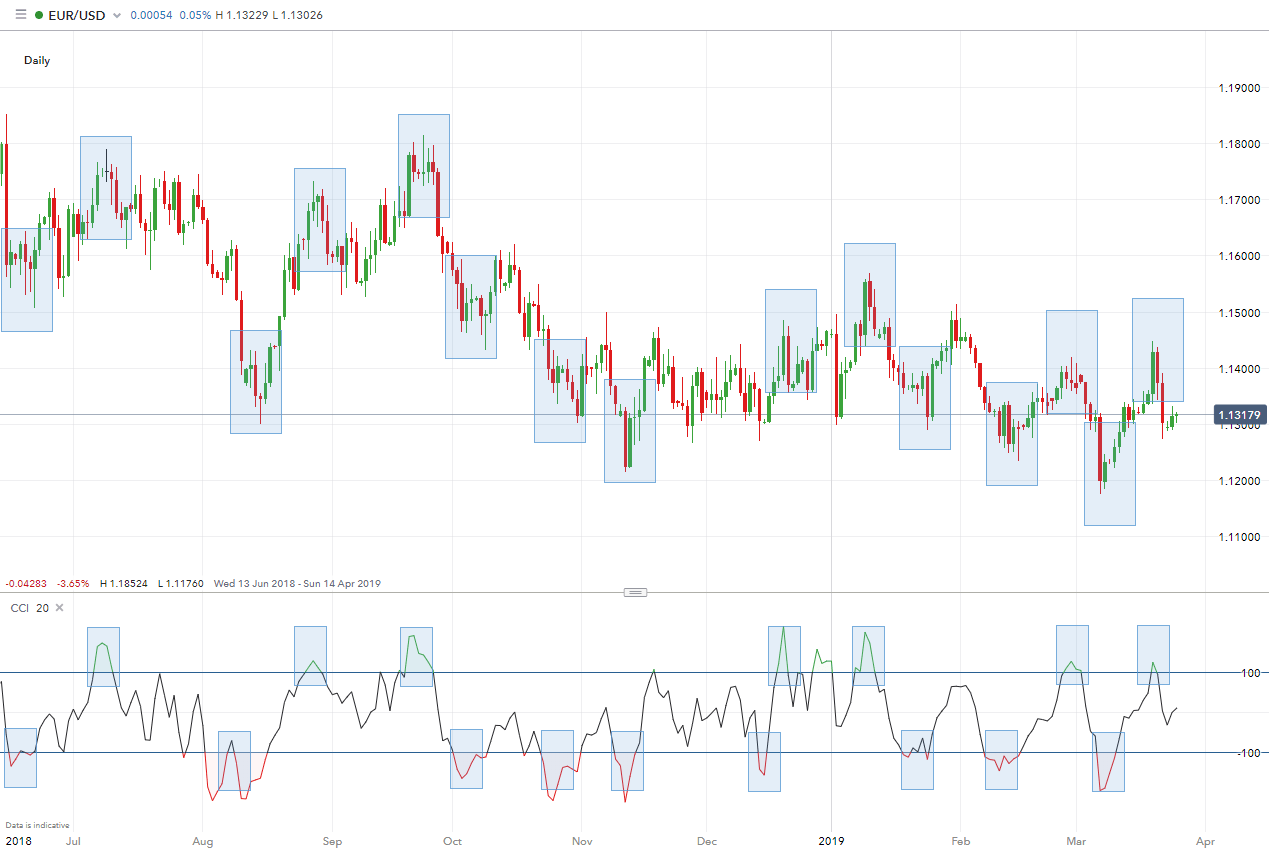
Chart one below depicts an over simplified strategy of using an RSI oscillator to time entry/exit points in a trending market. Chart two makes use of the CCI oscillator for the same market to identify entry/exit points. Chart two shows a significant increase in frequency of overbought and oversold signals – highlighted by the blue rectangles.

This straightforward comparison shows how changing strategies can alter trading decisions and consistency in trading (even with a minor change such as a different oscillator). Trading strategies are generally far more complex than the examples below, therefore deviating away from a trade strategy can result in variable results.

Chart 1: Daily EUR/USD with RSI indicator

consistent forex trading RSI

Chart 2: Daily EUR/USD with CCI indicator

consistent forex trading CCI

How to build a consistent trading strategy

There are a number of ways traders can adopt a consistent approach to trading. Planning ahead, applying risk management and journaling day to day activities and price movements are among the most important.

1. Have a trading plan– A detailed plan of attack provides the framework necessary for a trader to ‘stay on course’. There are facets to trading which a trader can control, and those they have no control over whatsoever. Following a minimalist method of analysis is one such way to stay in control and helps to avoid ‘paralysis by analysis’.

For simplicity, it’s recommended that traders stick to a few core methodologies/tools when analysing price movements. There is a plethora of ways to analyse and view the markets, with no real right or wrong way. The key is to be consistent in whichever approach is preferred.

2. Be consistent when executing trades – There are various ways to execute upon identified opportunities in the markets. For example, when trading breakouts; does the trader buy the first price above a certain level or wait for the candlestick to close first? Or, maybe a combination of the two? Any of the prior is fine, but the more important point is that there is consistency in trade.

3. Risk management – Risk management is the single most important aspect to trading success and where many traders fail. It must be approached consistently if a trader expects to achieve consistent results. Trading is about probabilities: win percentage x win/loss ratio. With that in mind, if traders do not have a consistent risk-per-trade amount, those probabilities will not matter as winners and losers will be on varying amounts of risk.

For example, if a trader makes 2% on one trade, loses 4% on the next, then makes 1% on another, this will result in uneven (and in this case, negative) results – even though two out of three trades were profitable. Risk/reward (stop/target) objectives need to be consistently skewed in the favour of the trader.

4. Keep a journal – An excellent way to ensure consistency is by keeping a trading journal, whether it be daily or weekly. Monitoring activity and factors that are influencing decision-making allows traders to remain consistent in their trading strategy. Traders should review trades periodically by overlaying previous trades with the trading plan for intended correlation.

Avalanche eyes nearly 18% gains with over $250 million bridged from Ethereum

Avalanche eyes nearly 18% gains with over $250 million bridged from Ethereum

DeFi token Avalanche (AVAX) trades at $28.75, as Bitcoin sustains close to $69,000 early on Monday. Data from crypto intelligence tracker IntoTheBlock shows that the sentiment among traders is positive. AVAX extends gains by nearly 5% on the day as the DeFi token shows bullish potential.

Avalanche on-chain metrics signal bullish potential

On-chain data from IntoTheBlock shows the sentiment among traders is “bullish” as of Monday. Global In/Out of the Money (GIOM) metric is used to track the profitability of wallet addresses holding the asset at a given price. At $28.77, 21.74% of the wallet addresses holding Avalanche are profitable.

On the other hand, at the current price, 62.55% of wallet addresses holding Avalanche are sitting on unrealized losses. This makes the cluster of addresses less likely to realize losses and sell the asset. The metric, therefore, supports a bullish thesis for Avalanche.

AVAXDaily transactions, a measure of the number of transactions on Avalanche, shows utility and demand for the DeFi token. Daily transactions reached 1.23 million on Sunday, per data from Avascan.

AVAX

Data shows $253.11 million in value is bridged from the Ethereum chain to Avalanche. This means traders trust the DeFi network and move a large volume of assets to the chain, which is bullish for long-term adoption.

Whales pull AVAX off exchanges

QCP Group, a digital assets trading group from Singapore, withdrew over 75,000 AVAX worth $2.18 million from Binance on Monday. Data from Arkham Intelligence tracker shows that Bitcoin and Ethereum are the two largest holdings in the portfolio of the firm, with 1,641 BTC (worth over $114.23 million) and 7,023 Ether (worth $23.69 million).

The withdrawal reduced the supply of Avalanche on the exchange wallet, likely contributing to the reduced selling pressure.

Avalanche

Avalanche eyes nearly 18% gains

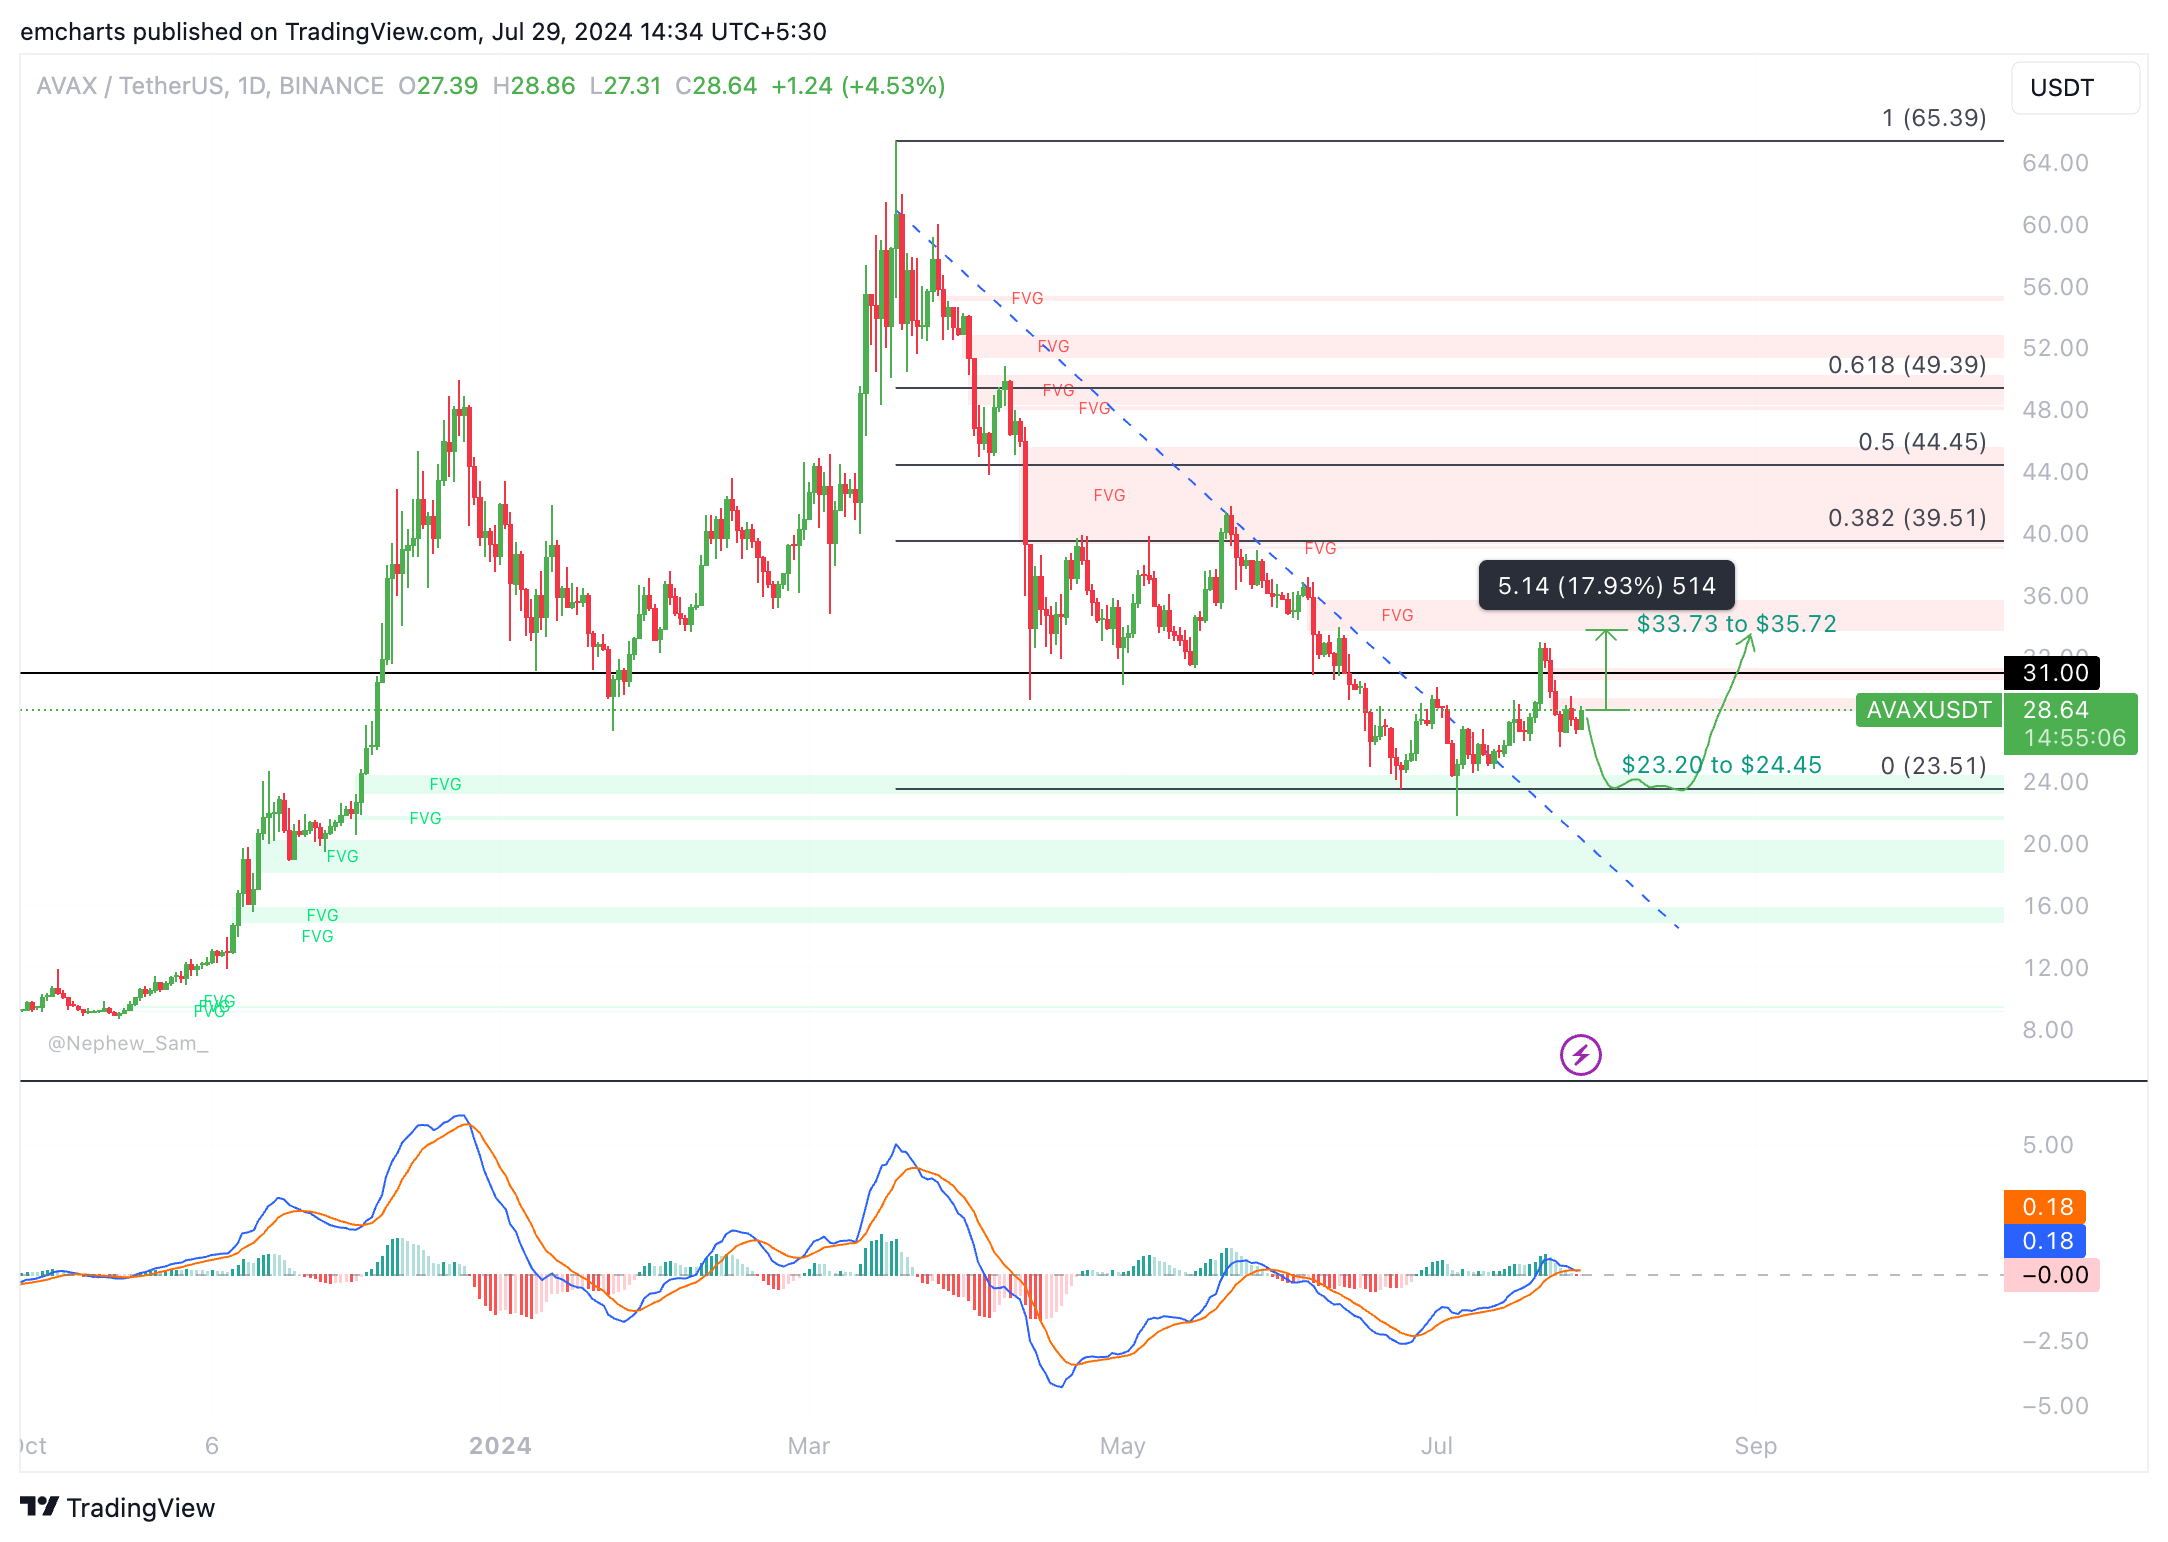
The Avalanche price was in a downward trend. Since its March 18 peak of $65.39, the DeFi token has consistently declined in value. Attempts to break out of the downtrend failed on May 22, June 7, and July 1.

On July 13, AVAX noted a trend reversal, and since then, the DeFi token has sustained above the key support at $25.53, as seen in the AVAX/USDT daily chart below.

The Moving Average Convergence Divergence (MACD) momentum indicator shows an underlying positive momentum in AVAX.

Avalanche could sweep support in the Fair Value Gap (FVG) between $23.30 and $24.45 before rallying towards its target at the FVG between $33.73 and $35.72. A rally to this level represents nearly 18% gains from the current price of $28.75. AVAX faces resistance at $31, a key level for the DeFi token.

AVAX

AVAX/USDT daily chart

Traders need to watch the MACD closely for signs of a reversal. If MACD crosses below the signal line, the underlying momentum in Avalanche price could turn negative and signal an impending correction in Avalanche.


AUD/USD remains on backfoot near 0.6550 with Fed policy in focus

AUD/USD remains on backfoot near 0.6550 with Fed policy in focus

The AUD/USD pair consolidates in a tight range near 0.6550 in Monday’s European session. The near-term outlook of the Aussie asset remains vulnerable as weak iron ore prices have dampened the Australian Dollar’s (AUD) appeal.

Lower iron ore prices have negatively impacted foreign flows into Australia as it caters to more than 50% of its global demand. The prices of the base metal dived recently due to its weak demand outlook, with the Chinese economy going through a rough phase amid poor demand conditions. Lack of big bang stimulus announcement in the China’s Third Plenum outcome and an unexpected rate-cut decision by the People’s Bank of China (PBoC) raised concerns over China’s economic prospects. Also, China and Australia are close trading partners.

Domestically, the Australian Dollar will be influenced by the monthly and Q2 Consumer Price Index (CPI) data, which will be published on Wednesday. In the second quarter, price pressures are estimated to have grown steadily by 1%. Annually, Q2 CPI is expected to have accelerated to 3.8% from the former release of 3.6%. This will boost expectations of further policy-tightening by the Reserve Bank of Australia (RBA).

Meanwhile, a significant recovery in the US Dollar (USD) amid caution among market participants ahead of the Federal Reserve’s (Fed) interest rate decision on Wednesday has weighed on the Aussie asset. The US Dollar Index (DXY), which tracks the Greenback’s value against six major currencies, jumps to near 104.55. Investors will keenly focus on the guidance on interest rates as the Fed is expected to maintain the status quo for the eighth time in a row.

Currently, financial markets expect that the Fed will start reducing interest rates from the September meeting and there will be two rate cuts this year. Investors will look for cues about whether policymakers are comfortable with these speculations.

US Dollar picks up amid a frail market sentiment, with the Fed on focus

US Dollar picks up amid a frail market sentiment, with the Fed on focus

The US Dollar (USD) has opened the week on a somewhat firmer pace. Market concerns about the escalating tensions in the Middle East have shadowed investors’ hopes of a Fed dovish turn later this week.

Israel is considering retaliation to Hezbollah in Lebanon after a deadly rocket attack in the Golan Heights this weekend. This would stir an already tense area and is threatening to involve Iran in a full-blown regional war.

Geopolitical concerns are overshadowing the fundamental docket, especially Wednesday’s Federal Reserve’s (Fed) monetary policy meeting.  The Fed is likely to keep rates unchanged but investors are expecting a dovish turn in the bank’s rhetoric, acknowledging the cooling inflation trends and hinting towards a rate cut in September.

Before that, the JOLTS Job Openings for June and the Conference Board’s Consumer Sentiment Index for July, due on Tuesday, are expected to show moderate contractions, which will provide the right framework for a dovish message from the central bank.

Daily digest market movers: US Dollar favoured by the cautious market sentiment

  • In the absence of key fundamental releases on Monday, market concerns of an escalation in the Middle East are likely to weigh risk appetite and provide support for the US Dollar due to its safe-haven status.
  • On Tuesday, the US Conference Board’s Consumer Sentiment Index is expected to show a moderate decline to 99.5 from 100.4 in the previous month.
  • US JOLTS Job Openings are seen to have eased to 8.03 million in June from 8.14 million in May.
  • Future markets are pricing only a 4.1% chance of an interest rate cut by the Fed on Wednesday, with a 25 bps rate cut fully priced for September, according to the CME Group Fed Watch Tool.
  • Data seen last week showed that the US Personal Consumption Expenditures (PCE) Prices Index remained sticky in June, yet with the core PCE index at 2.6% year-over-year, which kept hopes of a September rate cut alive.
  • Earlier in the week, the US Gross Domestic Product (GDP) surprised with a 2.8% yearly growth in the second quarter, from 1.4% in the first, but still far from the growth levels seen in the second half of 2023.

DXY Technical Outlook: There is scope to extend its recovery beyond 1.0455

The bearish trend sewn in the first half of the month is losing momentum. The 4-hour chart shows RSI  returning above the 50 line, with price action testing resistance at 104.55.

Fundamentals are supportive, and the strong rebound from the 104.05 support area on Monday suggests that there is scope for a further recovery.

Beyond 104.55, the next target would be 105.10, ahead of 105.80. Supports are the mentioned 104.05 and 103.60.

EUR/USD holds above 1.0800 after mixed GDP data

EUR/USD tuns south toward 1.0800 amid US Dollar rebound

EUR/USD has turned back in negative territory, eyeing 1.0800 in the European session on Monday. The US Dollar stages a decent comeback, as risk sentiment sours amid Middle East tensions and the markets’ nervousness ahead of a critical central banks’ week.

The Relative Strength Index (RSI) indicator continues to move sideways at around 50, highlighting a lack of directional momentum.

On the downside, EUR/USD faces immediate support at 1.0840, where the Fibonacci 38.2% retracement of the latest uptrend is located. Below this level, the 100-day and the 200-day SMAs form strong support area at 1.0800-1.0790 ahead of 1.0740 (Fibonacci 78.6% retracement of the latest uptrend).

Resistances align at 1.0860 (100-period SMA),1.0880 (Fibonacci 23.6% retracement) and 1.0900 (psychological level, static level).

EUR/USD moves sideways near 1.0850 in the European morning on Monday after closing the previous week in negative territory. Ahead of this week’s key macroeconomic events, which include the Federal Reserve’s (Fed) monetary policy decisions, Eurozone inflation data and US labor market report, the pair could stay in a consolidation phase.

The risk-averse market atmosphere made it difficult for EUR/USD to gather bullish momentum last week, even though mixed macroeconomic data releases from the US limited the US Dollar’s (USD) gains.

The economic calendar will not feature any high-tier data releases on Monday. Meanwhile, US stock index futures gain between 0.25% and 0.5% in the European session, pointing to an improving risk mood.

In case risk flows dominate the financial markets in the second half of the day, the USD could stay on the back foot and allow EUR/USD to hold its ground. Nevertheless, the pair’s action is likely to remain subdued in the near term.

Bitcoin Rallies on Trump Support, How do BTC and ETH Shape up?

Bitcoin Rallies on Trump Support, How do BTC and ETH Shape up?

Presidential candidate Donald Trump threw his weight behind the world’s largest cryptocurrency on Saturday despite being a critic of the digital currency in the past. Republican nominee, Donald Trump spoke at a bitcoin conference in Nashville on Saturday where he announced that if he were to assume office, he would establish a crypto presidential advisory council and create a national “stockpile” consisting of crypto already held by the U.S. government – largely due to seizures.

Trump is looking to apply a lighter touch when it comes to regulating the crypto sector and would like to see more mining activity up and down the country. Also over the weekend, a group of nearly 30 Democratic lawmakers and Congressional candidates sent a letter to the Democratic National Committee and Kamala Harris, proposing a forward-looking approach to digital assets.

Trump’s proposal has been well received by the crypto community and is largely being seen as a massive vote of confidence to further legitimize the digital asset. Earlier this year spot bitcoin ETFs got the vote of approval with spot Ethereum ETF’ receiving the same approval. However, when it comes to Ethereum, analysts expect a lower uptake compared to Bitcoin.

Bitcoin Rose after Trump’s Speech but Resistance Zone Come into View

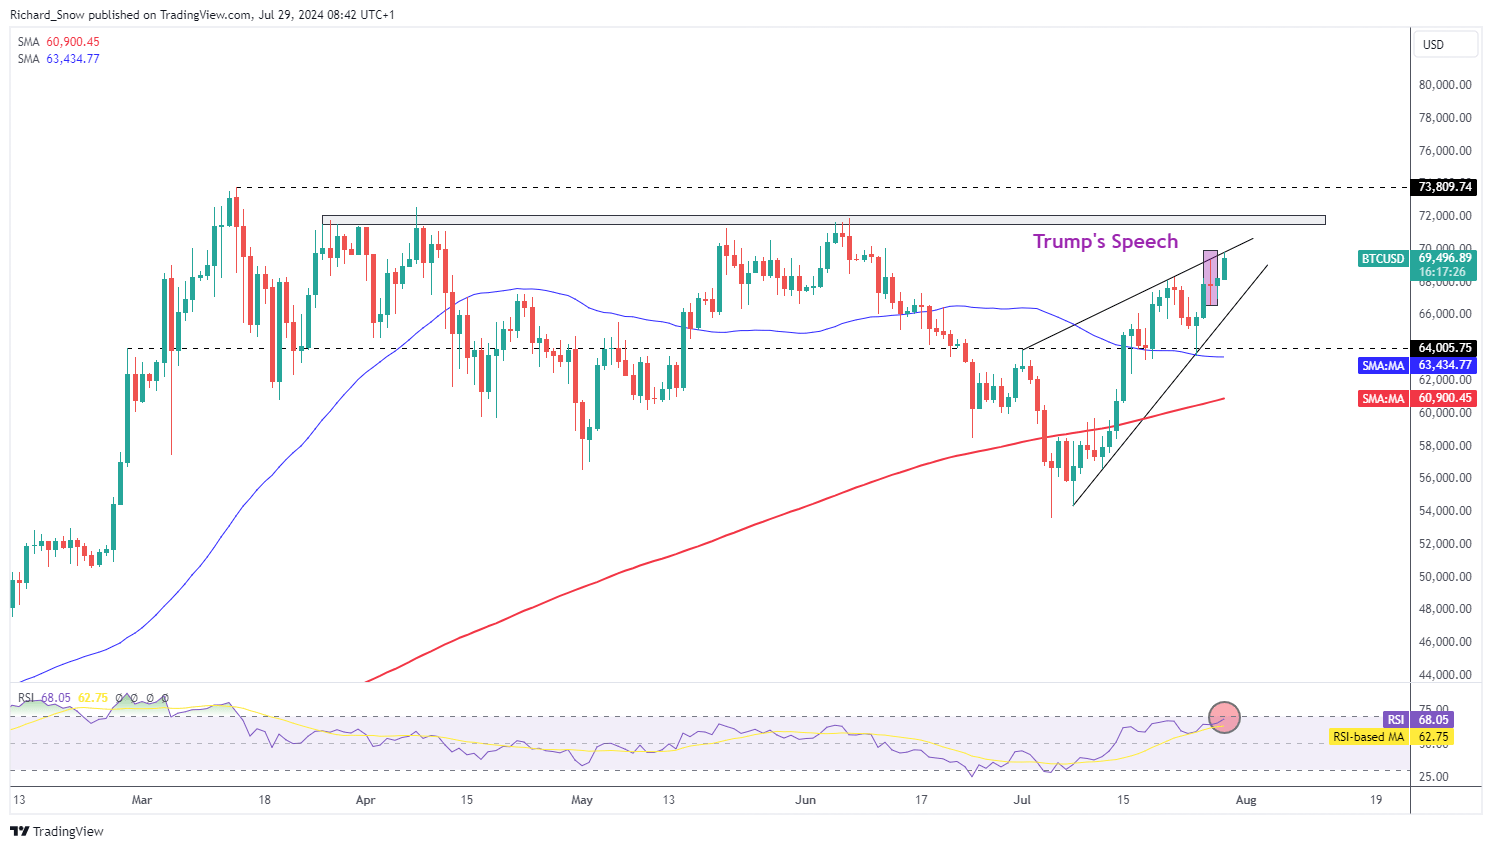
Bitcoin prices closed flat on Saturday but witnessed a fairly typical daily range (daily high – daily low) consistent with what has been witnessed over the previous trading days. Since then, the cryptocurrency has continued the bullish move that ensued from early July, trading above both the 50 and 200-day simple moving averages.

BTC/USD now tests trendline resistance within a rising wedge formation. The rising wedge is typically a bearish pattern, however, price action nears the upper side of the formation. Keep an eye for possible bullish fatigue, especially with the RSI knocking on the door of oversold territory. The upcoming zone of resistance suggests the world’s largest cryptocurrency will require more than just a shot in the arm to overcome this next hurdle which is likely to test bull’s resolve. The zone of resistance appears around $71,820 with support at $64,000.

Bitcoin (BTC/USD) Daily Chart

A screenshot of a graph  Description automatically generated

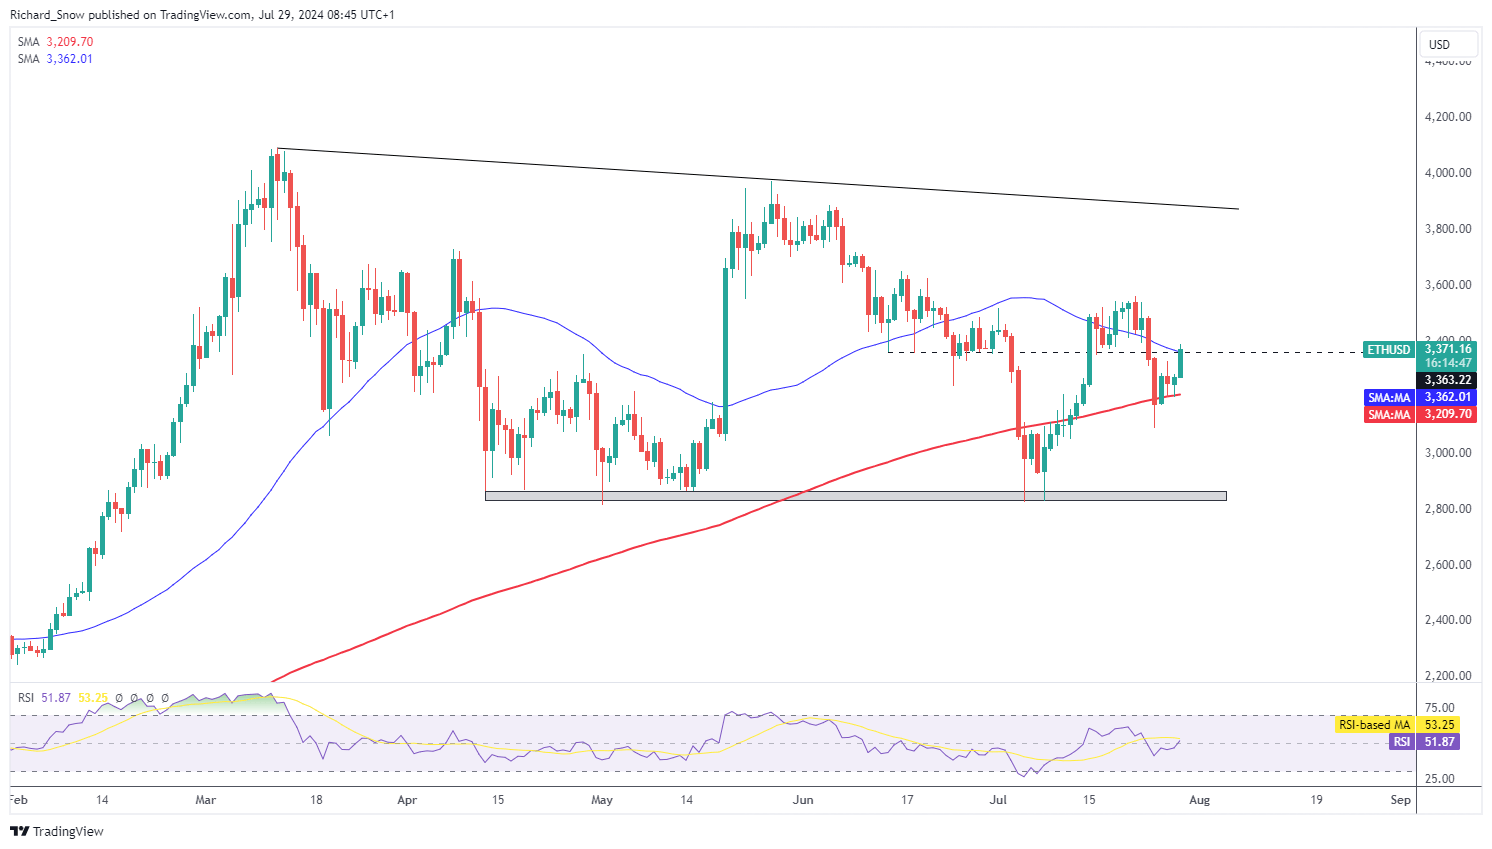
Ethereum (ETH/USD) reveals more of a longer-term consolidation pattern as bulls have failed to make higher highs and higher lows on a consistent basis. Shorter-term price action tells the same story, with ETH failing to capitalize on the same upward momentum experienced in bitcoin ahead of last weekend. The 200-day simple moving average comes in as immediate support, with the 50 SMA and $3,375 presenting resistance.

Ethereum Daily Chart (ETH/USD)

A graph of stock market  Description automatically generated


US Inflation Data Little Changed in June, USD and Gold Listless Post-release

US Inflation Data Little Changed in June, USD and Gold Listless Post-release

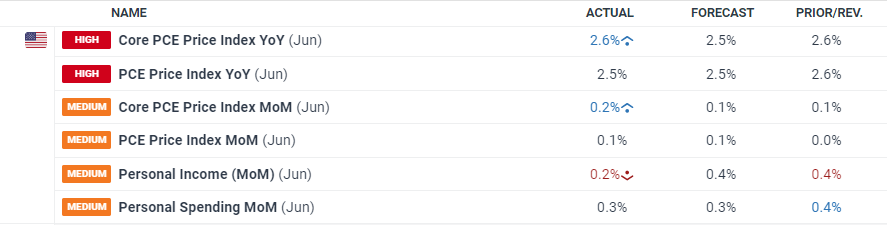
The US Core PCE inflation gauge y/y was unchanged at 2.6% in June but missed market expectations of 2.5%. The PCE price index fell to 2.5% from 2.6% in May, while personal income m/m fell by more than expected to 0.2%.

image1.png

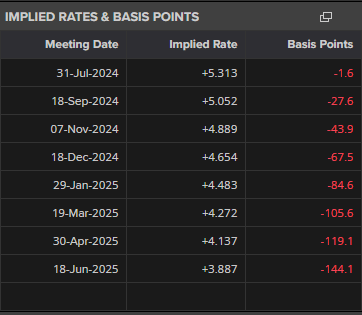
Today’s release gives traders little new to work with and leaves the US dollar apathetic going into the weekend. Financial markets continue to fully price in a 25 basis point interest rate cut at the September 18 FOMC meeting, with a second cut seen in November. A third-quarter point cut at the December 18 meeting remains a strong possibility.

image2.png

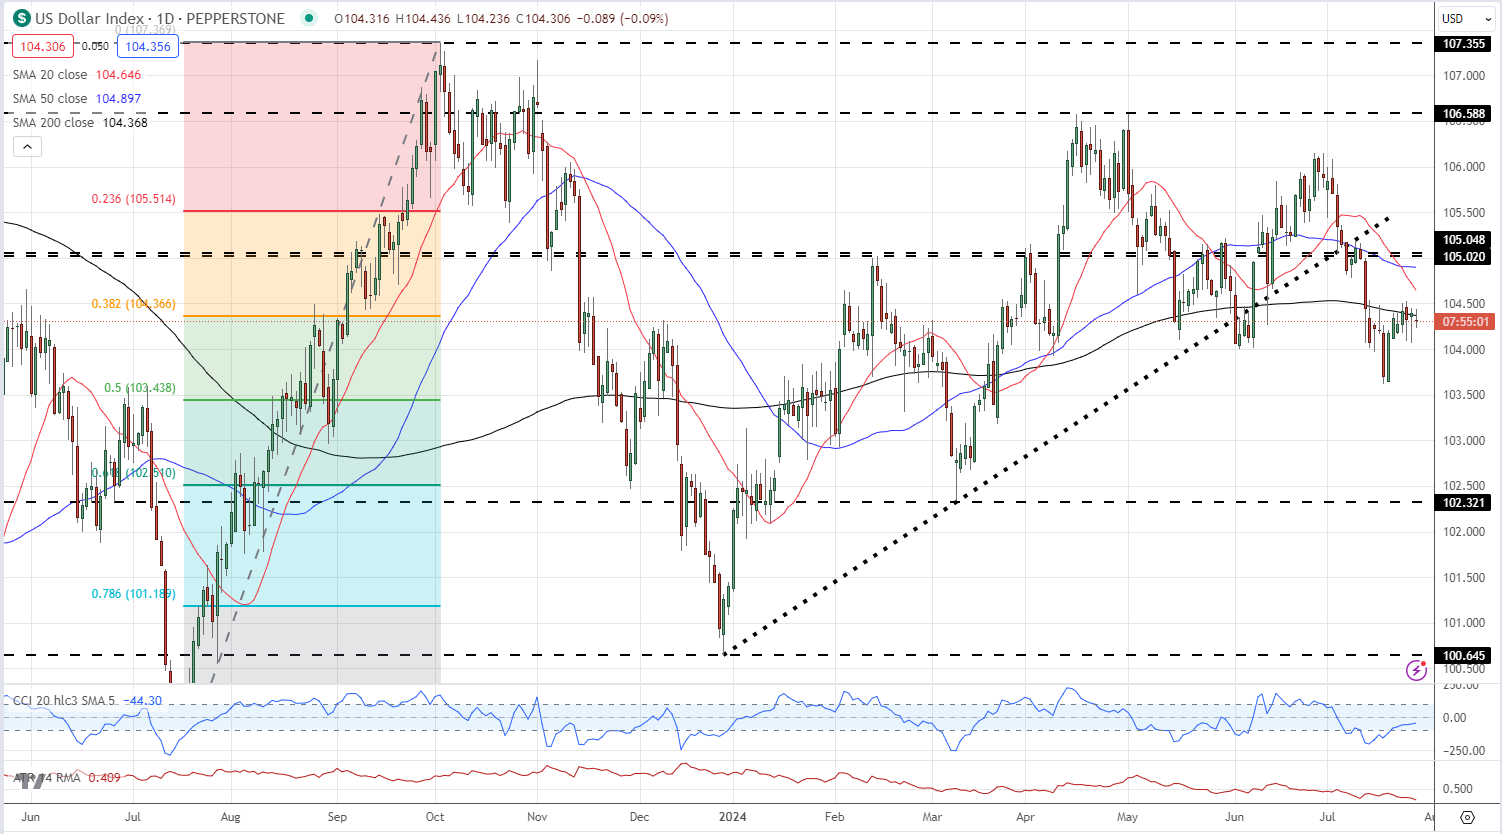
US dollar traders will now look ahead to next week’s FOMC meeting to see if chair Powell gives any further guidance about upcoming rate cuts. The US dollar index (DXY) is trading on either side of the 38.2% Fibonacci retracement level at 104.37, and the 200-day simple moving average, and will need a new driver to force a move ahead of next Wednesday’s Fed meeting.

US Dollar Index Daily Chart

image3.png

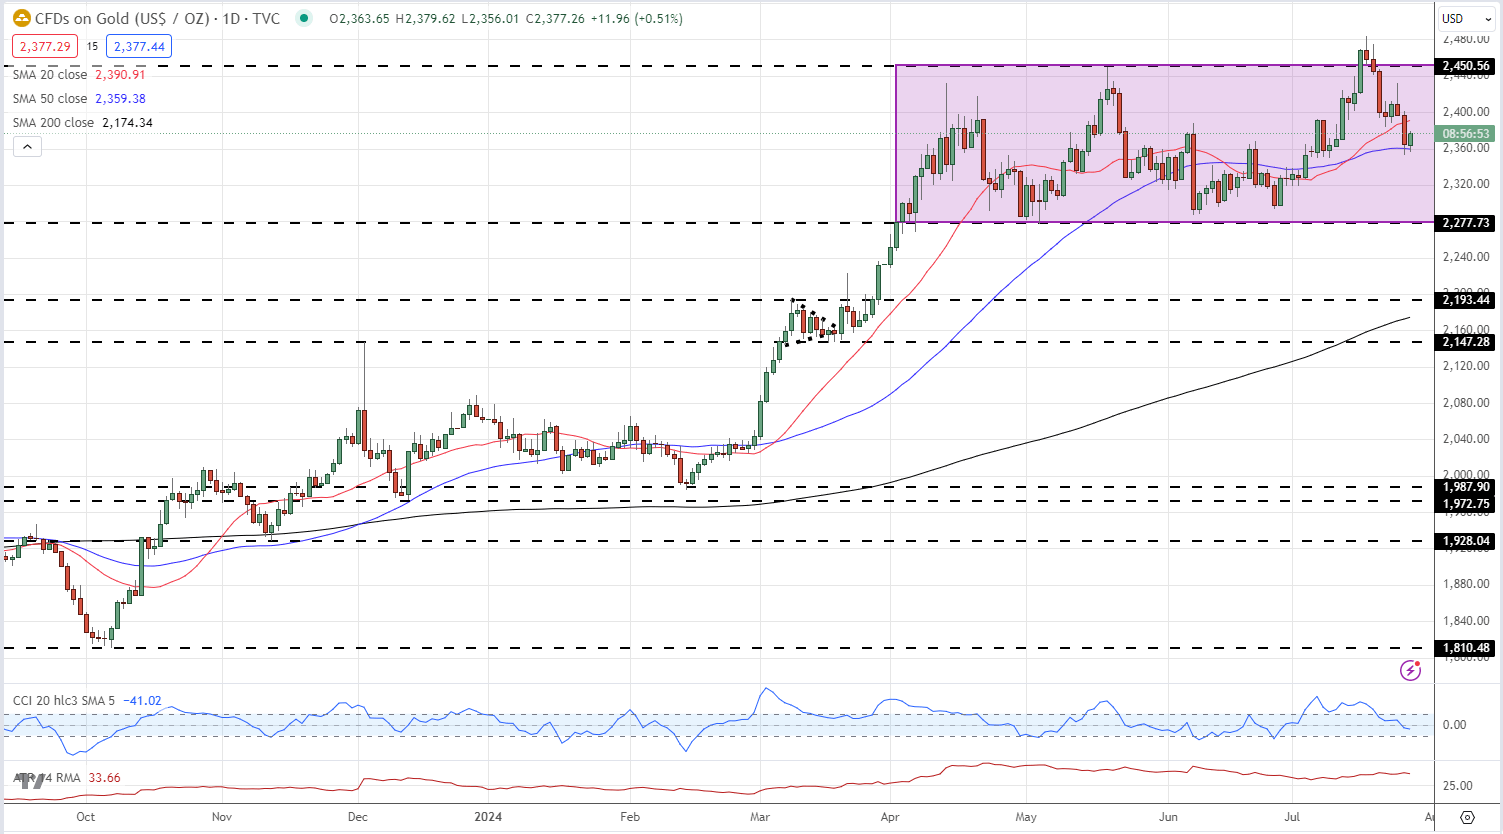
The price of gold nudged around $5/oz. higher after the inflation report and remains stuck in a multi-month range. The precious metal briefly broke resistance two weeks ago but quickly slipped back into a range that started in early April.

Gold Price Daily Chart

image4.png

Retail trader data shows 61.36% of traders are net-long with the ratio of traders long to short at 1.59 to 1.The number of traders net-long is 11.61% higher than yesterday and 16.13% higher than last week, while the number of traders net-short is 8.68% lower than yesterday and 20.13% lower than last week.

We typically take a contrarian view to crowd sentiment, and the fact traders are net-long suggests Gold prices may continue to fall. Traders are further net-long than yesterday and last week, and the combination of current sentiment and recent changes gives us a stronger Gold-bearish contrarian trading bias.