MOMENT OF CELEBRATION: LiteFinance Celebrates its 19th Birthday As a BROKER in the Industry

MOMENT OF CELEBRATION: LiteFinance Celebrates its 19th Birthday As a BROKER in the Industry

Dear clients and partners,

Today, LiteFinance celebrates 19 years of excellence in providing brokerage services in the international financial markets.

In 2005, the company’s journey started under the LiteForex brand. We adopted a fresh approach to Forex trading by designing cent accounts and integrating them into the MT4 ecosystem. Thus, we gave everyone an opportunity to try their hand at trading in the financial markets.

Throughout the years, our company has never ceased to improve the quality of its services and to develop and successfully introduce state-of-the-art solutions. We have set ambitious goals and always achieved them – our numerous achievements have been recognized with prestigious international awards. Despite all our laurels, we are strongly committed to our clients and partners successes.

The past year was rich in qualitative changes. On the company’s birthday, we recall our most important achievements and highlights of the year.

LiteFinance always strives to provide the most favorable conditions for trading in the financial markets. We have reduced commissions on ECN-accounts and markups on CLASSIC accounts for all trading assets several times. The company has also managed to implement technical solutions that allowed us to reduce raw spreads on ECN accounts to the lowest possible level.

LiteFinance has expanded the set of trading platforms. Now, the company’s clients can enjoy cTrader, with a desktop version, web platform and mobile application available. This platform provides extensive opportunities for algorithmic trading, so traders can automate their strategies with the help of robots and maximize potential profits.

We continue to expand the list of trading instruments. Now LiteFinance clients can trade agricultural contracts:

  • cocoa (COCOA);
  • coffee (COFFEE);
  • corn (CORN);
  • soybean (SOYBEAN);
  • wheat (WHEAT).

The list of CFDs on shares of major US and EU-listed companies and cryptocurrency pairs has also been expanded.

Our developers have released a new LiteFinance Partner app for the company’s partners. With its help you can create and place referral links in a few taps, track the efficiency of all affiliate programs, receive detailed information about commission payments and withdraw the reward in a way that suits you best.

The company is expanding into new markets. LiteFinance service can be used by traders from Japan. The geography of regional contests also continues to expand. We launched promotional campaigns in Uzbekistan, Kazakhstan, Turkey, Algeria, Cambodia, Singapore, Latin America, Brazil, and Philippines. We raffled off cars, motorcycles, the cutting-edge gadgets, and tours to various countries around the world as prizes.

LiteFinance: LiteFinance celebrates its 19th anniversary!


LiteFinance’s achievements have been once again recognized by the industry leaders:

LiteFinance: LiteFinance celebrates its 19th anniversary! The company ranked among TOP 100 trusted brokers in the Middle East.
LiteFinance: LiteFinance celebrates its 19th anniversary! LiteFinance also won some of the most prestigious awards:
Best Trading Account for Beginners, following the results of the largest global exposition, Forex Expo Dubai 2023.
LiteFinance: LiteFinance celebrates its 19th anniversary! Best Brokerage Company in MENA countries, according to Global Brands Magazine.
LiteFinance: LiteFinance celebrates its 19th anniversary! Best ECN broker in Asia award at Global Brand Awards 2023.

Our performance statistics:

  • Over 2.6 million active traders have chosen LiteFinance.
  • Daily trading volumes amount to an average of $19 billion.
  • Average daily number of trades is 500 thousand.

We extend our heartfelt gratitude to our partners and regional representatives. Your unwavering support in promoting the LiteFinance brand has been instrumental in our journey. Together, we are making online trading more accessible and enhancing our service quality.

LiteFinance remains steadfast in our commitment to the highest quality standards, continuous service improvement, and innovative product introductions. We are dedicated to providing our clients with every opportunity to succeed in the financial markets.

With best regards,

The team at LiteFinance

LiteFinance Celebrates its 19th Birthday!

Gold (XAU/USD) Latest – Will Fed Chair Powell Help to Break the Precious Metal’s Range?

Gold (XAU/USD) Latest – Will Fed Chair Powell Help to Break the Precious Metal’s Range?

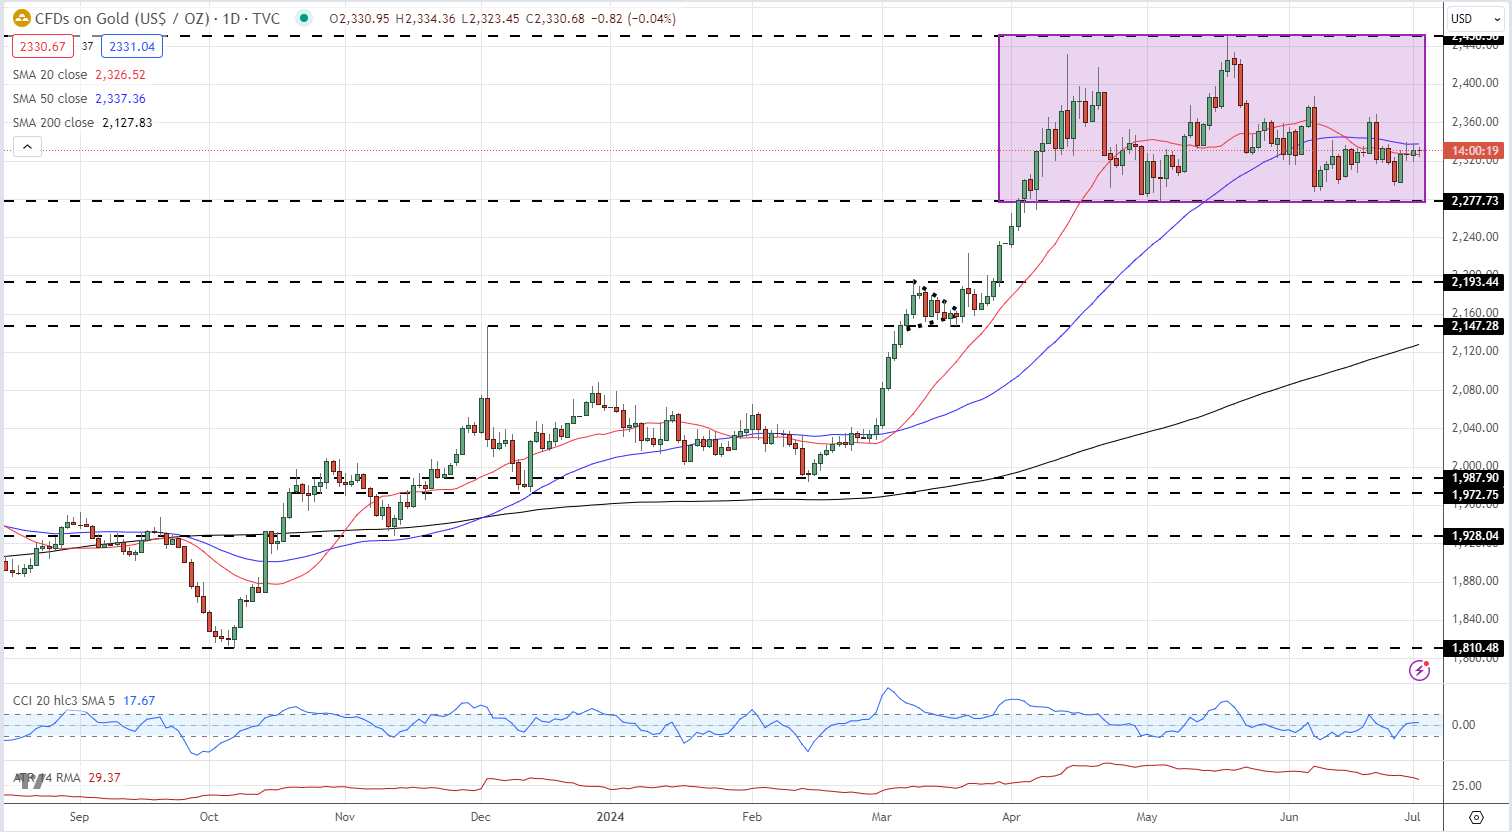
Gold has traded within a defined range over the past three months with neither buyers nor sellers able to gain the upper hand. Volatility has dropped to a multi-week low, while one technical indicator (CCI) shows the precious metal neither overbought nor oversold.

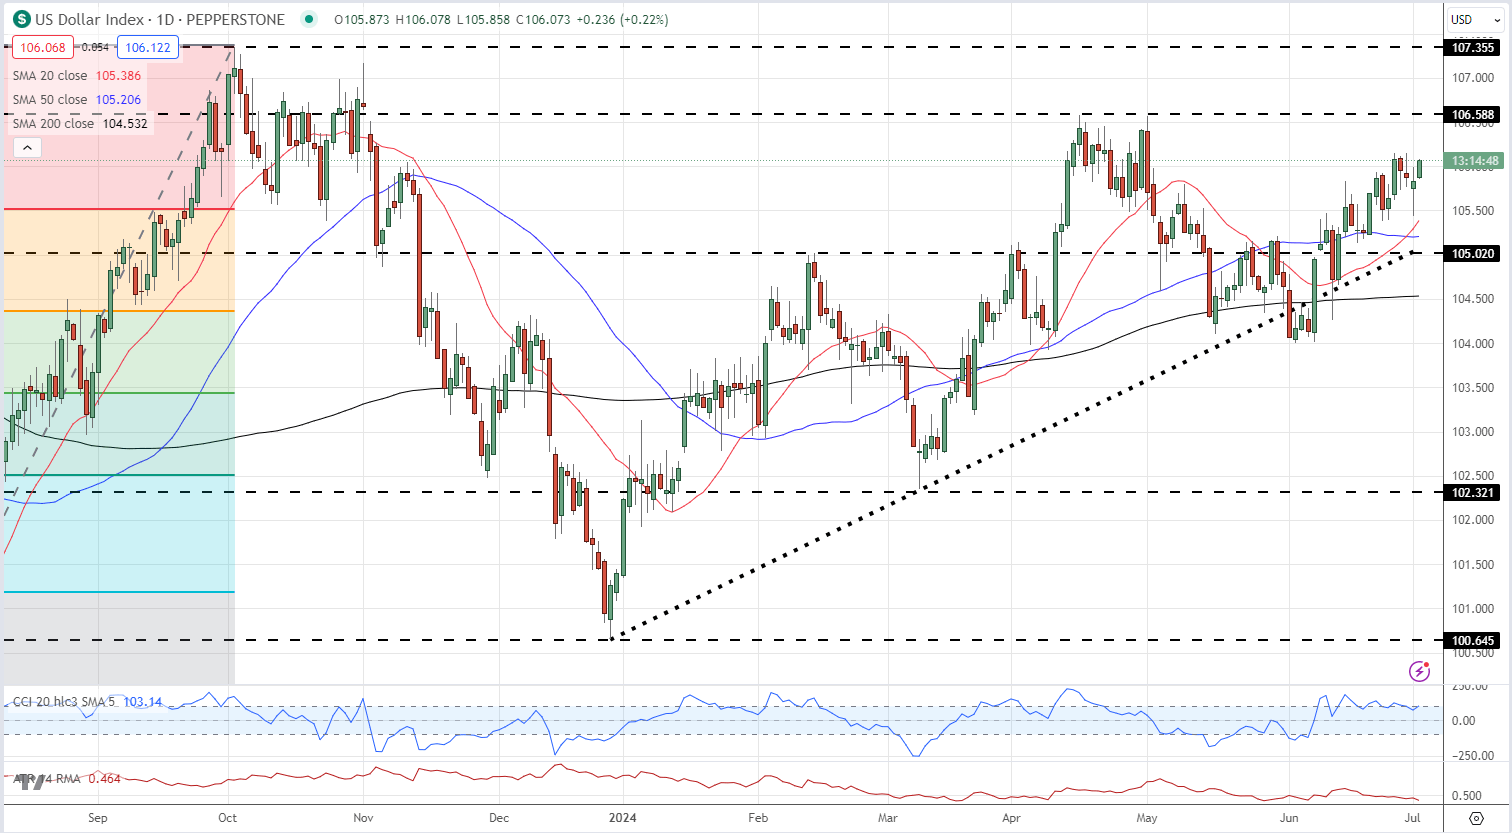
The recent bout of US dollar strength, underpinned by a move higher in longer-dated US Treasury yields, may soon weigh on the precious metal and test range support. Since gold is typically priced in US dollars, a stronger greenback makes gold more expensive for investors using other currencies, potentially reducing demand. The US dollar index (DXY) is now probing levels last seen at the start of May.

US Dollar Index (DXY) Daily Chart

image1.png

This year’s ECB Forum on Central Banking starts in Sintra, Portugal, bringing together various global central bank governors, academics, and financial market representatives. On the Policy Panel today, beginning at 14:30 UK, is Fed chair Jerome Powell and markets will be listening to see if he gives any clues about the health of the US economy and monetary policy moving forward.

ECB Forum on Central Banking in 2024

This week also sees the release of a raft of US jobs reports and data, starting with the latest Jobs Openings and Labor Turnover Survey (JOLTs) at 15:00UK today. Job openings fell to 8.059 million in April, the lowest level since February 2021. Job openings are expected to fall further in today’s report to 7.90 million.

image2.png

Tomorrow sees the release of the latest ADP employment numbers and the weekly initial jobless claims, before the main event of this week, Non-Farm Payrolls are released on Friday at 13:30 UK.

The US jobs data and chair Powell’s appearance at Sintra will be the main driver of any price action in gold this week. The precious metal is testing both the 20- and 50-day simple moving averages and a break below would bring range support into focus.

Gold Daily Price Chart

image3.png

IG retail trader data show 58.77% of traders are net-long with the ratio of traders long to short at 1.43 to 1.The number of traders net-long is 0.41% lower than yesterday and 4.86% lower than last week, while the number of traders net-short is 4.48% higher than yesterday and 5.72% higher than last week.

We typically take a contrarian view to crowd sentiment, and the fact traders are net-long suggests Gold prices may continue to fall. Yet traders are less net-long than yesterday and compared with last week. Recent changes in sentiment warn that the current Gold price trend may soon reverse higher despite the fact traders remain net-long.

Using Stop Loss Orders in Forex Trading

Using Stop Loss Orders in Forex Trading

Market movements can be unpredictable, and the stop loss is one of the few mechanisms that traders have to protect against excessive losses in the forex market. Stop losses in forex come in different forms and methods of application. This article will outline these various forms including static stops and trailing stops, as well as highlighting the importance of stop losses in forex trading.

What is a stop loss?

A forex stop loss is a function offered by brokers to limit losses in volatile markets moving in a contrary direction to the initial trade. This function is implemented by setting a stop loss level, a specified amount of pips away from the entry price. A stop loss can be attached to long or short trades making it a useful tool for any forex trading strategy.

Why is a stop loss order important?

Stops are critical for a multitude of reasons, but it can really be boiled down to one thing: we can never see the future. Regardless of how strong the setup might be, or how much information might be pointing in the same direction – future currency prices are unknown to the market, and each trade is a risk.

In the DailyFX Traits of Successful Traders research, this was a key finding – traders actually do win in many currency pairs the majority of the time. The chart below shows some of the more common pairings.
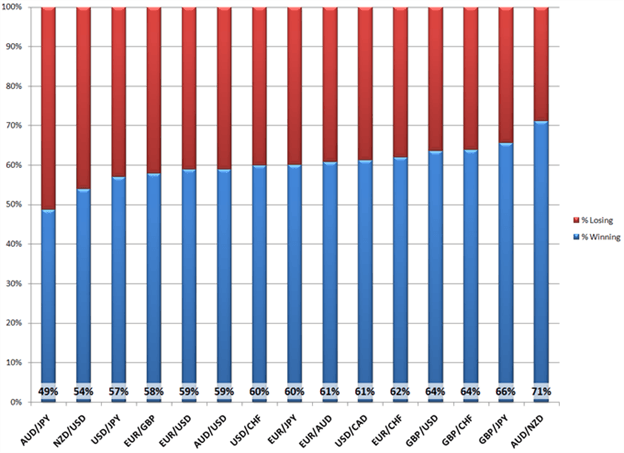
forex winning percentage

As you can see, traders were successfully winning more than half the time in most of the common pairings, but because their money management was often bad they were still losing money on balance.

Traders lost much more when they were wrong (in red) than they made when they were right (blue)

forex profit and loss

In the article Why do Many Traders Lose Money, David Rodriguez explains that traders can look to address this problem simply by looking for a profit target at least as far away as the stop-loss. That is, if a trader opens a position with a 50 pip stop, look for – as a minimum – a 50 pip profit target.

This way, if a trader wins more than half the time, they stand a good chance at being profitable. If the trader is able to win 51% of their trades, they could potentially begin to generate a net profit – a strong step towards most traders’ goals.

Forex stop loss strategies

Below are five strategies to apply in your forex trading when placing stop loss orders:

1. Setting Static Stops

Traders can set forex stops at a static price with the anticipation of allocating the stop-loss, and not moving or changing the stop until the trade either hits the stop or limit price. The ease of this stop mechanism is its simplicity, and the ability for traders to ensure that they are looking for a minimum one-to-one risk-to-reward ratio.

For example, let’s consider a swing-trader in California that is initiating positions during the Asian session; with the anticipation that volatility during the European or US sessions would be affecting their trades the most.

This trader wants to give their trades enough room to work, without giving up too much equity in the event that they are wrong, so they set a static stop of 50 pips on every position that they trigger. They want to set a profit target at least as large as the stop distance, so every limit order is set for a minimum of 50 pips. If the trader wanted to set a one-to-two risk-to-reward ratio on every entry, they can simply set a static stop at 50 pips, and a static limit at 100 pips for every trade that they initiate.

2. Static Stops based on Indicators

Some traders take static stops a step further, and they base the static stop distance on an indicator such as Average True Range. The primary benefit behind this is that traders are using actual market information to assist in setting that stop.

So, if a trader is setting a static 50 pip stop loss with a static 100 pip limit as in the previous example – what does that 50 pip stop mean in a volatile market, and what does that 50 pip stop mean in a quiet market?

If the market is quiet, 50 pips can be a large move and if the market is volatile, those same 50 pips can be looked at as a small move. Using an indicator like average true range, or pivot points, or price swings can allow traders to use recent market information to more accurately analyze their risk management options.

Average True Range can assist traders in setting stops using recent market information

average true range (ATR) in forex

We walk through such a mechanism in our article on Managing Risk with ATR (Average True Range).

3. Manual Trailing Stops

For traders that want the upmost control, forex stops can be moved manually by the trader as the position moves in their favor.

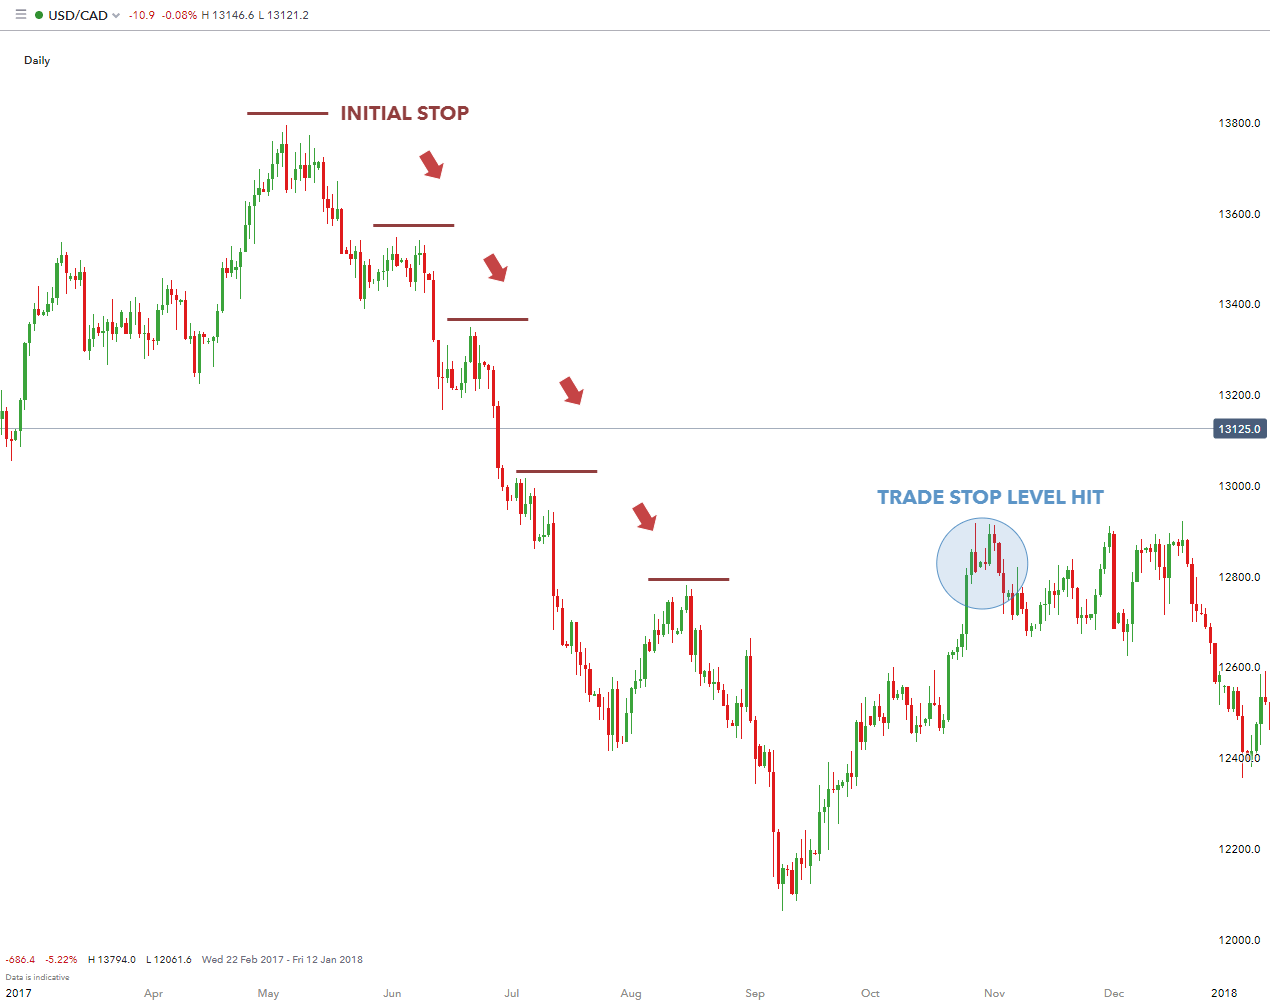
The chart below highlights the movement of stops on a short position. As the position moves further in favor of the trade (lower), the trader subsequently moves the stop level lower. When the trend eventually reverses (and new highs are made), the position is then stopped out.

Trader adjusting stops to lower swing-highs in a strong down-trend

forex stop loss manual stop

Take a look at Trading Trends by Trailing Stops with Price Swings for more information on how to implement the trailing stop.

4. Trailing Stops

It is important to note that some jurisdictions allow brokers to enforce the trailing stop function

Static stop losses can bring vast improvement to a new trader’s approach, but other traders use stops in a different way to further maximize their money management.Trailing stops are stops that will be adjusted as the trade moves in the trader’s favor, in an attempt to further mitigate the downside risk of being incorrect in a trade.

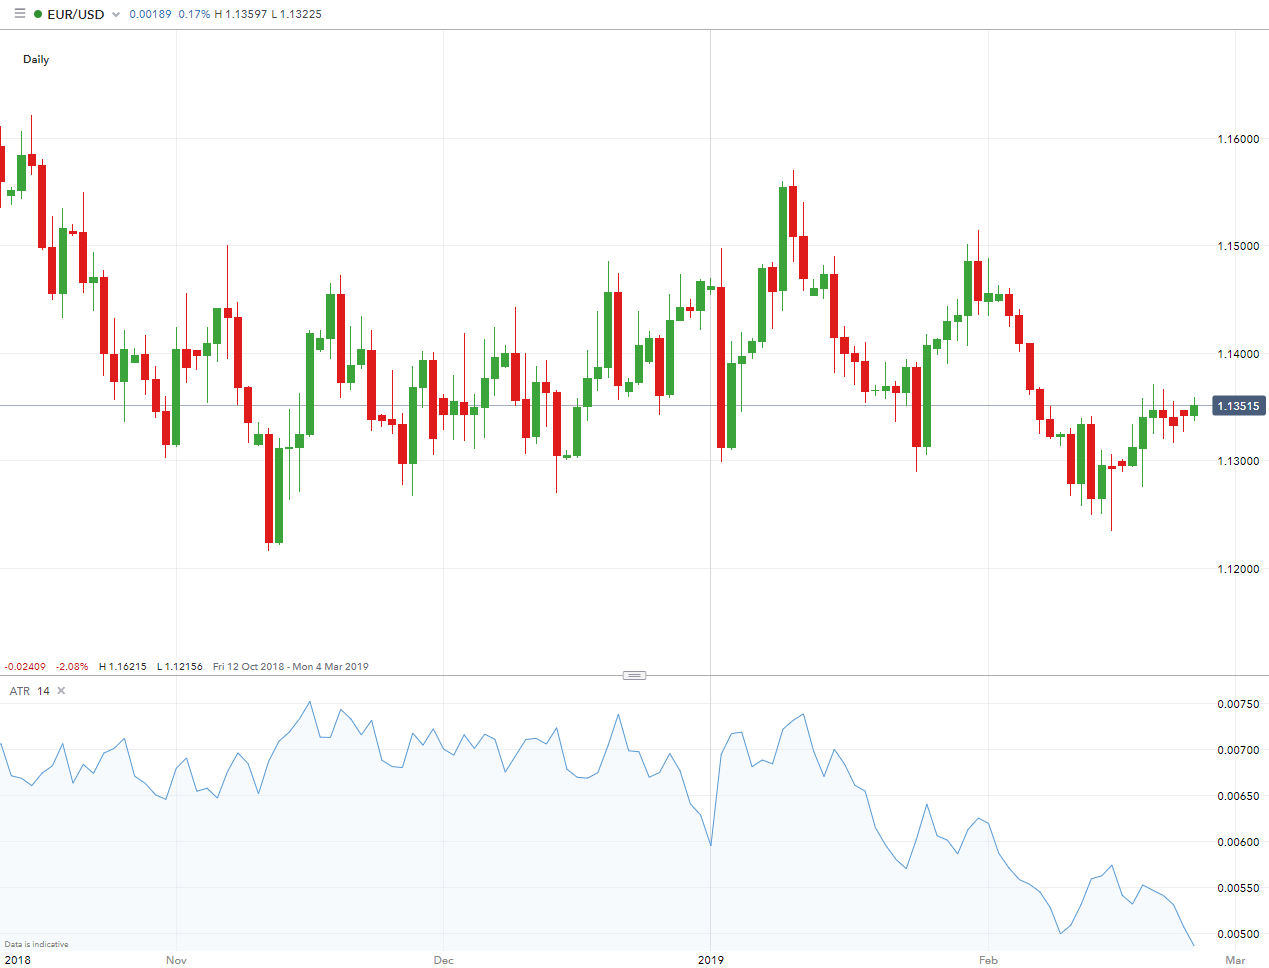
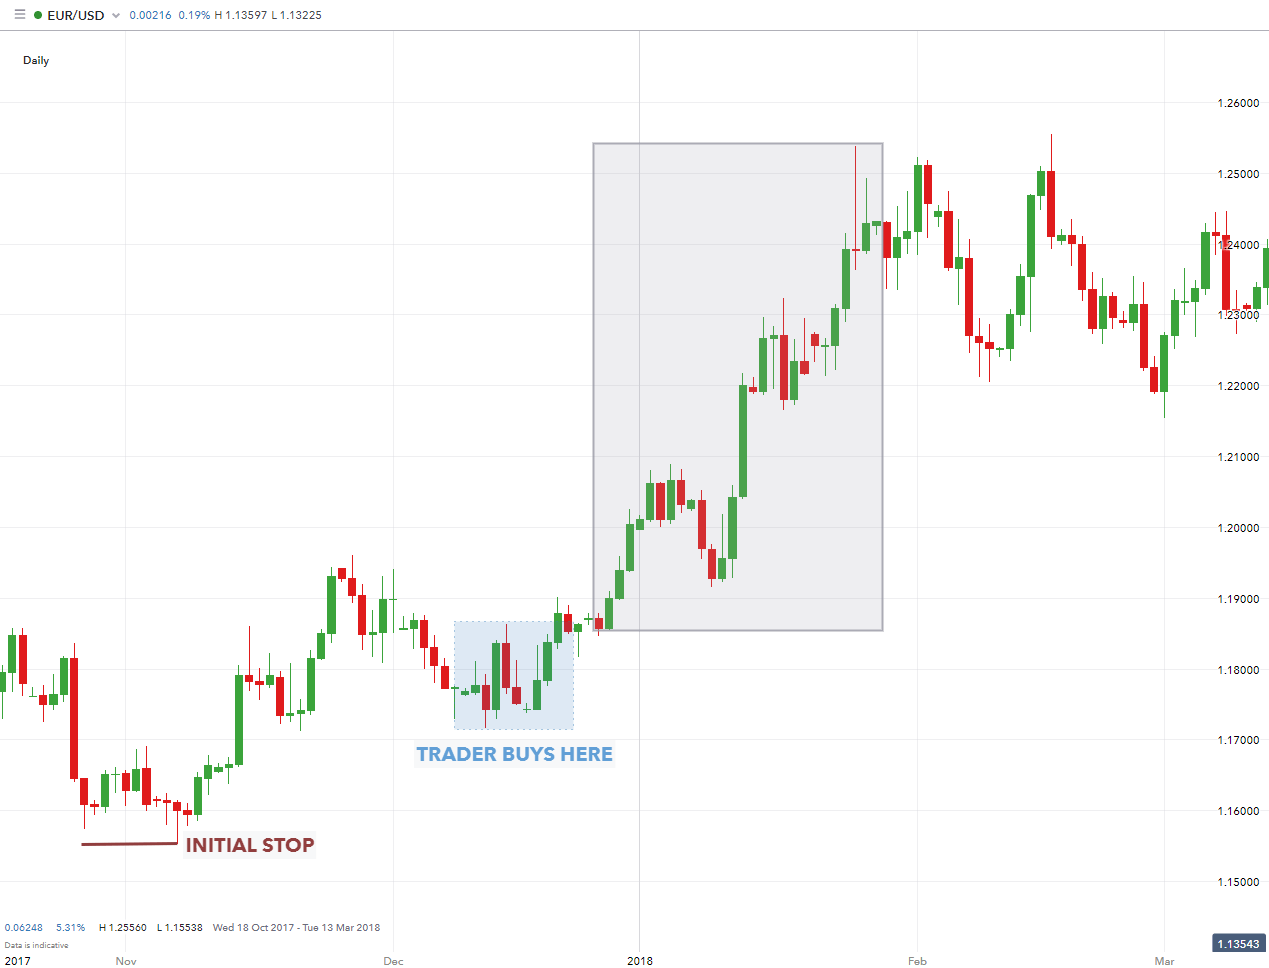
Let’s say, for instance, that a trader took a long position on EUR/USD at 1.1720, with a 167 pip stop at 1.1553. If the trade moves up to 1.1720, the trader may look at adjusting their stop up to 1.1720 from the initial stop value of 1.1553 (see image below).

This does a few things for the trader: It moves the stop to their entry price, also known as ‘break-even’ so that if EUR/USD reverses and moves against the trader, at least they won’t be faced with a loss as the stop is set to their initial entry price.

This break-even stop allows the trader to remove their initial risk in the trade.After which, the trader can look to place that risk in another trade opportunity, or simply keep that risk amount off the table and enjoy a protected position in their long EUR/USD trade.

Break-even stops can assist traders in removing their initial risk from the trade

forex stop loss trailing stop

5. Fixed Trailing Stops

Traders can also set trailing stops so that the stop will adjust incrementally. For example, traders can set stops to adjust for every 10 pip movement in their favor.

Using an example of a trader buying EUR/USD at 1.3100 with an initial stop at 1.3050 – after EUR/USD moves up to 1.3110, the stop adjusts up 10 pips to 1.3060. After another 10 pip movement higher on EUR/USD to 1.3120, the stop will once again adjust another 10 pips to 1.3070. This process will continue until such time as the stop level is hit or the trader manually closes the trade.

Fixed Trailing stops adjust in increments set by the trader

If the trade reverses from that point, the trader is stopped out at 1.3070 as opposed to the initial stop of 1.3050; a savings of 20 pips had the stop not adjusted.

What is the Best Time Frame to Trade Forex?

What is the Best Time Frame to Trade Forex?

Traders utilize varying time frames to speculate in the forex market. The two most common are long- and short-term-time frames which transmits through to trend and trigger charts. Trend charts refer to longer-term time frame charts that assist traders in recognizing the trend, whilst trigger chart pick out possible trade entry points. This article will explore these forex trading time frames in depth, whilst offering tips on which can best serve your trading goals.

Talking points:

  • How to decide the best time frame to trade forex
  • What are the main forex time frames
  • Using multiple time frame analysis

How to decide the best time frame to trade forex

As mentioned above, the best time frame to trade forex will vary depending on the trading strategy you employ to meet your specific goals. The table below summarizes variable forex time frames used by different traders for trend identification and trade entries, which are explored in more depth below:

CHART DAY TRADING SWING TRADING POSITION TRADING
TREND CHART 30 minutes – 4 hours Daily Weekly
TRIGGER CHART 5 – 60 minutes 2 – 4 hours Daily

Main forex trading time frames

Traders utilize different strategies which will determine the time frame used. For example, a day trader will hold trades for a significantly shorter period than that of a swing trader. Read our guide for a basic introduction to different trading styles.

1) Position trading time frames

The position trading time frame varies for different trading strategies as summarized in the table above. This could fluctuate from daily to yearly under the ‘long-term’ definition.

Many new traders tend to avoid this approach because it means long periods of time before trades are realized. However, by many accounts, trading with a shorter-term (day trading) approach can be far more problematic to execute successfully, and it often takes traders considerably longer to develop their strategy.
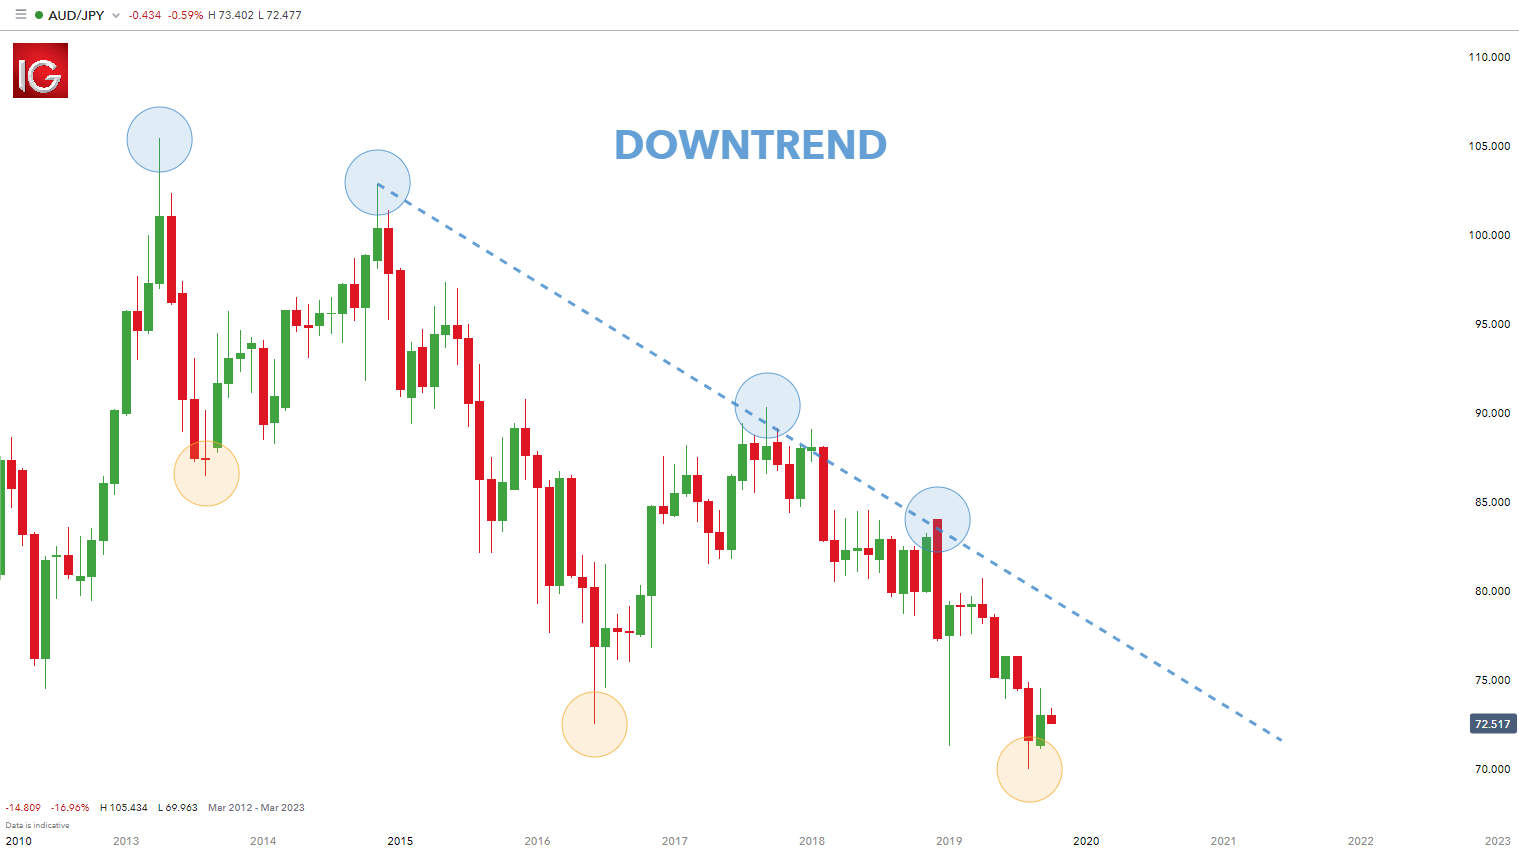
Position trading (longer-term) approaches can look to the monthly chart for grading trends, and the weekly chart for potential entry points.

Position trading example

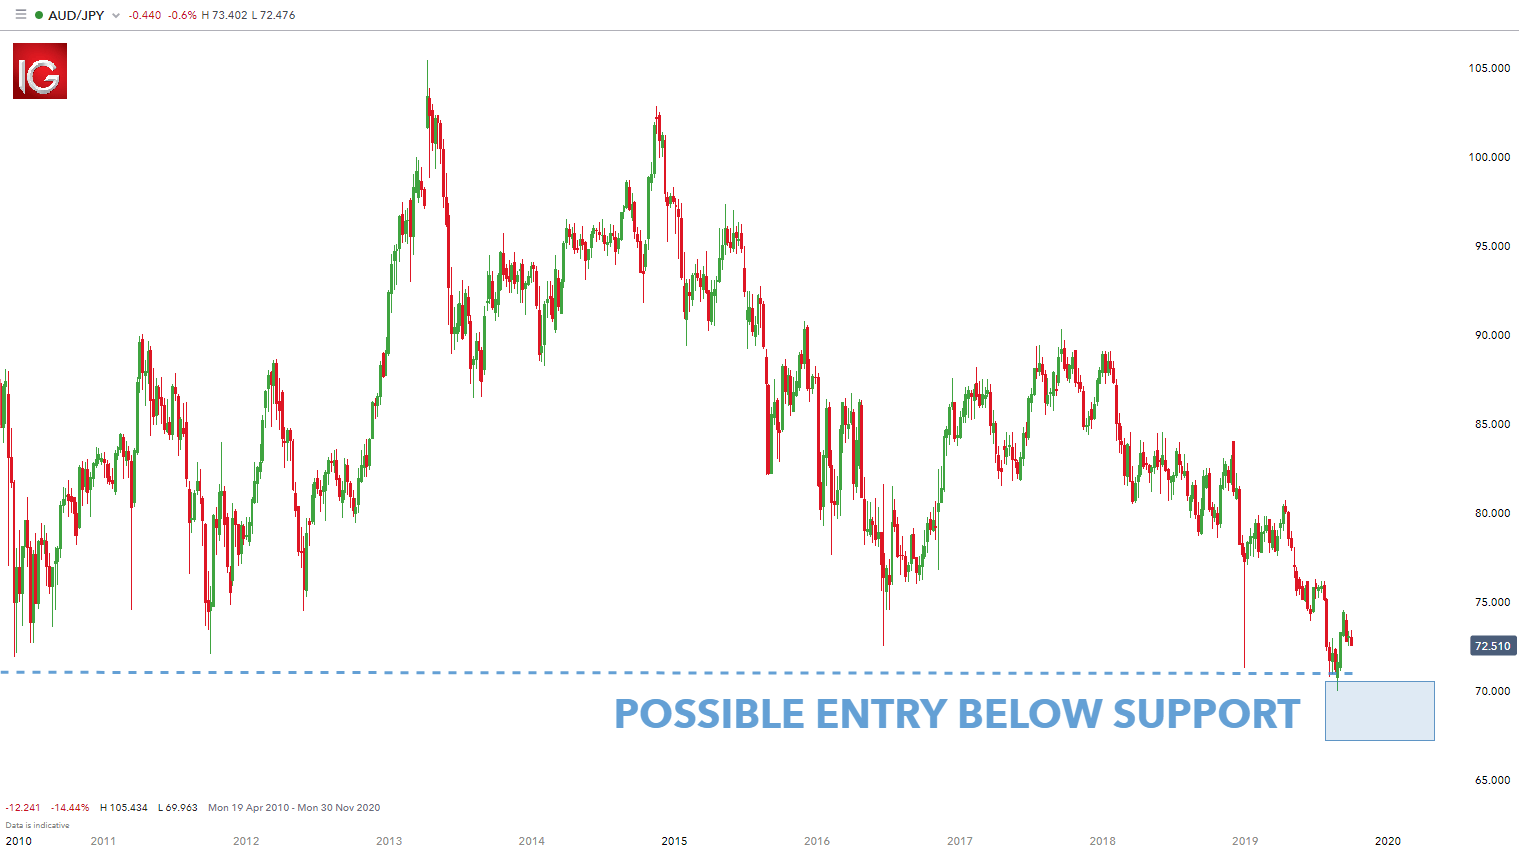
After the trend has been determined on the monthly chart (lower highs and lower lows), traders can look to enter positions on the weekly chart in a variety of ways. Many traders look to utilize price action (as seen in the weekly chart below) for determining trends and/or entering positions, but indicators can absolutely be utilized here as well.

Monthly AUD/JPY trend chart:

long-term time frame monthly

Weekly AUD/JPY trigger chart:

long-term time frame weekly

2) Swing trading time frames

After a trader has gained comfort on the longer-term chart, they can then look to move slightly shorter in their approach and desired holding times. This can introduce more variability into the trader’s approach, so risk and money management should be addressed before moving down to shorter time frames.

Swing trading is a happy medium between a long-term trading time frame and a short-term, scalping approach. One of the best benefits of swing trading is that traders can get the benefits of both styles without necessarily taking on all the downsides. As a result, this makes swing trading a very popular approach to the markets.

Swing traders will check the charts a couple times per day in case any big moves occur in the marketplace. This affords traders the benefit of not having to watch markets continuously while they’re trading. Once an opportunity is identified, traders place the trade with a stop attached and monitor at a later stage to see the progress of the trade.

Another advantage of this approach is that the trader is still looking at charts often enough to seize opportunities as they exist. This eliminates one of the downsides of longer-term trading in which entries are generally placed on the weekly/daily charts.

Swing trading example

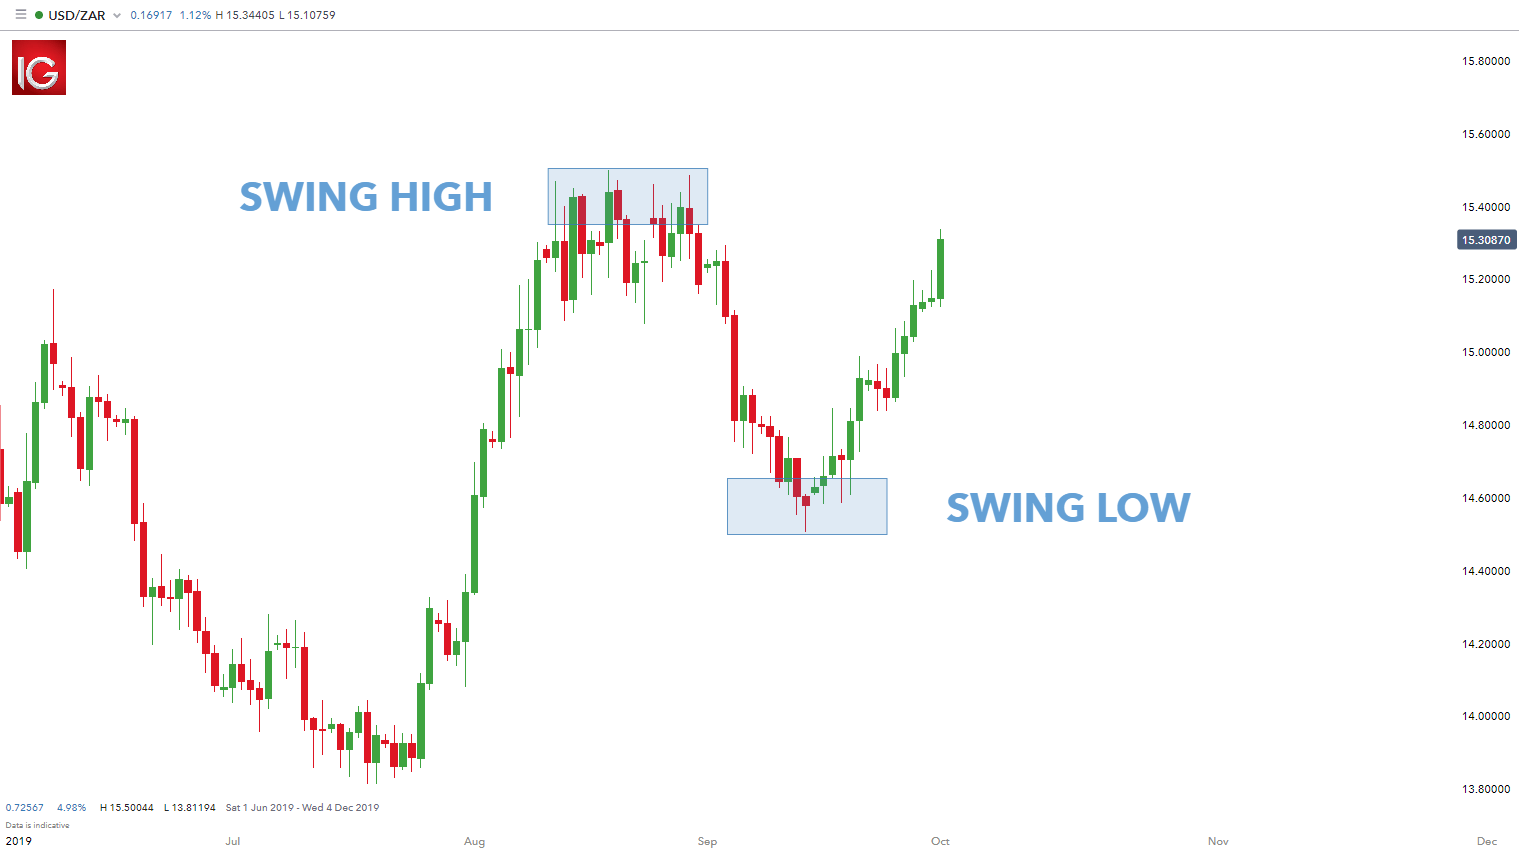
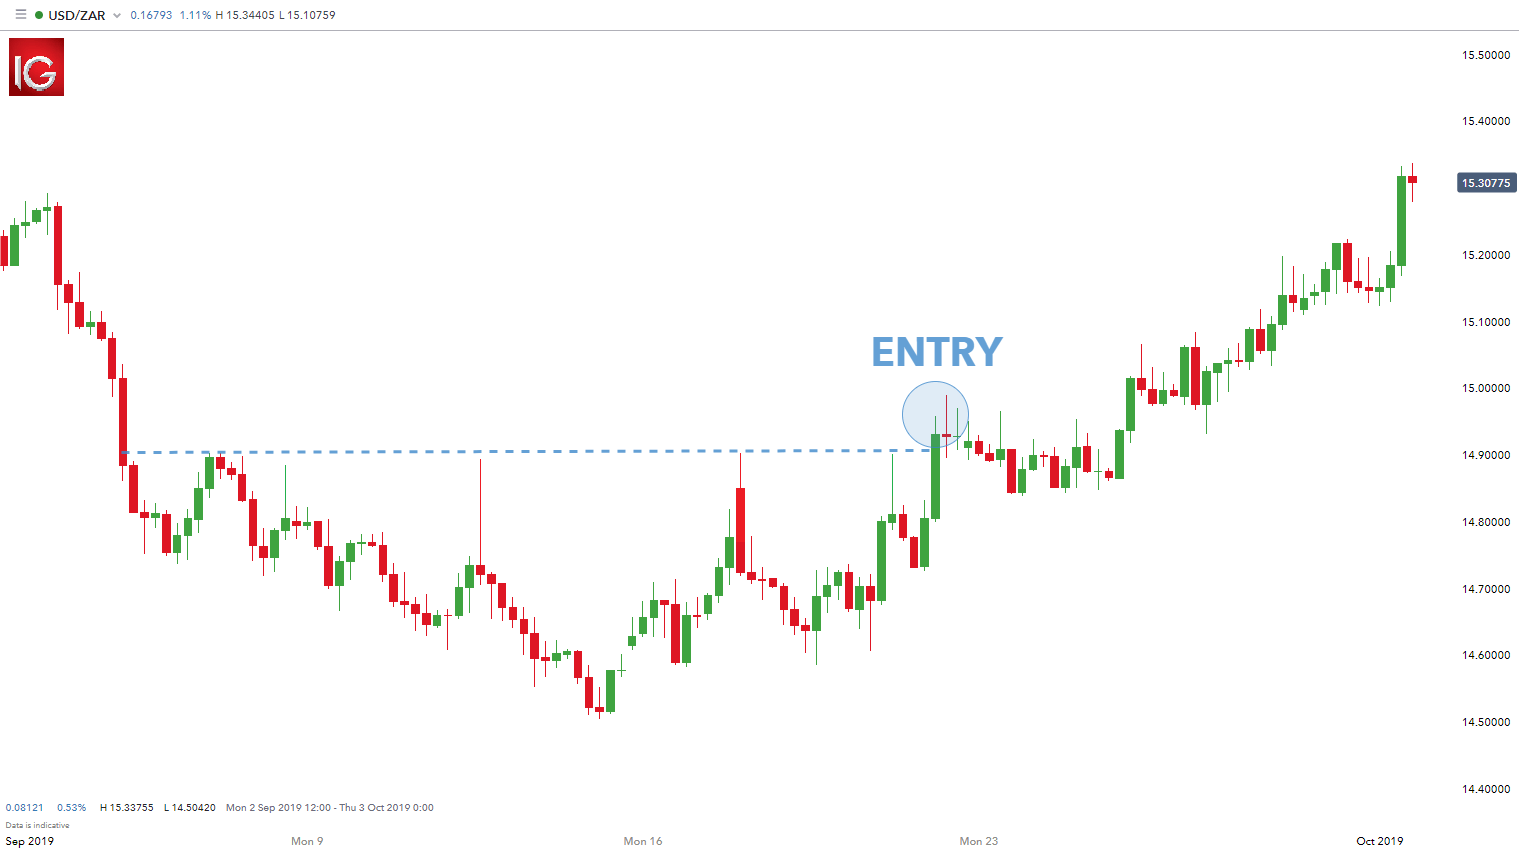
For this approach, the daily chart is often used for determining trends or general market direction and the four-hour chart is used for entering trades and placing positions (see below). The daily chart shows the recent swing high and low respectively. Traders usually trade swings back in the direction of the preceding trend – in this example the preceding trend is upwards.

Now that the trade direction has been identified, the swing trader will then diminish the time frame to four-hours to look for entry points. In the example below, there is a clear price resistance level that the swing trader will look at when entering a long trade. Once price breaks or the candle closes above the designated resistance level, traders can look to enter.

Daily USD/ZAR trend chart:

medium-term time frame daily

4-hour USD/ZAR trigger chart:

medium-term time frame 4-hour

3) Day trading time frames

Day trading can be one of the most difficult strategies of finding profitability. Newer traders implementing a day trading strategy are exposing themselves to more frequent trading decisions that may not have been practiced for very long. This combination of experience and frequency opens the door for losses that might have been prevented had the trader opted for a slightly longer approach like swing trading.

The scalper or day trader is in the unenviable position of needing the price to move quickly in the direction of the trade. Therefore, the day trader becomes tied to the charts as they seek the market’s trends for that day. Obsessing over charts for long periods of time can lead to fatigue. The shorter-term approach also affords a smaller margin of error.

Generally, there is less profit potential in short-term trading which leads to tighter stops levels. These tighter stops mean higher probability of failed trades as opposed to longer-term trading.To trade with a very short-term approach, it’s advisable for a trader to get comfortable with a longer-term, and swing-trading approach before moving down to the very short time frames.

Resembling longer-term trading, day traders can look to evaluate trends on the hourly chart and locate entry opportunities on the ‘minute’ time frames such as five or ten-minute charts. The one-minute time frame is also an option, but extreme caution should be used as the variability on the one-minute chart can be very random and difficult to work with. Once again, traders can use a variety of triggers to initiate positions once the trend has been determined – price action or technical indicators.

Day trading example

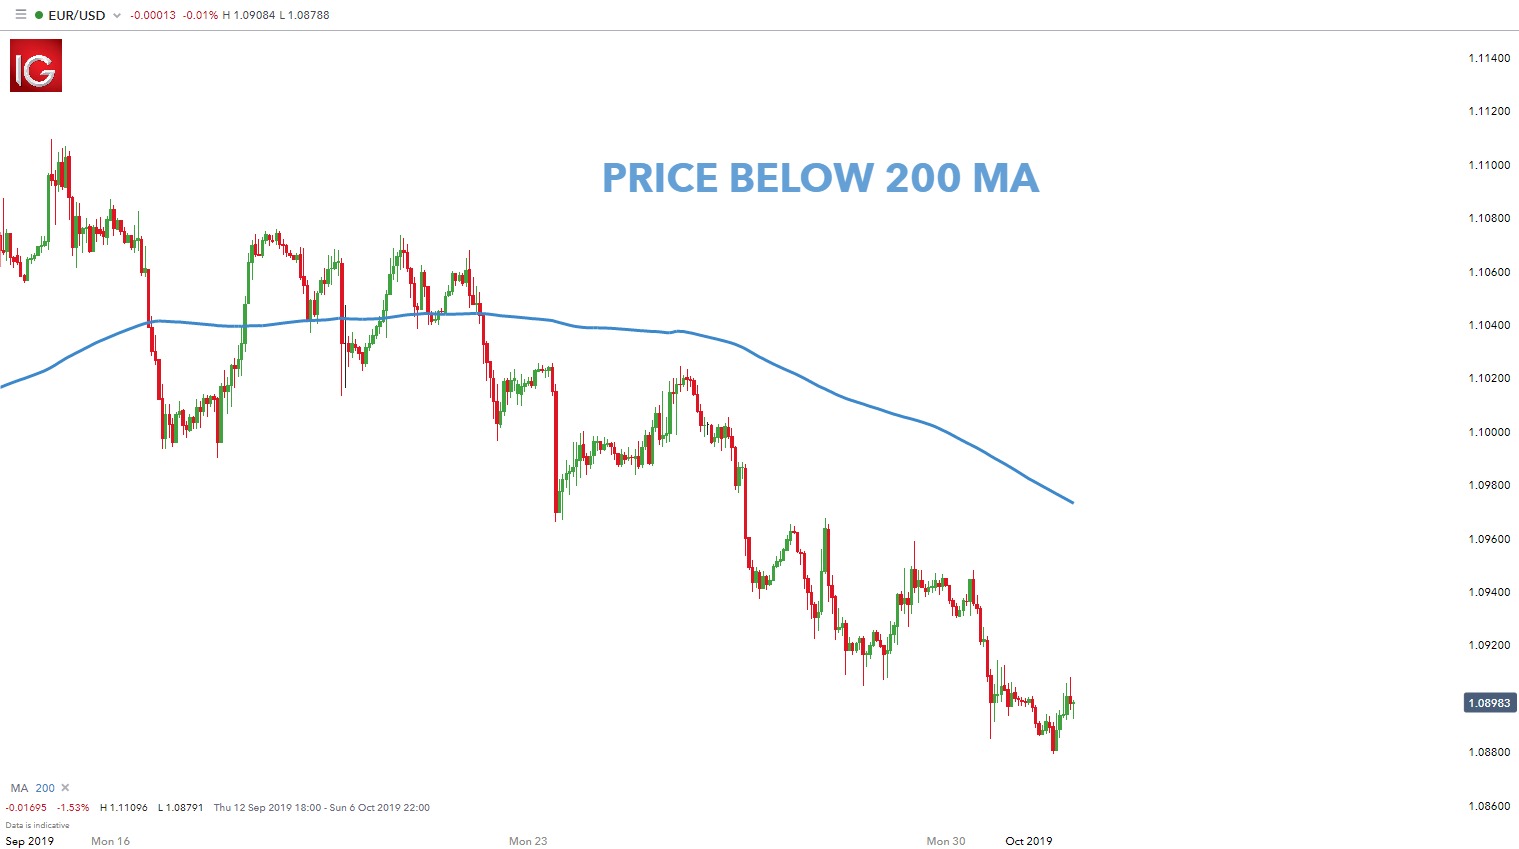
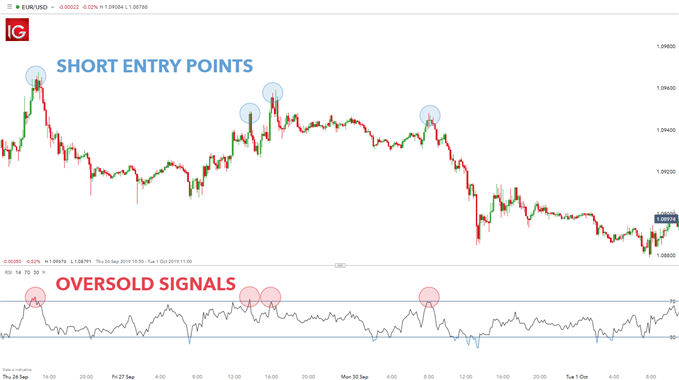
The charts below use the hourly chart to determine the trend – price below 200-day moving average indicating a downtrend. The second 10-minute chart uses the RSI indicator to assist in short-term entry points. In this case, the trader only identifies overbought signals on the RSI (highlighted in red) because of the longer-term preceding downtrend.

Hourly EUR/USD trend chart:

short-term time frame hourly

10-minute EUR/USD trigger chart:

short-term time frame 10 minute

Using multiple time frame analysis

The best time frame to trade forex does not necessarily mean one specific time frame. It is possible to combine approaches to find opportunities in the forex market. Find out more in our guide to multiple time frame analysis.

USD/JPY and GBP/JPY – Sentiment Analysis and Charts

USD/JPY and GBP/JPY – Sentiment Analysis and Charts

USD/JPY: Decoding Market Sentiment Amidst Shifting Tides

image1.pngThe latest retail traders data paints a complex picture for USD/JPY. Current data shows a mere 17.15% of retail traders holding long positions, with shorts outnumbering longs by nearly 5 to 1. Yet, beneath this bearish surface, currents of change are stirring.

Long positions are on the rise, climbing 16.84% day-over-day and 9.34% week-over-week. While our contrarian approach typically views net-short sentiment as a bullish signal, the recent reduction in bearish conviction hints at a potential trend reversal. This evolving sentiment landscape offers valuable insights for strategic positioning in the USD/JPY market.

USD/JPY Daily Price Chart

image2.png

GBP/JPY Market Dynamics: Poised for Potential Upswing

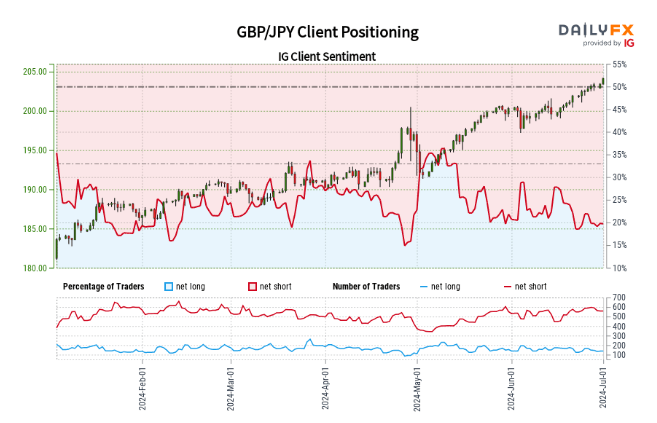
image3.pngRecent retail trader data reveals intriguing insights into the GBP/JPY currency pair. A mere 19.38% of traders are currently maintaining long positions, resulting in a short-to-long ratio of 4.16 to 1. This pronounced bearish sentiment among retail traders often serves as a contrarian indicator, suggesting the possibility of continued upward momentum for the GBP/JPY.

Temporal shifts in trader positioning add another layer of complexity to the market outlook. While the number of traders holding long positions has increased by 8.27% since yesterday, it has markedly decreased by 18.64% compared to last week. Conversely, short positions have seen growth both on a daily (6.39%) and weekly (3.63%) basis.

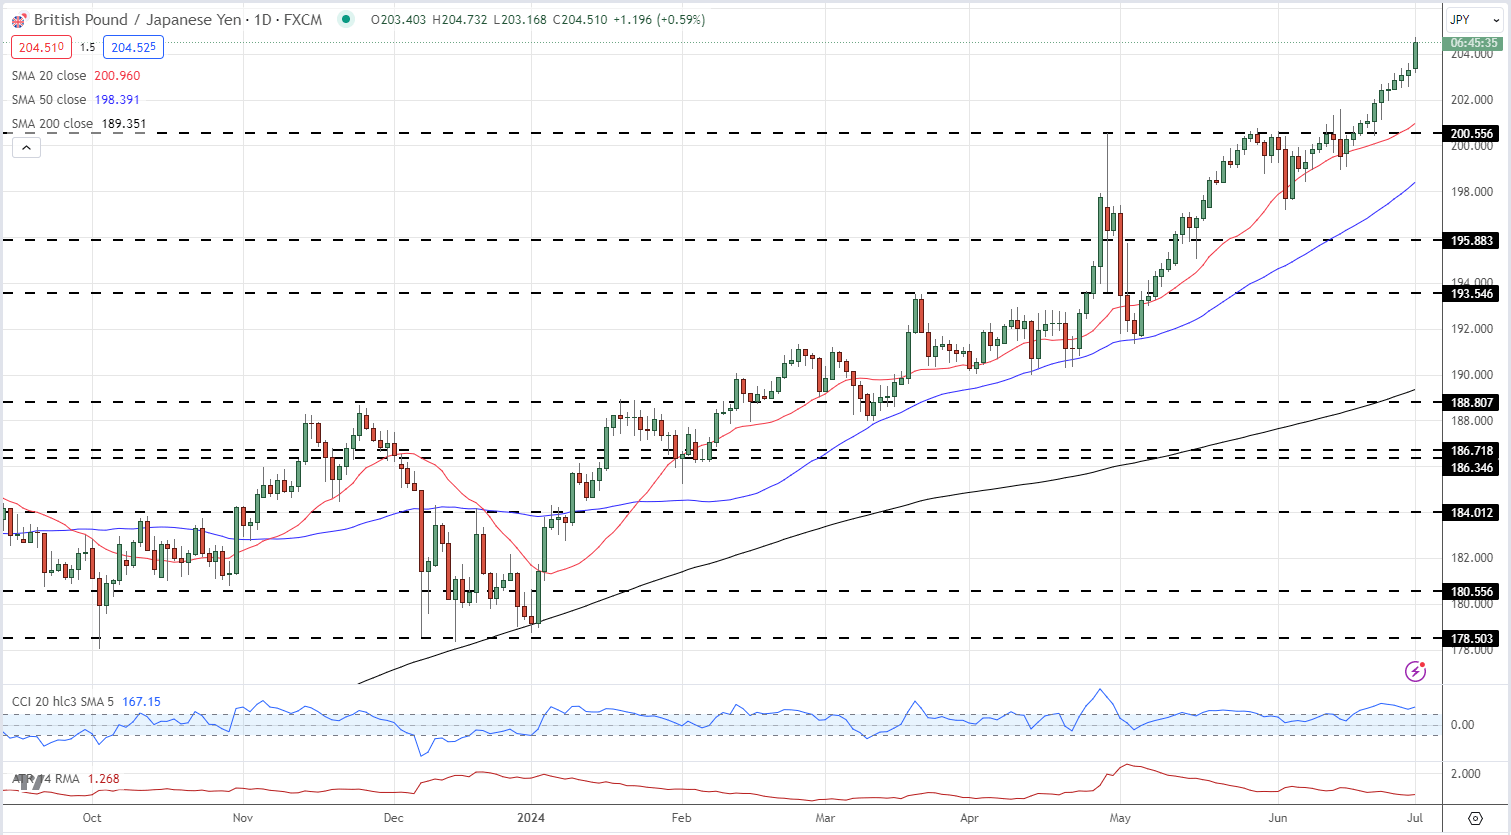
This nuanced picture of trader sentiment and its recent fluctuations presents a mixed trading bias for the GBP/JPY. The overall net-short positioning has moderated since yesterday but intensified compared to last week, creating a delicate balance of market forces, and highlighting a mixed trading bias.

GBP/JPY Daily Price Chart

image4.png

Euro and CAC 40 Rally After the First Round of French Elections

Euro and CAC 40 Rally After the First Round of French Elections

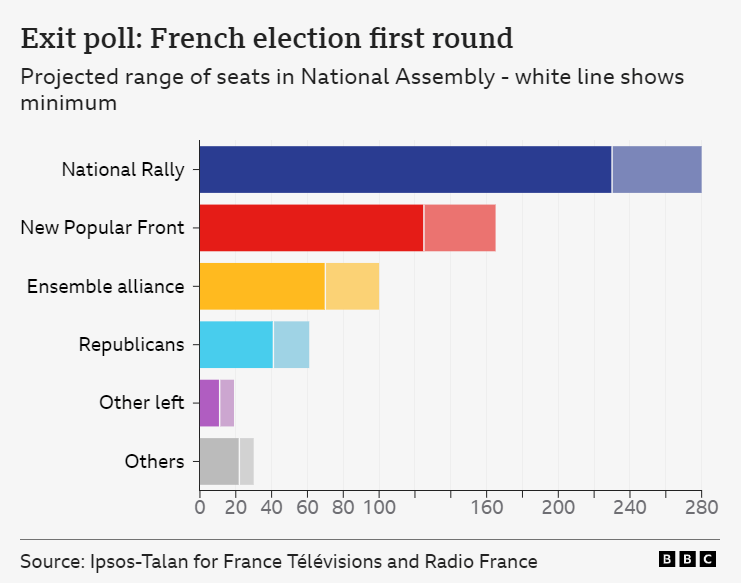
The first round of the French elections saw the right-wing National Rally (RN) party pick up nearly 34% of the vote, as widely expected, with the left-wing New Popular Front polling just over 28%, and President Macron’s incumbent alliance placing third with around 21%. While the RN has a possibility of gaining the 289 seats needed to form a government, the latest polls show them falling short by around 10 seats at next Sunday’s second round.

image1.png

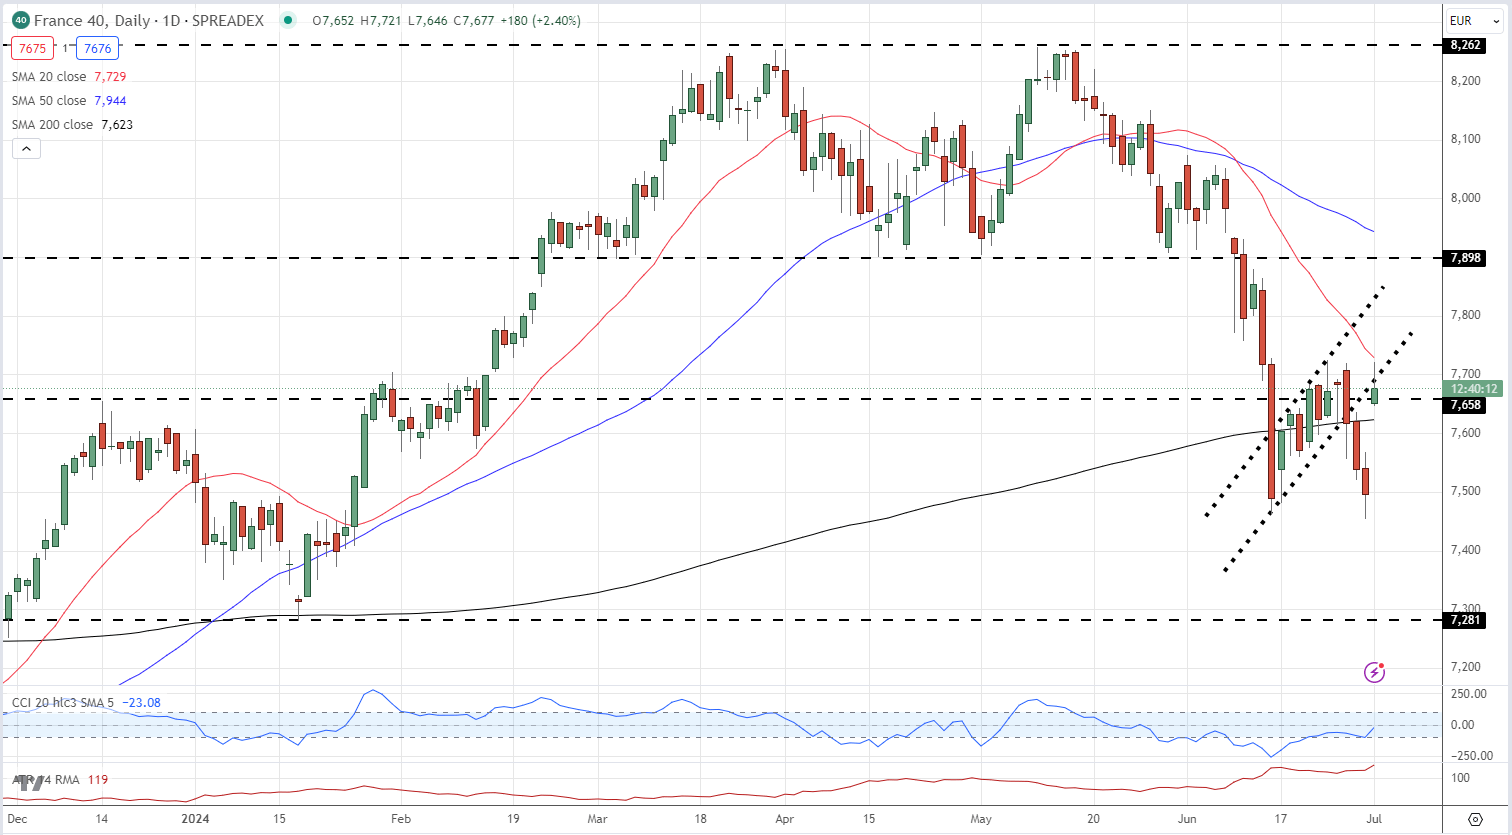
The Euro and the CAC 40 have both opened the week in positive territory, buoyed by the fact that the RN may not get into power. The CAC 40 trades 2.5% higher around 7,685 but remains around 550 points below the May 10th high of 8,262. This week will see tactical voting alliances being formed and broken in France, leading to greater volatility in the CAC 40.

CAC 40 Daily Price Chart

image2.png

All charts using TradingView

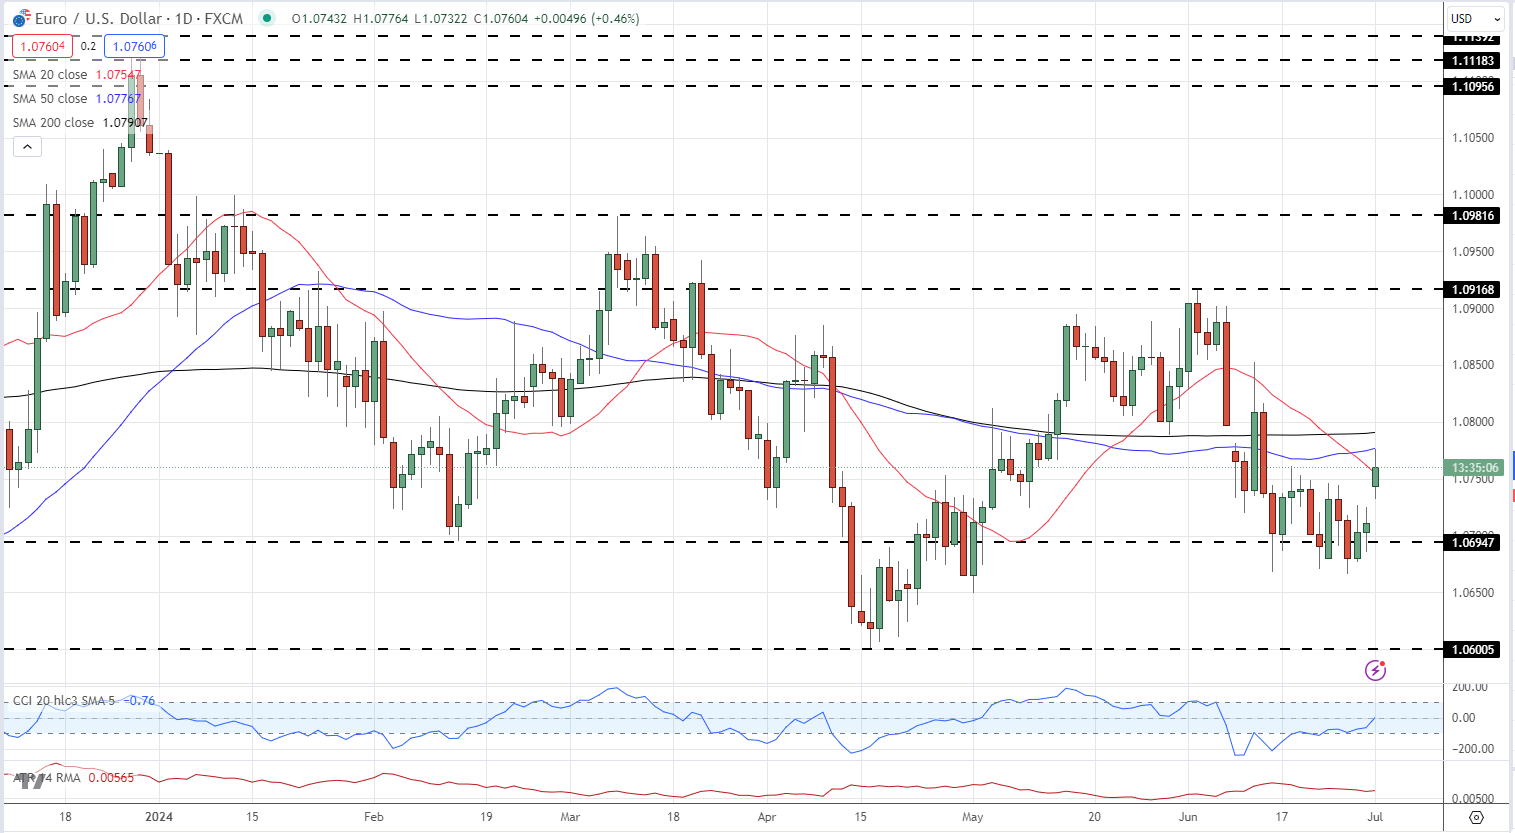
The Euro has opened the week higher, although further gains may be muted ahead of next week’s elections. EUR/USD is currently trading around 1.0765, a near three-week high, but looks likely to struggle to push appreciably higher. This week’s sees some important US data releases and events that will direct the pair, with Friday’s US Jobs Report (NFP) the standout.

EUR/USD Daily Price Chart

image3.png

Retail trader data shows 50.39% of traders are net-long with the ratio of traders long to short at 1.02 to 1.The number of traders net-long is 10.75% lower than yesterday and 25.08% lower than last week, while the number of traders net-short is 21.60% higher than yesterday and 30.87% higher than last week.

We typically take a contrarian view to crowd sentiment, and the fact traders are net-long suggests EUR/USD prices may continue to fall. Yet traders are less net-long than yesterday and compared with last week. Recent changes in sentiment warn that the current EUR/USD price trend may soon reverse higher despite the fact traders remain net-long.

Japanese Yen Q3 Technical Outlook: Bulls Ease off as Risk of a Sharp, Sudden Bearish Reversal Build

Japanese Yen Q3 Technical Outlook: Bulls Ease off as Risk of a Sharp, Sudden Bearish Reversal Build

USD/JPY Forecast

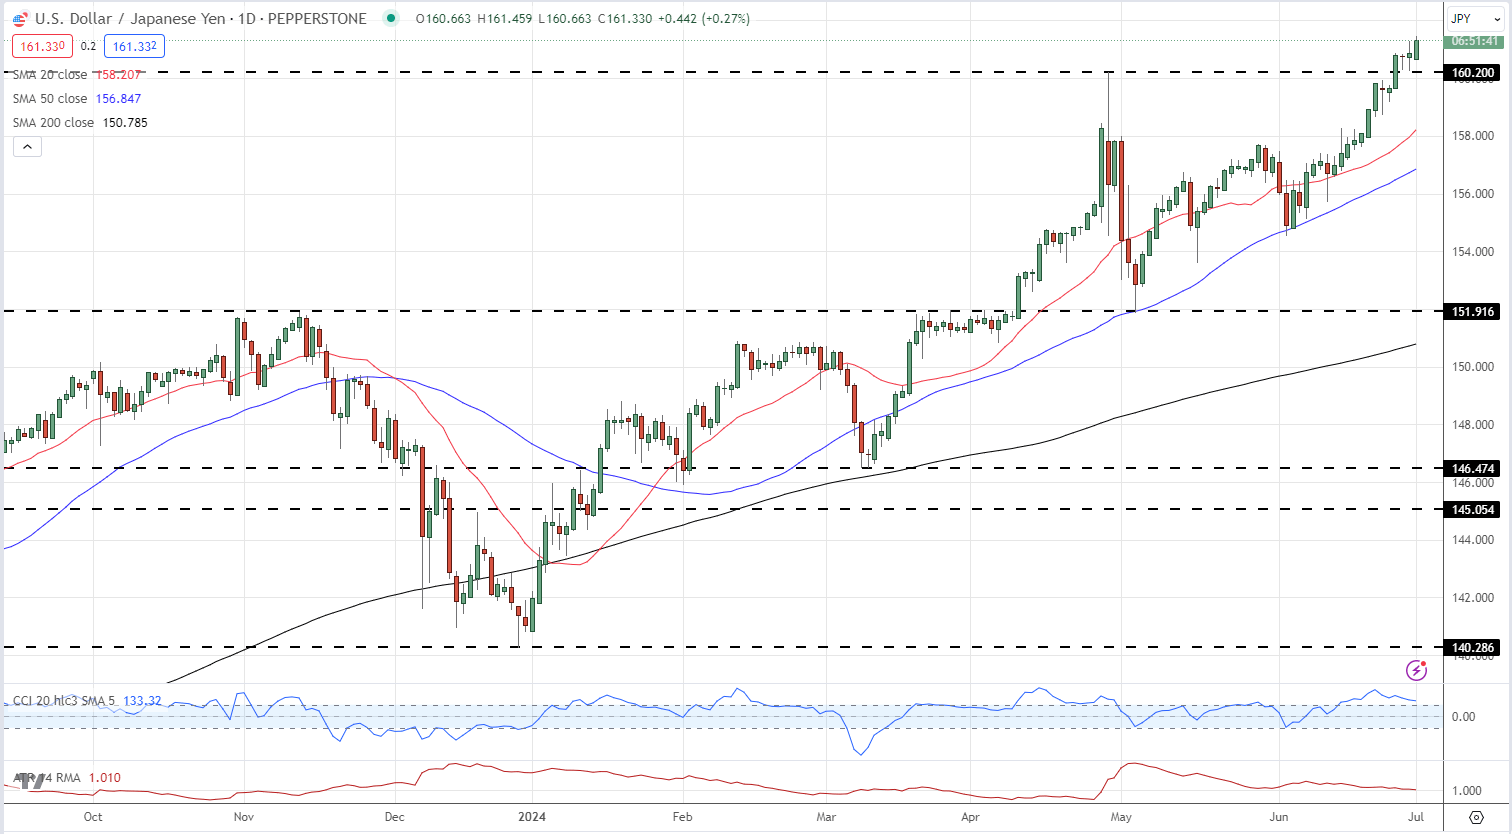
The bullishness of USD/JPY can be seen in the multiple uptrends now in place. The dominant upward channel from early January is perhaps the most obvious but, even were that to give way completely to the downside, which looks unlikely, the Dollar would still find considerable support in the uptrend from early 2023 which hasn’t been challenged at all since the first month of this year.

Clearly the market is getting a little warier as it returns to the 158-160 levels at which the authorities in Tokyo stepped in to buy the Yen back in May. Volatility has fallen and weekly ranges have narrowed as that point approaches again.

That range is likely to be the first major battlefield of the coming three months, with its fate dictating the near-term direction.

USD/JPY Weekly Chart

A graph with a line and a line  Description automatically generated with medium confidence

AUD/JPY Forecast

AUD/JPY is back at the highs last briefly attempted in April 2013. While the Australian Dollar is still inside the dominant uptrend channel from 2020’s lows, there are signs that psychological resistance at 105.00 is proving a major hurdle on the road higher. The market is also a very long way above both its 50- and 200-day moving averages.

The cross will probably closely follow USD/JPY, but the coming three months could bring some consolidation below current peak. The Australian Dollar is closely correlated with overall risk appetite, of course, while the Yen tends to prove attractive only when investors are feeling risk averse. That dynamic will remain key for AUD/JPY this quarter.

AUD/JPY Weekly Chart

A graph of a stock market  Description automatically generatedAfter acquiring a thorough understanding of the technical aspects surrounding the Japanese Yen in Q3, why not see what the fundamental landscape suggests by downloading the full Japanese Yen forecast for the third quarter?

Gold, Silver Q3 Technical Forecast: Gold’s Range intact, Longer-Term Silver Uptrend Under Threat

Gold, Silver Q3 Technical Forecast: Gold’s Range intact, Longer-Term Silver Uptrend Under Threat

Gold and Silver Q3 Technical Analysis

Over the last two months, Gold has been stuck in a well-defined daily range with neither buyers or sellers able to take control of price action. The daily Silver chart is different with a five-month series of higher-lows and higher-highs still in place, suggesting higher prices in the weeks ahead. Gold’s range and Silver’s trend both remain in place and may offer reliable set-ups for Q3.

Gold Q3 Technical Outlook

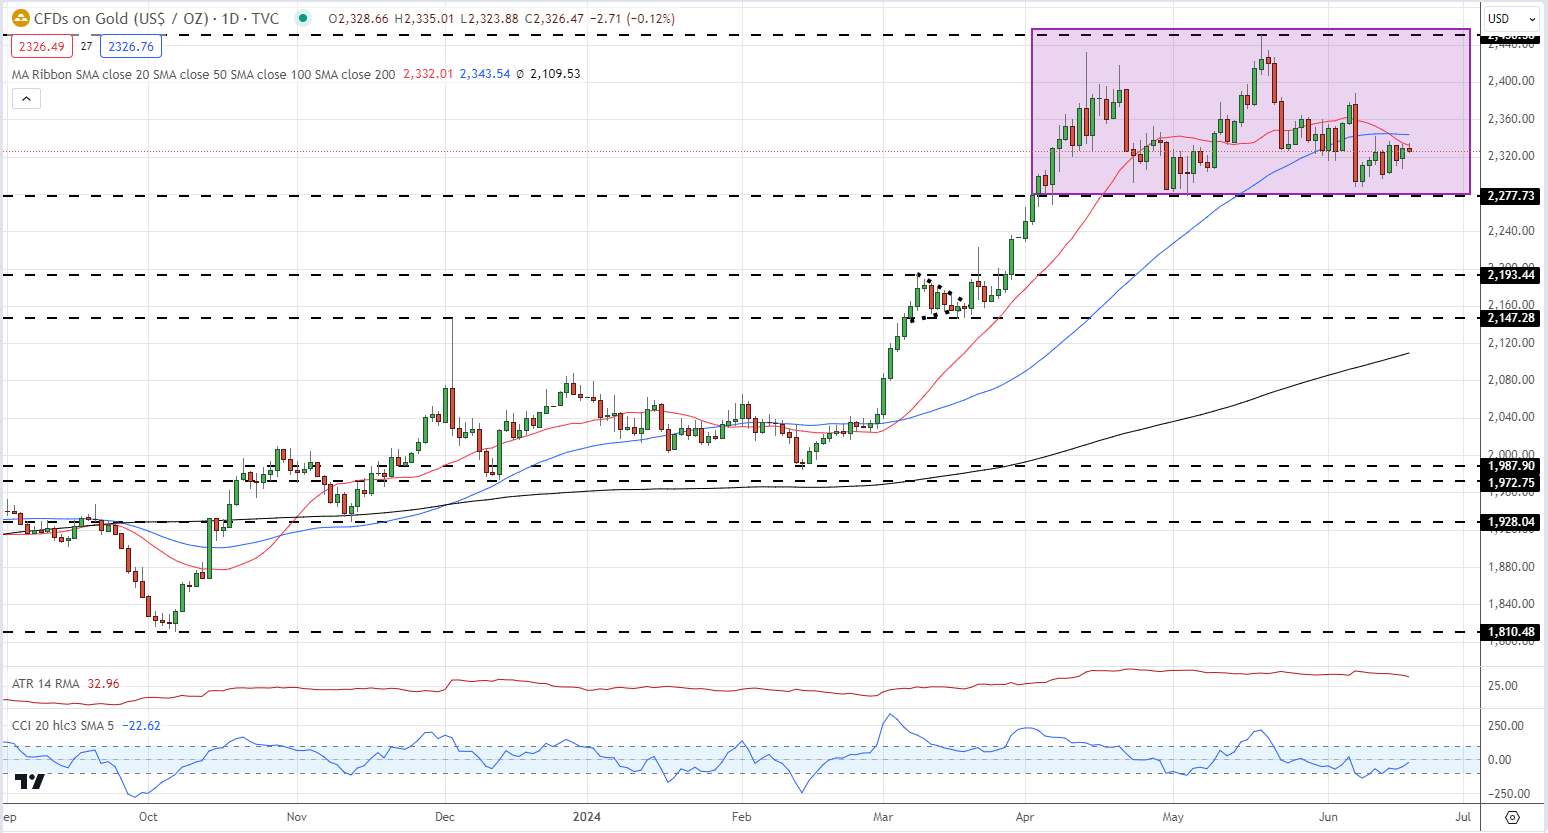
While traders normally look for a trend or a breakout pattern, a sideways range-trade can be just as profitable – potentially – as well as easy to control with noted areas of resistance and support. The daily Gold chart is currently showing a well-defined range that has held since early-April and this looks set to hold if both support and resistance remain in place. The CCI indicator (bottom of the chart) is in neutral territory, while a break above the 20- and 50-day smas would allow Gold to move back towards resistance. Support around the $2,277/oz. level has been tested in early-May and early-June and held, while the early-June pattern is currently mirroring the early-May rally. A break above the June 7th high at $2,387/oz. would suggest that the range trade remains in place.

Gold Daily Price Chart

image6.png

After acquiring a thorough understanding of the technical backdrop for Gold and Silver in Q3, why not see what the fundamental landscape suggests by downloading the comprehensive Gold and Silver forecast for the third quarter?

Silver Q3 Technical Outlook

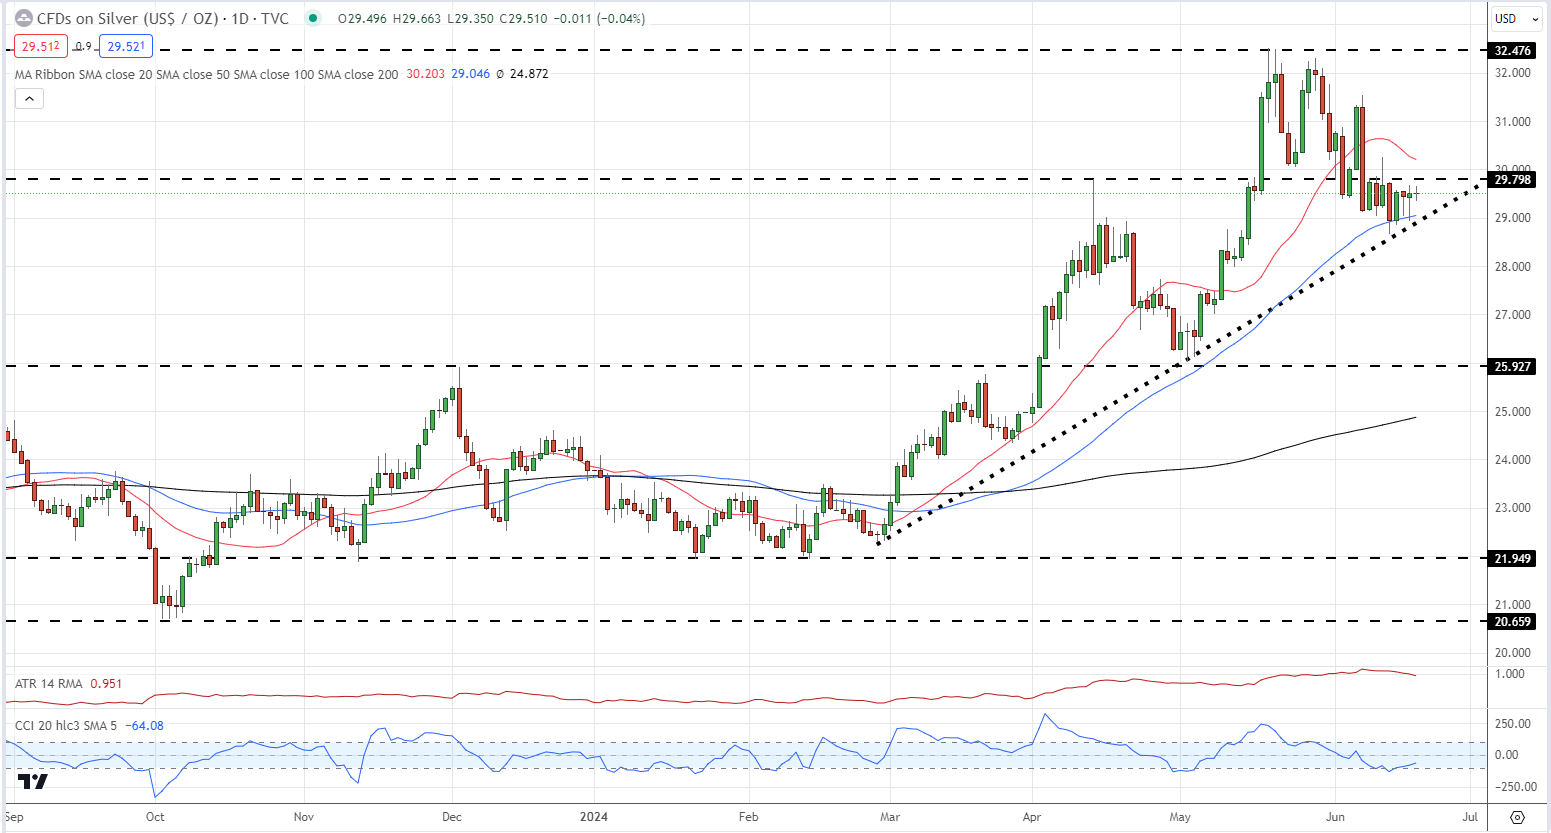
Silver is at an interesting point on the daily chart, continuing a multi-month pattern of higher-lows and higher-highs while also testing trend support. If trend support fails, then Silver may become trapped between $25.93/oz. and $29.80/oz. and start to build a range like gold. The CCI indicator is in neutral territory – Silver is neither overbought or oversold – while only the 20-day sma is in the way of higher prices. Trend support remains important if Silver is to move higher, and if it does then the precious metal may well test the recent double high around $32.48/oz.

Silver Daily Price Chart

image7.png